


Abstract
In high-activity radioiodine therapies for differentiated thyroid cancer, blood dosimetry has been developed to estimate the maximum tolerable activity (MTA) of 131I that can be safely administered without leading to toxic effects. The reference protocol involves a series of both blood sampling (BS) and whole-body counting (WC) over a period of several days. The aim of this retrospective study was to identify simplified protocols without an appreciable loss of accuracy. Methods: Data from 211 thyroid cancer patients who received 124I blood dosimetries were retrospectively analyzed. BS and WC acquired at approximately 1–2, 4, 24, 48, and 96 h or longer after 124I administration were included. This dataset was used to determine the reference MTA and estimations based on a reduced number of combined data from BS and respective WC. MTA estimates were also determined on the basis of either BS or WC alone using some simplifying assumptions in the dosimetry approach. A simplified protocol was considered equivalent to the reference protocol if the estimates of 95% of the MTAs were within the ±20% range and the absolute maximum percentage deviation did not exceed the limit of 30% in a few cases. Lin’s concordance correlation analysis was applied to assess the protocol’s agreements. Results: Two equivalent protocols were identified that included both BS and respective WC acquired at only 3 time points (1–2, 24 or 48, and ≥96 h). Further equivalent protocols with only 3 blood samples drawn at similar time points were discovered for patients, who had undergone at least 1 radioiodine therapy. For all equivalent protocols, deviations of the mean absolute percentage MTA were below 9% and Lin’s concordance correlation coefficients of 0.95 or greater were found, indicating almost excellent agreement (according to Partik’s criteria). Conclusion: The pretherapy blood dosimetry protocol can be substantially shortened and may be beneficial to patients and patient management while reducing the radiation exposure to medical staff.
Radioiodine therapy is an established approach to the management of differentiated thyroid cancer after total thyroidectomy. When treating metastatic disease, typically between 3.7 and 7.4 GBq of 131I activity is administered (1). Higher activities can be used to increase the therapy efficacy for metastases; however, the amount of 131I is limited by life-threatening radiogenic damages of the organs at risk. In particular, the absorbed (radiation) dose to the bone marrow is typically the limiting factor, but the absorbed dose to the lungs can also be critical, especially for patients with diffuse lung metastases and insufficient whole-body clearance of radioiodine (2).
Blood dosimetry has been developed to estimate the toxicity of a radioiodine therapy to avoid possible life-threatening radiation-induced bone marrow suppression and pneumonitis (3,4). This approach calculates the maximum tolerable 131I activity (MTA) that can be safely administered without producing toxic effects. The term blood dosimetry is used in line with the terminology found in current literature, although it is a dosimetry of the MTA or, even better, an organ-at-risk dosimetry in this study. The standard operational procedure (SOP) for pretherapeutic dosimetry published by the Dosimetry Committee (5) in 2008 involves a series of both blood sampling (BS) and external whole-body counting (WC) over a period of 4 d or longer. Other modifications and refinements to this blood dosimetry protocol until 2002 can be found in the review article by van Nostrand et al. (6). The BS and WC data are used to calculate the MTA that would deliver 2 Gy to blood (surrogate for bone marrow toxicity) or would result in a whole-body retention activity of 3.0 or 4.4 GBq after 48 h (surrogates for lung toxicity) in the presence or absence of diffuse pulmonary metastases, respectively (3,4). Historically, blood dosimetries are performed with 131I.
Over the last decade, the use of the positron-emitting 124I has become more frequent because of its higher sensitivity for detection of metastases relative to 131I (7–9) and its higher quantitative capacity using PET/CT than γ camera–based imaging technologies such as (whole-body) planar 131I scintigraphy (10). In this matched-pair approach, it is assumed that the radiopharmacokinetics of 124I are similar to 131I, which have been demonstrated for the blood compartment using diagnostic radioiodine activities (11).
In our institution, the individualized 124I dosimetry involves both lesion dosimetry using data from serial 124I PET/CT images and blood dosimetry to calculate the absorbed dose to lesions per unit 131I activity and the MTA, respectively. In addition to other key factors, the results are part of the decision-making process to determine the optimal amount of 131I activity for therapy (12). The benefit of such a dosimetry-guided approach is to maximize the absorbed dose to the lesions without inducing toxicity. For comparison, the historical Benua–Leeper approach developed at the Memorial Sloan Kettering Cancer Center (4) uses the MTA alone to guide the application of a large therapy activity. However, the overall dosimetry protocols are time-consuming and require a notable technical effort. For routine clinical practice, a simplification is highly desirable. For lesion dosimetry, we demonstrated that two 124I PET/CT scans acquired at 24 and ≥96 h were a reliable simplification of the comprehensive protocol using 5 or more PET/CT scans acquired over a period of 4 d or longer (13).
The focus of the present study is to simplify the blood dosimetry protocol for the following reasons. The SOP protocol (5) is comprehensive, although sometimes difficult to apply in clinical work. It is beneficial to patients, medical staff, and patient management to minimize the number of BS and WC data points. In addition to being time- and resource-consuming, repeated blood draws are sometimes difficult and uncomfortable for the patients, in particular BS from patients with poor veins. Moreover, from the radiation protection point of view, there is a potential risk of radioactive contamination of personnel with blood (14) and any unnecessary radiation exposure to medical staff should be avoided, in particular for patients to be treated with escalated 131I activities and those receiving intratherapeutic dosimetries. Additionally, time points of BS and WC may fall on weekends or public holidays; an assessment study is necessary to investigate the uncertainty involved when specific data points were not available. Another reason is related to the optimized 124I PET/CT imaging time points. It is favorable to perform BS and WC on the days of 124I administration and the PET/CT imaging time points (24 and ≥96 h) to optimize patient management.
For more than one decade, our department has been routinely applying 124I dosimetry in high-risk differentiated thyroid cancer patients to determine, inter alia, the MTA using the comprehensive blood dosimetry protocol (5). These data offer the potential to systematically examine the accuracy of the MTA when using simplified protocols, that is, only data from WC proposed by previous studies (15–17), but also other simplified protocols using a reduced number of combined BS and respective WC data points or even only BS. Thus, the aim of this retrospective study was to identify simplified blood 124I dosimetry protocols without an appreciable loss of accuracy.
MATERIALS AND METHODS
Study Design
All patients signed a written informed consent form, and the study was approved by the local medical research ethics committee. This study retrospectively analyzed 124I dosimetry data from high-risk differentiated thyroid cancer patients, who received PET/CT lesion and blood dosimetries. The following data were extracted: age, sex, weight, height, tumor histology, stage of disease, level of thyroid-stimulating hormone (TSH), stimulation type (exogenous or endogenous), level of thyroglobulin, and the number of preceding radioiodine therapies before 124I dosimetry. Diffuse pulmonary uptake was identified using functional images, that is, 24-h 124I PET/CT images (18) or whole-body 131I planar scintigraphy images acquired 7–10 d after radioiodine therapy.
Patient Preparation, Blood Sampling, and WC
All patients had undergone total thyroidectomy. The patients were either under endogenous TSH stimulation (by levothyroxine withdrawal for 4 wk) or under exogenous TSH stimulation (by use of recombinant human TSH) with sufficient TSH levels (≥25 mIU/L). The patients were instructed to be on a low-iodine diet for 4 wk before the 124I dosimetry. Iodine contamination was excluded by urine testing before individualized 124I dosimetry; patients were excluded if there were more than 250 μg of iodine per gram of creatinine. A capsule containing 20–50 MBq of 124I was administered after mandatory micturition. The patient endured without micturition (or defecation) until completion of the first WC measurement.
The blood 124I dosimetry protocol involved serial BS and WC. More precisely, heparinized blood samples were collected at 2, 4, 24, 48, and ≥96 h after 124I administration and measured in a well counter. The details of the calibrated 124I activity measurements have been published previously (10). The absolute activity concentration of the whole blood was determined and used to calculate the (projected) 131I uptake curve of the blood compartment. In the calculation, the individual patient’s total blood volume was predicted using the body-surface method recommended by the International Council for Standardization in Haematology (19). WC occurred at time points similar to the BS, except for the early time point (1 h instead of 2 h). The patient was positioned approximately 3 m in front of an uncollimated γ-camera detector. Anterior and posterior counts were acquired for the calculation of a geometric mean. After dead time correction, all geometric mean counts were normalized to the first data point to construct the (projected) whole-body 131I uptake curve. For BS or WC, reference standard was counted to examine the consistency of the well counter system or γ-camera system.
Reference and Simplified Protocols and Their Naming Convention
The reference protocol included the complete set of BS and WC data points. Simplified protocols included a reduced number of the combined BS and respective WC data points; this type of protocol is termed protocols C. Protocols that used data points from BS (type B) or from WC (type W) alone were also included. For obvious reasons, the data points of the first BS (2 h) and the first WC (1 h) were included in all of the simplified protocols.
Twelve simplified protocols were considered: C(24), C(48), C(24, 96), C(48, 96); W(24), W(48), W(24, 96), W(48, 96); and B(24), B(48), B(24, 96), B(48, 96). The first symbol of the protocol’s naming convention denotes the protocol type. The numbers within parentheses are the time points (in h) of the measured uptake values that were included in the respective protocols (in addition to the first uptake value). For instance, C(24) is a simplified protocol that included both BS data points acquired at approximately 2 and 24 h and WC data points acquired at approximately 1 and 24 h.
Blood and Whole-Body Residence Times and Absorbed Dose to Blood
To avoid ambiguity and maintain consistency for all protocols, no curve-fitting was applied. The blood and whole-body residence times were determined by separating the blood and whole-body uptake curves into 3 phases, that is, an early, a mid, and a late phase. Figure 1 schematically illustrates the 3 phases and the piecewise parameterization of representative uptake curves. In particular, for all protocols, an instant uptake was assumed, that is, the uptake at the zero time point equaled the uptake value of the early time point (early phase). The mid phase, the region between the early and the last uptake point (≥96 h), was parameterized using multiple single monoexponential functions. This approach is similar to the trapezoid method for computing the area under the curve, except that it approximates the uptake values between 2 measurements using a piecewise exponential rather than a piecewise linear function. In detail, the uptake values between 2 adjacent measured data points were interpolated (or extrapolated to 96 h if the last measured data point is not included) using a monoexponential function with an effective 131I half-life calculated by linear regression. Thus, the number of the single monoexponential functions within the mid phase was 4 for the reference protocol C(4, 24, 48, 96) (Fig. 1A) and 2 or 1 for the protocol C(24, 96) (Fig. 1B) or protocol C(24) (Fig. 1C), respectively. In the late phase, the uptake decreased exponentially with a 131I half-life, which equaled the effective 131I half-life of the last exponential function of the mid phase (Figs. 1B and 1C), unless its value was larger than the physical 131I half-life. In such a case, physical decay was assumed after the last measured uptake at ≥96 h (Fig. 1D); this occurred only for the blood uptake curve (in only 5 instances). For comparison purposes, an additional integration approach was applied. The uptake curves were fitted using biexponential functions, an approach recommended by the SOP (5). The fitting procedure was restricted to uptake curves that included the complete BS or WC data points. This protocol is referred to as SOP protocol and can be considered an alternative to the reference protocol.
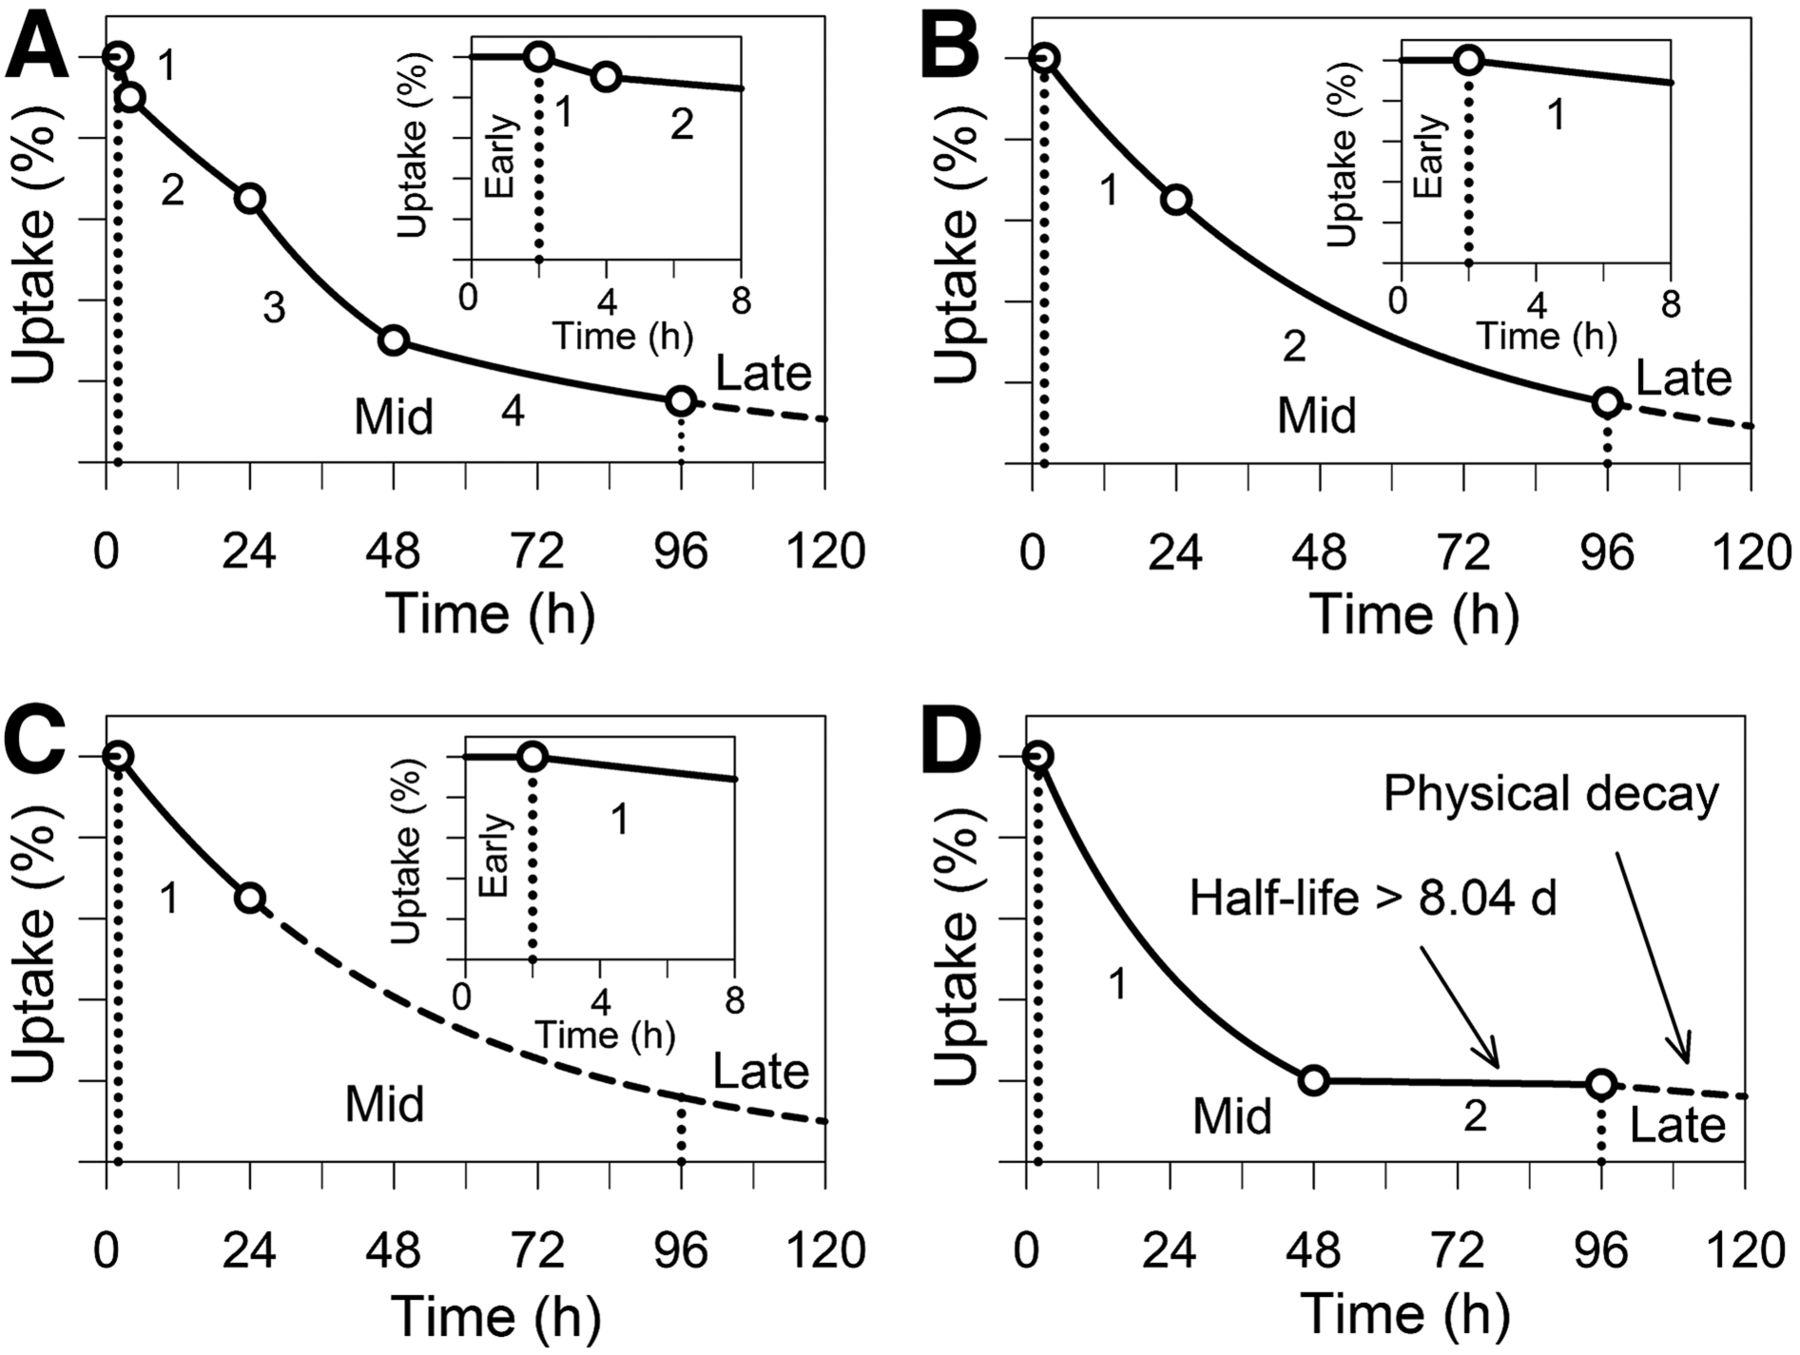
Schematic representation of uptake curves of reference protocol (A) and examples of simplified protocols (B–D). Different phases are indicated by vertical dotted lines. Numbers adjacent to lines represent monoexponential function. Dashed lines indicate extrapolated values. No numbers on uptake axes are shown.
For protocols of type C and the SOP protocol, both the residence times of the blood (τBS) and the residence times of the whole-body compartments (τWC) were used to calculate the blood dose per unit of administered (131I) activity (BDpA). The following numeric value equation was used (5): Eq. 1The symbols mP and VBS denote the mass and total blood volume of the patient, respectively. The first term is the contribution of the blood dose from β particles derived from BS; the second term is the effective contribution of the γ ray to the blood dose obtained from the WC. For protocols of type W and B, the concept proposed by Thomas et al. (15) was applied to calculate the blood dose per unit of administered activity. Because of the strong correlation between the activity of the blood and the whole-body compartments, either the BS data or the WC data can be disregarded. More precisely, the concept assumes that the blood and whole-body uptake curves can be linearly scaled onto each other. Historically, Thomas et al. (15) disregarded the BS data and used a scaling factor to predict the blood uptake curve for protocol of type W. Thomas’ scaling factor was fixed for all patients and was the mean ratio of the blood residence time to the whole-body residence time. For example, Thomas et al. (15) found on average a mean residence time ratio of 0.14 for 27 differentiated thyroid cancer patients bearing lesions. For the protocols of type B, a similar approach was used to scale the predicted whole-body uptake curve to the measured blood uptake curve. Because the whole-body uptake has to be 100% at the zero time point, the scaling factor for matching the predicted whole-body uptake curve to the measured blood uptake curve was calculated by dividing the 100-percentage value to the measured blood uptake at 2 h. Thus, dividing the blood residence time by the measured blood uptake at approximately 2 h revealed an approximation of the respective whole-body residence time. Therefore, inserting the respective scaling factors into Equation 1 allows estimation of the blood dose per unit of administered activity based on WC or BS alone.
MTA, Patient Groups, and Criteria for Protocol Equivalence
The MTA was calculated on the basis of a blood dose threshold of 2 Gy and an activity threshold of 3.0 or 4.4 GBq retained in the whole-body at 48 h in the presence or absence of diffuse pulmonary uptake, respectively. For each protocol, the blood dose per administered activity and the 48-h whole-body retention (R48) were used to determine the respective critical therapy activity. More precisely, 2 Gy divided by BDpA yielded the critical activity for possible bone marrow toxicity and 3.0 or 4.4 GBq divided by R48 yielded the critical activities for possible lung toxicities. The lowest critical therapy activity was taken as the MTA.
The patients were categorized into 2 patient groups. The first patient group comprised individuals who had not undergone any radioiodine therapies (group before treatment). The patients in the second group had undergone one or more radioiodine therapies (group after treatment). For each patient, the reference MTA and the residence time ratio (τBS/τWC) were determined using the reference protocol, and the mean residence time ratio was calculated for each patient group. Thereafter, the estimated MTAs derived from using the 12 simplified protocols and the SOP protocol were determined.
Comparisons between simplified protocols or SOP protocol and the reference protocols were assessed using the percentage MTA deviation from reference MTA and Lin’s concordance correlation coefficients (ρc). For each protocol, the percentage MTA deviation was illustrated using box plots, and the percentage of patients with percentage MTA deviations within the margin of ± 20%, the mean absolute percentage MTA deviation, and the absolute maximum percentage deviation were determined. A simplified protocol was considered equivalent to the reference protocol when both the estimated MTAs of 95% of the patients were within the ±20% deviation range and the maximum absolute percentage MTA deviation did not exceed the limit of 30% in a few cases. Lin’s concordance correlation coefficient along with the 2-sided lower and upper 95% confidence intervals were used to assess the strength of protocol agreement. With respect to a previous study (13), we applied Partik’s criteria, which designates ρc values >0.95 as excellent and >0.90 as very good.
Statistics
The descriptive statistics included the mean, median, SD, minimum, and maximum, which are provided in the following form: mean (median) ± SD (minimum to maximum). The correlation between different quantities was evaluated using the Pearson correlation coefficient; a significance level (P value) of <5% was considered statistically significant.
RESULTS
The clinical and dosimetry characteristics of the patient group before and after treatment are listed in Tables 1 and 2, respectively. Two hundred eleven patients were included with almost equal patient numbers in each patient group. The activity-limiting organ was the bone marrow in 94% of patients. The mean residence time ratio was 0.11 and 0.13 for the patient group before and after treatment, respectively. The mean initial blood uptake of approximately 14% was almost identical in both patient groups. On average, approximately three quarters of the total blood dose arise from β-particle radiation.
Demographic and Clinical Characteristics
Dosimetry Characteristics Derived from Using Reference Protocol
Figure 2 illustrates the relationship between whole-body and blood residence times that was derived from the complete BS and WC data. A higher Pearson correlation coefficient and considerably less scatter were found in the patient group after treatment (r = 0.83) than in the patient group before treatment (r = 0.71). Excluding 2 outliers marked with arrows in Figure 2B, data points of 2 elderly patients (83 and 73 y) with extended tumor masses, the Pearson correlation coefficient of the patient group after treatment increased to 0.94, indicating a very high correlation.
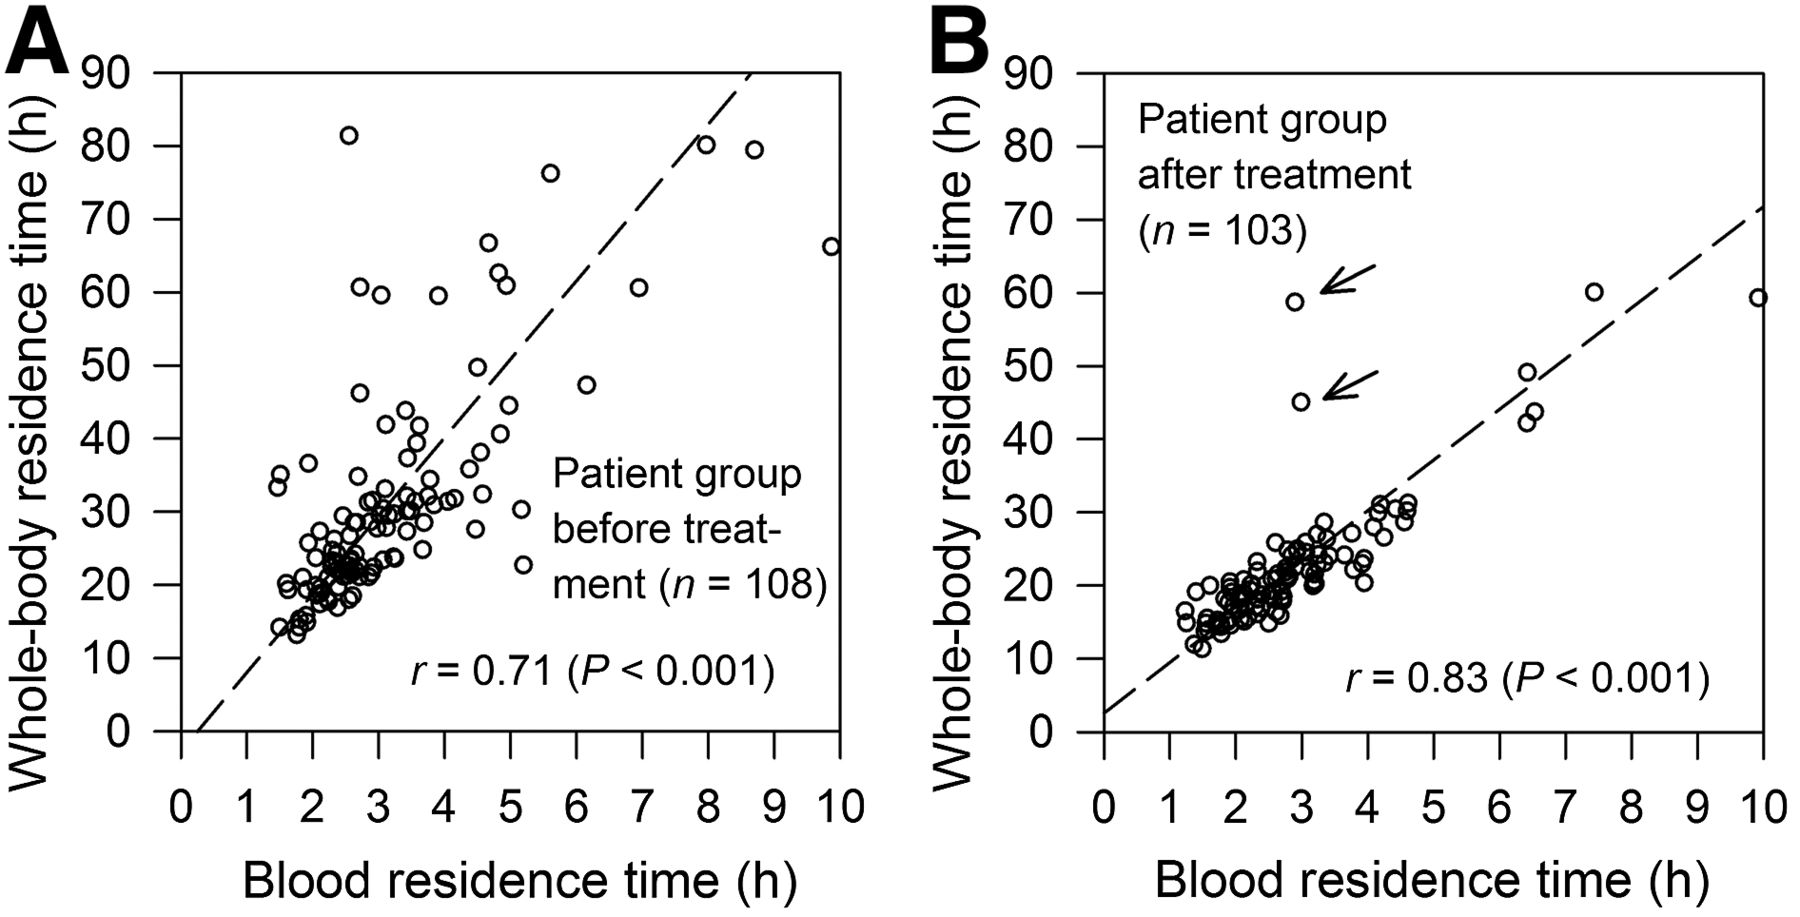
Relationship between whole-body residence time vs. blood residence time for patient group before (A) and after treatment (B). Outliers (B) are marked with arrows. Dashed lines indicate reduced major axis regression lines.
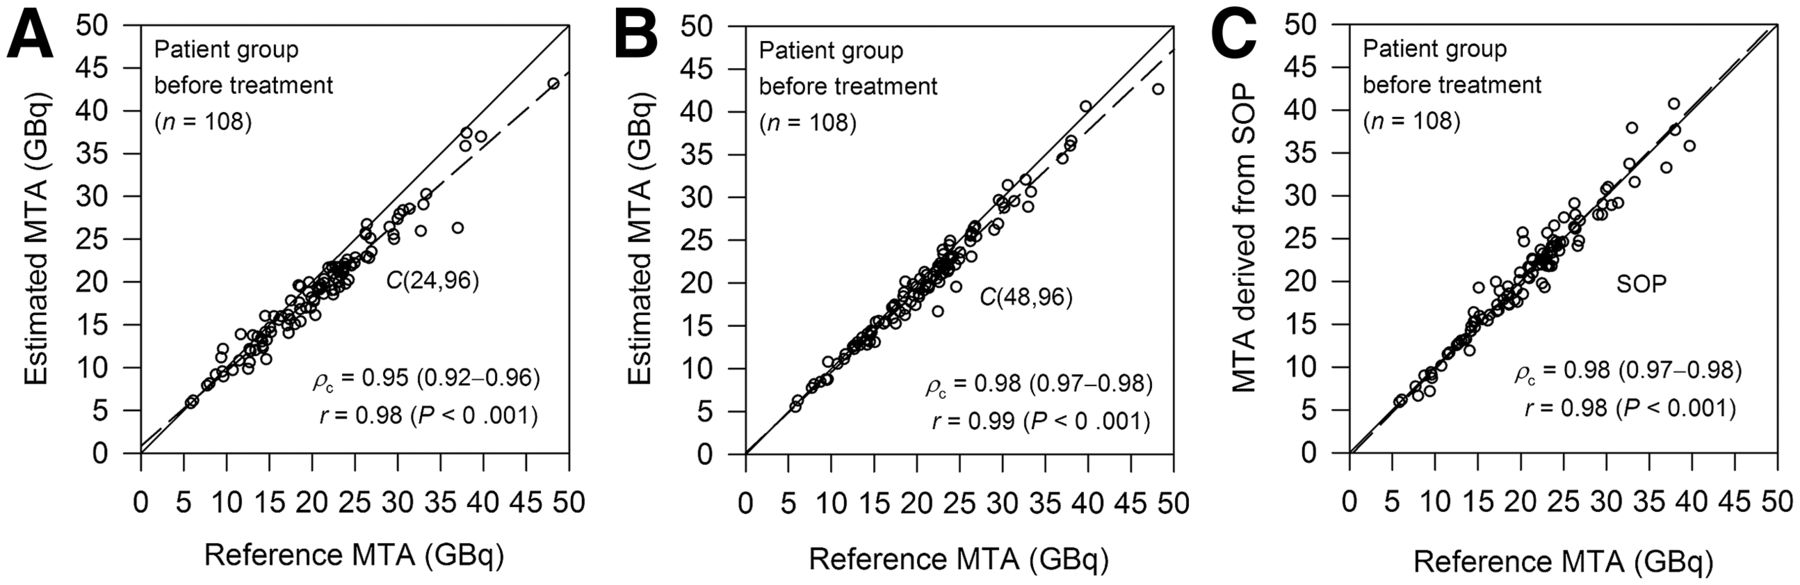
Percentage MTA deviations from reference MTA of the 12 simplified protocols and the SOP protocol are illustrated in Figure 3. For each protocol, Supplemental Tables 1 and 2 (supplemental materials are available at http://jnm.snmjournals.org) list the Lin’s concordance correlation coefficient, percentage of patients with MTA deviations within ±20%, the mean absolute deviation, and the deviation range. Four equivalent protocols were found: C(24,96) and C(48,96) for both patient groups and B(24,96) and B(48,96) for the patient group after treatment. For all equivalent protocols, the mean absolute percentage MTA deviations were <9% and Lin’s concordance correlation coefficients of ≥0.95 were found, indicating almost excellent agreements. Lin’s concordance correlation plots of selected equivalent protocols are shown in Figures 4 and 5. For protocol C(24,96) applied for patients before treatment and protocol B(24,96) applied for patients after treatment, only 1% of the patients had MTA estimates > 20%–30% of the reference MTA. None of the patients yielded MTA estimates > 20% for protocol C(48,96) and protocol B(48,96) applied for patients before and after treatment, respectively.
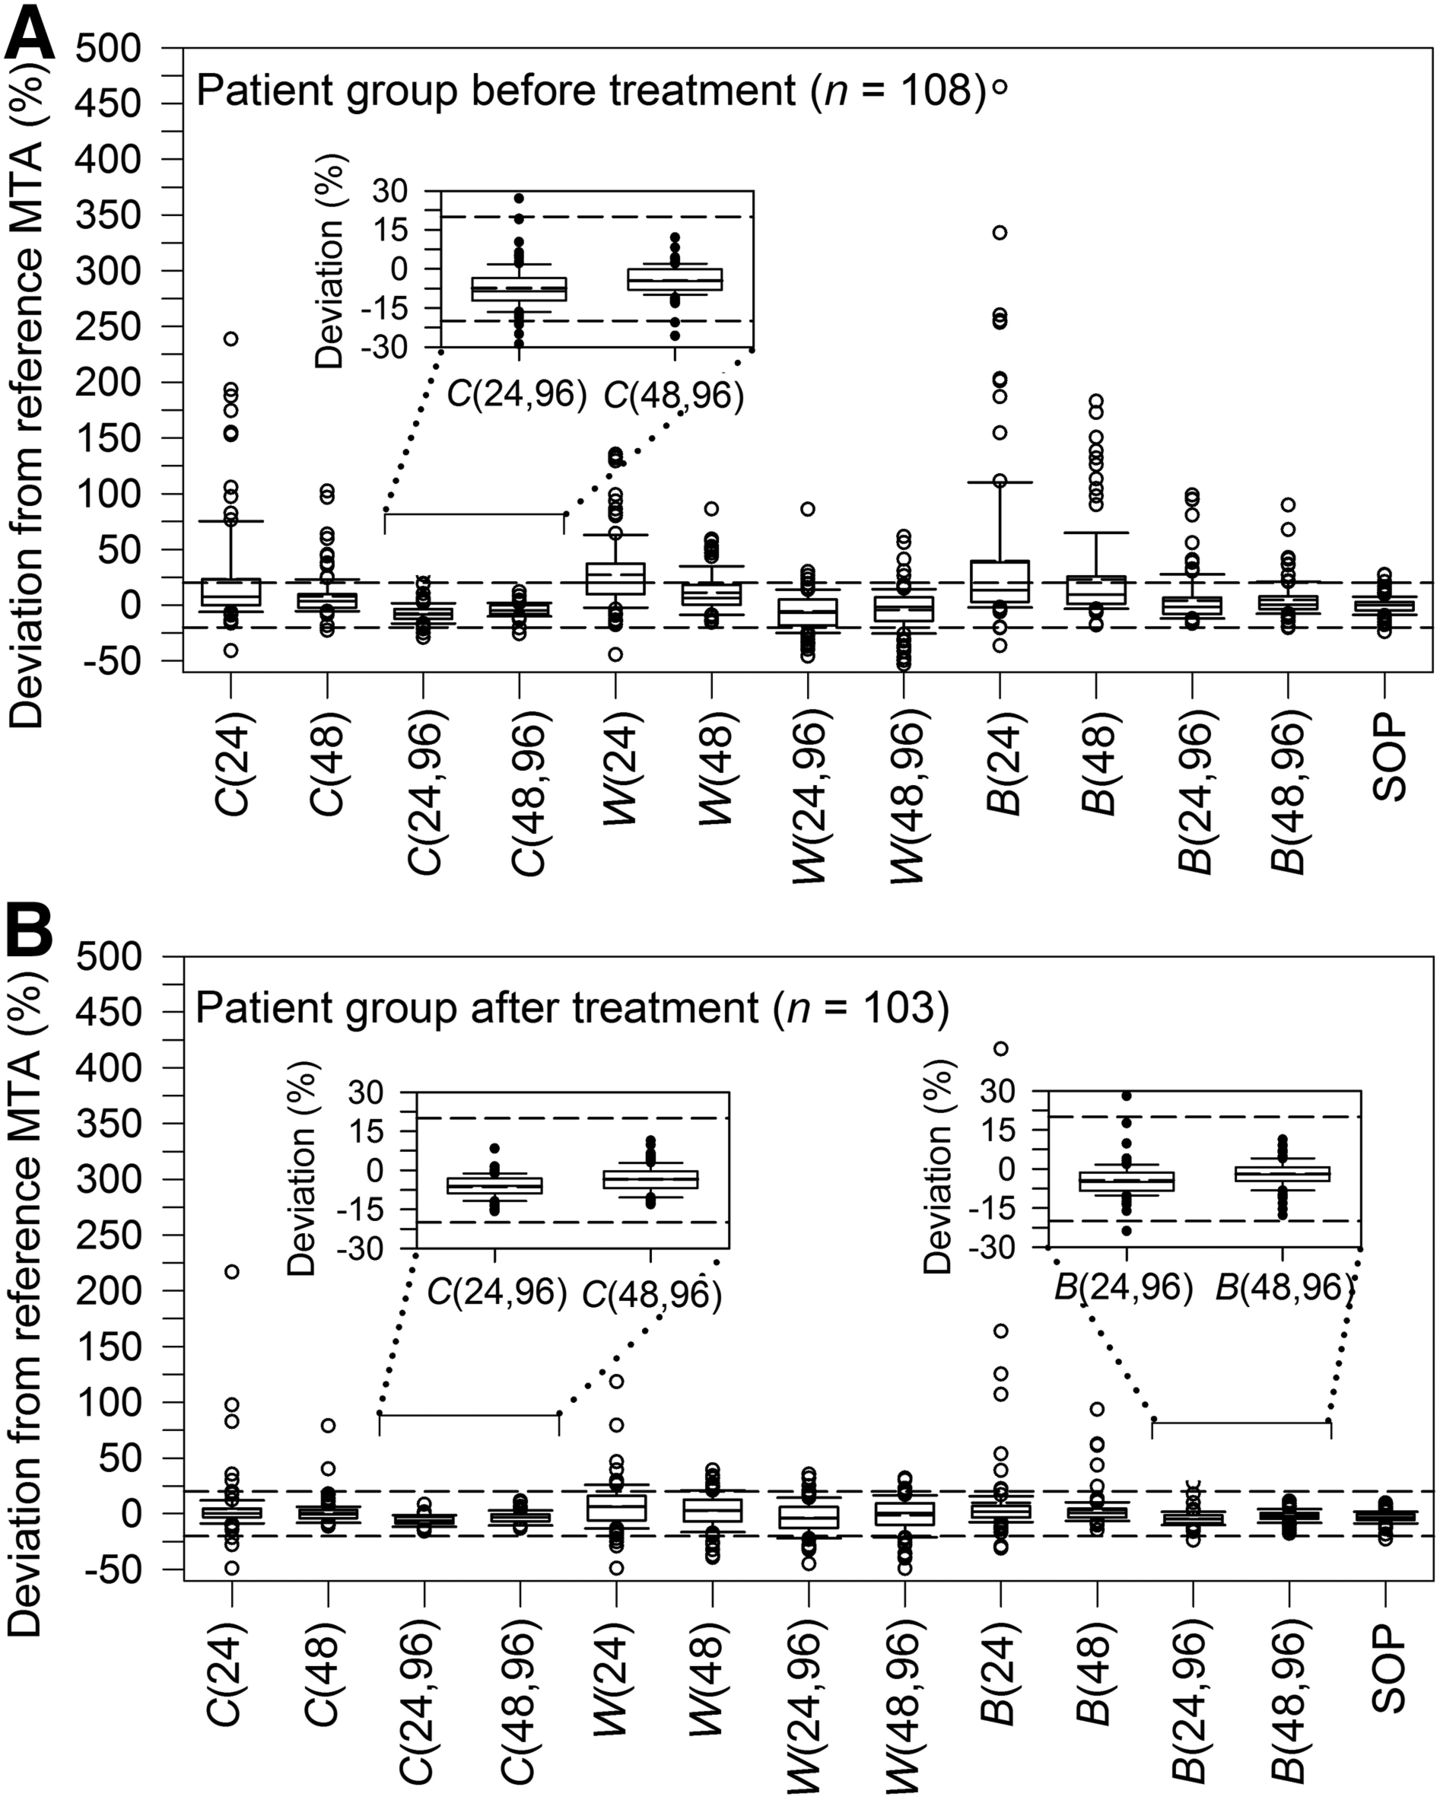
Box plot representation of distribution of percentage MTA deviation in patient group before (A) and after treatment (B) for simplified protocols and SOP protocol. Horizontal dashed lines indicate percentage deviation range of ±20%. Inserts show enlarged view of MTA deviations of equivalent protocols.

Lin’s concordance correlation plots of equivalent protocols (A, B) found in this study and of SOP protocol (C) for patient group before treatment. Lines of identity (45° line) and reduced major axis regression lines are shown by solid and dashed lines, respectively.
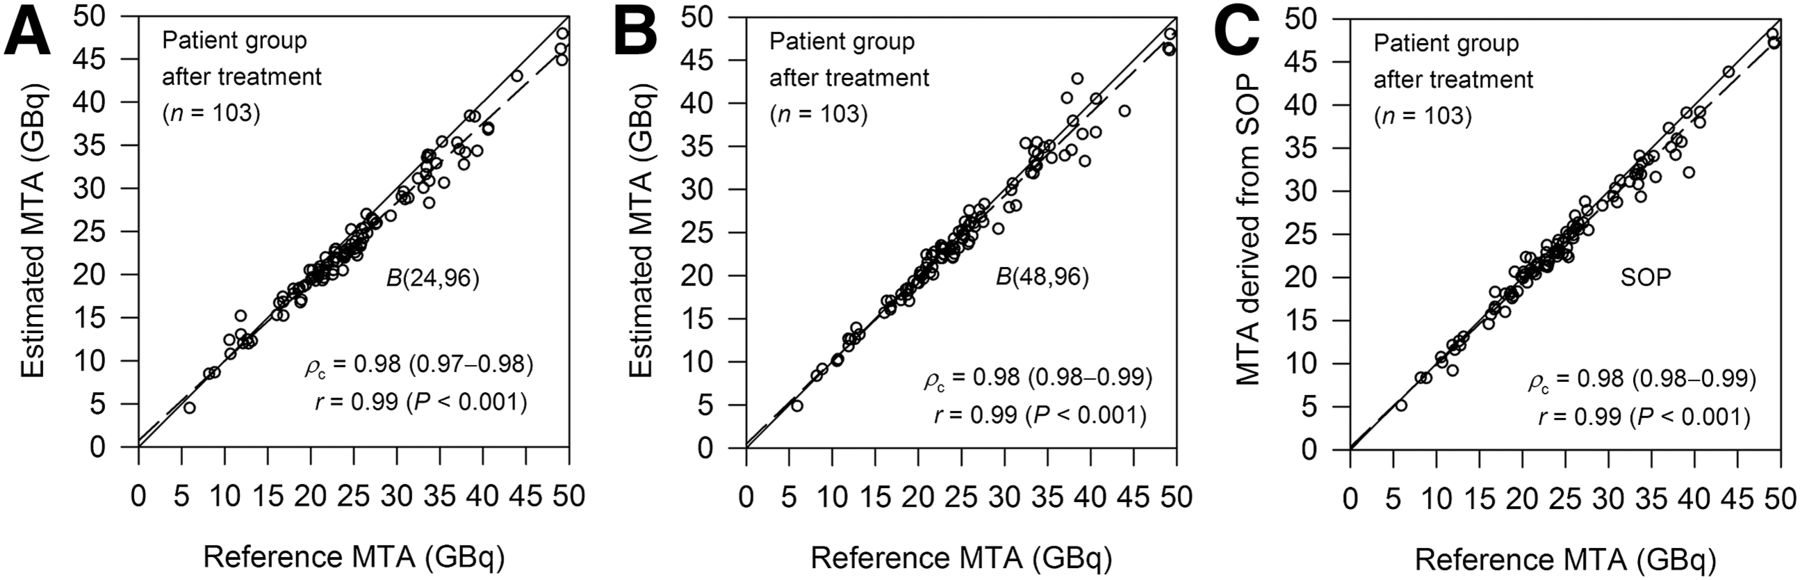
Lin’s concordance correlation plots of equivalent protocols (A, B) found in this study and of SOP protocol (C) for patient group after treatment. Plots of 2 other equivalent protocols, C(24,96) and C(48,96), are not shown. Lines of identity (45° line) and reduced major axis regression lines are shown by solid and dashed lines, respectively.
Figure 3 also illustrates the deviations between the MTAs derived from the SOP protocol and the reference protocol. The reference and SOP protocols showed remarkable agreement. In both patient groups, the mean absolute deviation was 5% and the minimum and maximum deviations were –24% and 27%, respectively (Supplemental Tables 1 and 2). Of note, ≥96% of the MTA deviations were within ±20% deviation range. Lin’s concordance correlation plots are shown in Figures 4C and 5C, with a Lin’s concordance correlation coefficient of 0.98 (excellent similarity).
DISCUSSION
A key issue in this study is the definition of the protocol equivalence. The equivalence criteria applied were prudently selected and are associated with the main uncertainty factors inherent in the methodology. First, the bone marrow is primarily the organ at risk in high-activity radioiodine therapies. In this study, the MTA is limited by the predicted blood dose per administered activity in 94% of the patients (Table 2). Hence, the estimated blood dose per administered activity and the 2-Gy blood dose threshold are the crucial quantities in the MTA determination. The blood dose threshold of 2 Gy was introduced by Benua et al. (3) in the early 1960s. A recent study by Dorn et al. (20), who applied MIRD methodology, demonstrated that the absorbed dose estimates delivered to the red marrow can be safely increased to 3 Gy—a 50% deviation from 2 Gy—with no permanent marrow suppression. Because the bone marrow doses are lower than the blood doses for fixed blood and whole-body residence times (5), a maximum overestimation of the MTA by 30%, observed in only a few extreme cases, may be still safe and acceptable. Second, the residence times for the blood and whole-body compartments were calculated by integrating the respective uptake curves from zero to infinity. In this study, a trapezoidlike approach was used to avoid curve-fitting. In contrast, biexponential fitting is recommended by the SOP (5). Figure 3 illustrates the deviations between the MTAs. The statistics revealed remarkable agreement between the 2 approaches (Supplemental Tables 1 and 2; Figs. 4C and 5C), but absolute maximum deviations of approximately 30% were observed and ≥96% of the MTA deviations between the 2 integration approaches were within ±20% deviation range. Third, the predicted MTA may differ from the actual MTA obtained under therapeutic conditions. For example, Sisson et al. (21) compared the 48-h whole-body retention of tracer and therapeutic 131I activities in 43 patients. They observed a good overall correlation, but a retention difference of approximately –8% to 13% was observed, a range that can also be expected for the blood dose estimates. Thus, the selected equivalence criteria appear reasonable.
A reliable MTA requires the measurements of radioiodine distribution volumes over time for the blood and whole-body compartments. Their residence times depend on the level of radioiodine accumulation in tumors, thyroid remnant tissues, and other body parts, such as the gastrointestinal tract. A high correlation between the 2 compartments is expected. Figure 2 illustrates the correlation between the residence times. A higher Pearson correlation coefficient and considerably less scatter were found in the patient group after treatment than in the patient group before treatment. The lower correlation level and the larger scatter in the patient group before treatment are probably associated with the presence of larger variation of thyroid remnant and tumor masses, resulting in varying uptake levels and half-lives of the radioiodine-accumulating tissues. Thus, before the first radioiodine therapy, both BS and WC measurements may be required for a reliable MTA estimate, whereas for the patient group after treatment either BS or WC data may be well suited to quantify the MTA because of the stronger linear relationship between the whole-body and blood residence times.
This suggestion was largely confirmed in this study and is reflected in the search of equivalent protocols. For the patient group before treatment, the equivalent protocols were C(24,96) or C(48,96), requiring both BS and respective WC data in agreement with the expectation. For the patient group after treatment, protocols B(24,96) or B(48,96) are reliable substitutes for the reference protocol and agreed with the expectation as well; however, protocols W(24,96) or W(48,96) did not fulfill the equivalence criteria. This finding is primarily related to the higher contribution of β radiation to the total blood dose in most patients and secondarily a consequence of the simplifying assumption made in the dosimetry approach for the protocols of type W. First, from the dosimetry point of view, protocol of type B is more appropriate than protocol of type W simply because β-particle radiation assessed by blood activity measurements yield on average almost three quarters of the total blood dose (Table 2). Second, for all patients after treatment, a fixed scaling factor of 0.13 (the residence time ratio listed in Table 2) was used for W(24,96) and W(48,96) to predict the blood residence times, whereas protocols of type B used an individualized, patient-specific scaling factor based on the measured blood uptake at 2 h. Hence, protocols B(24,96) and B(48,96) provide a better prediction of the residence times of the respective nonmeasured compartment, that is, the whole-body compartment.
The simplified protocols included in this study may be compared with other published protocols (15–17). The WC-based methodology is intriguing and obvious because of the strong radioiodine activity correlation between the blood and whole-body compartments (Fig. 2). The published studies use only WC data (15) or, even simpler, only a single whole-body retention value to determine the MTA (16,17). Two studies (15,16) assumed that the blood uptake curve was linearly related to the whole-body uptake curve and that they can be matched by a scaling factor, a methodology used for the protocols of type W and B in this study. Historically, Thomas et al. (15) introduced the WC-based methodology and showed in 49 patients that the mean percentage deviation from the classic protocol was within ±10% (percentage difference range, –31% to 15%). In a more recent study, Hänscheid et al. (16) included 88 patients and favored 2 protocols that use a single whole-body retention at 24 or 48 h, identical to protocol W(24) or W(48) in this study. Their mean percentage deviation was approximately –13%, and the deviations ranged from –33% to 51%. The percentage deviations observed in both studies (15,16) did not agree with the present study when the corresponding simplified protocols were used (Supplemental Tables 1 and 2): notably higher deviation ranges were observed in most cases. The heterogeneous patients included in the studies may be the primary reason for the obvious discrepancies. The last relevant simplified protocol was published by van Nostrand et al. (17), who refined the WC-based methodology using a biexponential regression model derived from a group of 142 patients. They predicted the MTAs based on the single whole-body retention at 48 h and the patient’s body surface. The absolute percentage deviations between the model-based MTA and the MTA derived from the classic protocol were >20% in approximately 15% (21/142) of the patients, and the MTA deviations ranged from approximately –46% to 30%. Data were derived from Figure 3 in van Nostrand et al.’s study. As stated by the authors (17), the observed deviations are unacceptable in clinical practice.
It is important to mention that the intention of the published WC-based methodology was not to replace the classic protocol but to demonstrate that a first-order approximation of the blood dose is easily feasible and to identify patients in whom the therapy activity may be increased or decreased without producing toxic effects. The authors (15–17) explicitly stressed that for more precise blood dose estimates or MTAs, both BS and WC are recommended.
Finally, concern has been raised by Robeson et al. (22) about the WC-based methodology. The authors published their results in abstract form and analyzed 17 patients. Acceptable estimates (within ±20% percentage deviation range, a criterion also used in this study) were found in 35% (only 6 patients), a value that cannot be confirmed in the present study (75%–85%). They concluded, however, that BS should be an integral part of determining blood doses or MTAs reliably. This study also corroborates the authors’ main conclusion (for both patient groups).
CONCLUSION
The reference or SOP protocol remains certainly the most accurate protocol and should be performed whenever possible. The equivalent protocols identified are well suited to estimate the MTA or blood dose per unit of administered activity in pretherapy dosimetry, and their application may be beneficial to patients, staff, and patient management. Further studies on a separate group of patients are warranted to validate the equivalent protocols.
DISCLOSURE
The costs of publication of this article were defrayed in part by the payment of page charges. Therefore, and solely to indicate this fact, this article is hereby marked “advertisement” in accordance with 18 USC section 1734. No potential conflict of interest relevant to this article was reported.
Footnotes
Published online Apr. 9, 2015.
- © 2015 by the Society of Nuclear Medicine and Molecular Imaging, Inc.
REFERENCES
- Received for publication December 22, 2014.
- Accepted for publication March 23, 2015.


Jump to section
Related Articles
Cited By...
- Tumor Dose-Response Relationship of [131I]MIBG Therapy in Patients with Neural Crest Tumors by Means of [124I]MIBG PET
- Efficacy and Safety of 124I-MIBG Dosimetry-Guided High-Activity 131I-MIBG Therapy of Advanced Pheochromocytoma or Neuroblastoma
- Diagnostic Performance of 124I-Metaiodobenzylguanidine PET/CT in Patients with Pheochromocytoma
- Reimbursement Approaches for Radiopharmaceutical Dosimetry: Current Status and Future Opportunities
- Dosimetry in Clinical Radiopharmaceutical Therapy of Cancer: Practicality Versus Perfection in Current Practice
- Alternative Means of Estimating 131I Maximum Permissible Activity to Treat Thyroid Cancer
- Iodine Symporter Targeting with 124I/131I Theranostics
- Fixed 3.7-GBq 131I Activity for Metastatic Thyroid Cancer Therapy Ignores Science and History
- 124I PET Assessment of Response of Bone Metastases to Initial Radioiodine Treatment of Differentiated Thyroid Cancer
- High Level of Agreement Between Pretherapeutic 124I PET and Intratherapeutic 131I Imaging in Detecting Iodine-Positive Thyroid Cancer Metastases