


Abstract
Choline kinase is upregulated in prostate cancer, resulting in increased 18F-fluoromethylcholine uptake. This study used pharmacokinetic modeling to validate the use of simplified methods for quantification of 18F-fluoromethylcholine uptake in a routine clinical setting. Methods: Forty-minute dynamic PET/CT scans were acquired after injection of 204 ± 9 MBq of 18F-fluoromethylcholine, from 8 patients with histologically proven metastasized prostate cancer. Plasma input functions were obtained using continuous arterial blood-sampling as well as using image-derived methods. Manual arterial blood samples were used for calibration and correction for plasma-to-blood ratio and metabolites. Time–activity curves were derived from volumes of interest in all visually detectable lymph node metastases. 18F-fluoromethylcholine kinetics were studied by nonlinear regression fitting of several single- and 2-tissue plasma input models to the time–activity curves. Model selection was based on the Akaike information criterion and measures of robustness. In addition, the performance of several simplified methods, such as standardized uptake value (SUV), was assessed. Results: Best fits were obtained using an irreversible compartment model with blood volume parameter. Parent fractions were 0.12 ± 0.4 after 20 min, necessitating individual metabolite corrections. Correspondence between venous and arterial parent fractions was low as determined by the intraclass correlation coefficient (0.61). Results for image-derived input functions that were obtained from volumes of interest in blood-pool structures distant from tissues of high 18F-fluoromethylcholine uptake yielded good correlation to those for the blood-sampling input functions (R2 = 0.83). SUV showed poor correlation to parameters derived from full quantitative kinetic analysis (R2 < 0.34). In contrast, lesion activity concentration normalized to the integral of the blood activity concentration over time (SUVAUC) showed good correlation (R2 = 0.92 for metabolite-corrected plasma; 0.65 for whole-blood activity concentrations). Conclusion: SUV cannot be used to quantify 18F-fluoromethylcholine uptake. A clinical compromise could be SUVAUC derived from 2 consecutive static PET scans, one centered on a large blood-pool structure during 0–30 min after injection to obtain the blood activity concentrations and the other a whole-body scan at 30 min after injection to obtain lymph node activity concentrations.
- positron emission tomography (PET)
- prostate cancer
- choline
- tracer kinetic modeling
- standardized uptake value (SUV)
Prostate cancer (PCa) is one of the most commonly diagnosed neoplasms in men worldwide, and incidence is increasing (1). Accurate diagnostic procedures are essential, because therapeutic options vary greatly with extent of the disease (1,2). Conventional imaging techniques, including transrectal ultrasound and CT and MR imaging, are used routinely in PCa, but their diagnostic accuracy is suboptimal (3).
PET provides a sensitive and accurate noninvasive method to study metabolic activity of tumor tissue in vivo. The most commonly used oncologic PET tracer, 18F-FDG, shows limited sensitivity for the detection of androgen-dependent PCa (4). In contrast, encouraging results have been published using both 11C- and 18F-labeled choline derivatives as PET tracers for PCa (5–9).
The amino acid choline is an important precursor for the biosynthesis of phosphatidylcholine, a key component of the cell membrane phospholipids. After transport into the cell, choline is phosphorylated by choline kinase to phosphocholine and trapped within the cell (10). Most types of cancer, including PCa, are characterized by increased choline transport and overexpression of choline kinase, in response to the enhanced demand of phosphatidylcholine in highly proliferating cells (6,11).
Because of its longer half-life (12), 18F-labeled choline is more suitable for routine clinical use than 11C-labeled choline. At present, 18F-fluoromethylcholine is used mainly for restaging of PCa in the case of biochemical relapse. As uptake of 18F-fluoromethylcholine should reflect viable tumor tissue, changes over time may serve as a measure of response to therapy. For monitoring response to systemic treatment in metastasized PCa, however, accurate quantification is required.
To date, 18F-fluoromethylcholine biodistribution has been assessed with encouraging results (13–16), but full kinetic analysis has not yet been reported. In the present study, pharmacokinetic modeling of dynamic PET data in combination with arterial blood sampling was used to determine the appropriate plasma input compartment model for 18F-fluoromethylcholine. In addition, the validity of using an image-derived input function in combination with manual venous blood samples instead of arterial blood sampling was investigated, and the validity of using simplified methods for quantification of 18F-fluoromethylcholine was assessed.
MATERIALS AND METHODS
Eight patients with histologically proven PCa with lymphatic or hematogeneous metastases were included. Inclusion criteria were the presence of at least 2 metastases (diameter ≥ 1.5 cm) and ability to remain supine for 50 min. Exclusion criteria were claustrophobia, multiple malignancies, and anticoagulant therapy. The study was approved by the Medical Ethics Review Committee of the VU University Medical Center. Before inclusion, each patient signed a written informed consent form after receiving verbal and written explanation.
Synthesis of 18F-Fluoromethylcholine
18F-fluoromethylcholine was synthesized according to the methods proposed by DeGrado et al. (6) with minor modifications and by use of automated modules (17). Details are given in the supplemental data (supplemental materials are available at http://jnm.snmjournals.org).
Data Acquisition
Each patient underwent a low-dose CT scan (50 mAs, 120 kVp), followed by a 40-min dynamic PET scan with the field of view centered over the largest metastases (abdominal region, n = 5; lung area, n = 3), on a Gemini TF-64 PET/CT scanner (Philips). At the start of the PET scan, a bolus injection of approximately 204 ± 9 MBq of 18F-fluoromethylcholine (specific activity, 94.9 ± 65.7 GBq·μmol−1) was administered intravenously using an automated injector (Medrad) and flushed with 40 mL of saline (5 mL at 0.8 mL·s−1, followed by 35 mL at 2 mL·s−1). PET data were normalized and corrected for attenuation, dead time, randoms, scatter, and decay and reconstructed into 34 frames (1 × 10, 8 × 5, 4 × 10, 3 × 20, 5 × 30, 5 × 60, 4 × 150, and 4 × 300 s), with a matrix size of 144 × 144 × 45 voxels (4 × 4 × 4 mm) using a 3-dimensional row-action maximum-likelihood reconstruction algorithm (18).
Arterial blood activity concentration over time was determined by continuous arterial blood sampling (5 mL·min−1 for 5 min, 2.0 mL·min−1 thereafter) using an automated blood-sampling device (19) connected to a cannula inserted into the radial artery. At 6 time points (5, 10, 15, 20, 30, and 40 min after injection), manual arterial blood samples were collected, while the blood sampler operation was briefly paused. In addition, manual venous blood samples were collected at 5, 15, and 30 min after injection. After each sample, the cannula was flushed with heparinized saline to prevent clotting.
Each manual sample was analyzed for whole-blood activity concentration, plasma–to–whole blood ratio, and presence of radiolabeled metabolites in plasma. After plasma protein extraction, metabolite analysis was performed on the remaining plasma (extraction efficiency, 88%) using a method based on Sutinem et al. (11) involving high-performance liquid chromatography.
Kinetic Analysis
In pharmacokinetic modeling, tracer kinetics are assumed to be separable into compartments that are connected in series to the arterial blood compartment, represented by the plasma input function, by (transport) rate constants. For example, in the irreversible 2-tissue-compartment model (2T3k) the first compartment often represents tracer free in tissue, and the second represents irreversible specific uptake. From the rate constants connecting the compartments, the net influx rate (K1) for the second compartment can be calculated: Ki = K1k3/(k2 + k3). The supplemental data provide more details on each of the models and associated quantification parameters.
Metabolite-corrected blood sampler plasma input functions (BSIFs) were derived from blood sampler data (corrected for intermittent reductions in counts associated with saline flushes), calibrated using whole-blood activity concentrations measured from manual arterial blood samples. In addition, data were multiplied by the plasma-to-blood ratio curves and parent fraction curves derived from manual arterial blood samples using a single exponential fit and Watabe fit (20), respectively, and corrected for delay (21). Metabolite-corrected image-derived plasma input functions (IDIFs) were derived from volumes of interest (VOIs) (2.85 ± 1.65 mL; range, 0.64–5.89 mL) defined manually on an early PET frame most clearly displaying the blood pool (Fig. 1A), within the largest arterial blood-pool structures available (left ventricle or aortic, femoral, or iliac arteries). These VOIs were then projected onto the dynamic PET scan to derive time–activity curves, which were processed in the same fashion as BSIF.
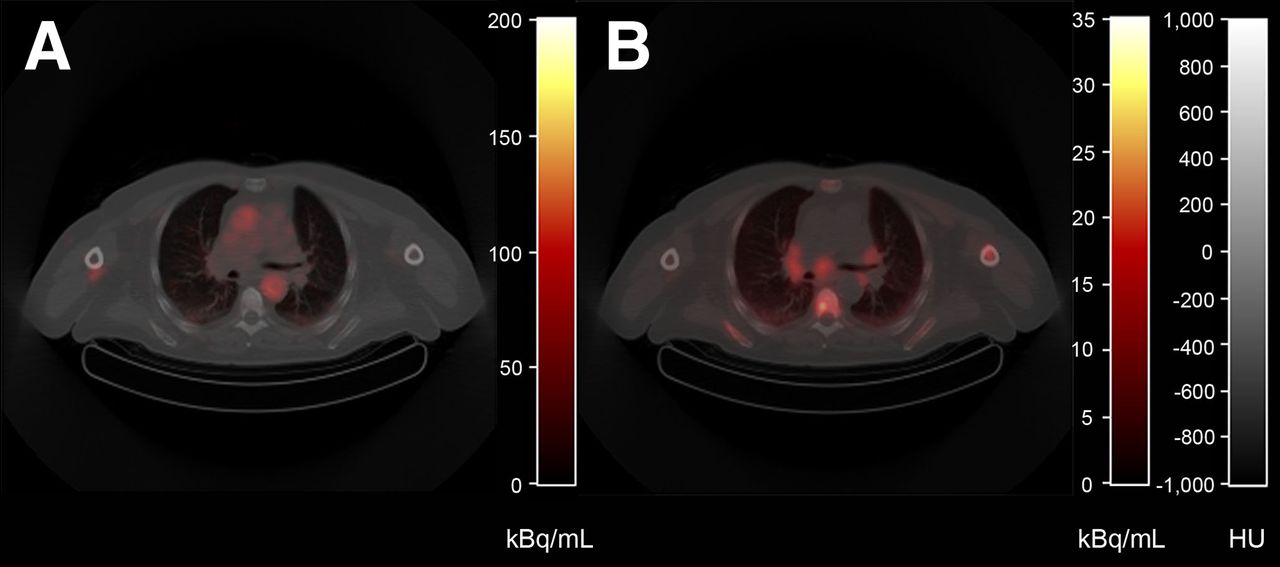
Typical example of PET/CT images acquired from patient diagnosed with PCa. Shown are low-dose CT (gray scale) fused with early PET image acquired from 35 to 40 s after injection displaying blood pool (A) and averaged image over 25–40 min after 18F-fluoromethylcholine injection (B) (color).
Tissue time–activity curves were derived from several tissue VOIs. Lesion VOIs were defined using a 50% threshold technique with background correction, in all metastatic lymph nodes that were clearly visible on the averaged PET image over 25–40 min after injection (24 in total; 4.76 ± 3.54 mL; range, 0.7–12.8 mL). Healthy tissue VOIs were manually defined using the low-dose CT (muscle, fat, liver).
Several standard compartment models were then fitted to the lesion time–activity curves using standard nonlinear regression analysis routines (22), with both BSIF and IDIF as input functions. Models evaluated were the irreversible and reversible single-tissue-compartment models (1T1k and 1T2k, respectively) and the irreversible and reversible 2-tissue-compartment models (2T3k and 2T4k, respectively). To account for contribution from blood activity to the tissue time–activity curves, the performance of all models was evaluated with and without blood volume parameter (VB). Boundary conditions for all estimated kinetic parameters were determined after multiple runs (K1: [0,3], k2: [0,2], k3/k4: [0,10], and VB: [0,1]). Fits with low precision (as indicated by SE > 500% in at least 1 of the estimated rate constants) were considered unsuccessful and excluded from further analysis. The robustness of the model was evaluated as the percentage of successfully fitted lesion time–activity curves.
Validation
Model Selection
The model providing the best fits to the lesion time–activity curves was selected on the basis of the Akaike information criterion (AIC) for small sample sizes (23) and model robustness. In clinical practice, lengthy (dynamic) scanning procedures are less attractive. Therefore, the minimal scan duration required to derive accurate results was assessed by comparing relevant uptake parameters resulting from kinetic modeling of parts of the dynamic scan (0–5, 0–10, 0–15, 0–20, 0–25, or 0–30 min after injection) with those of the full dynamic scan (0–40 min after injection).
Alternatives to Arterial Blood Sampling
Deriving an accurate plasma input function requires insertion of an arterial cannula, automated blood sampling, and specialist metabolite analysis. As these methods may not be feasible in a routine clinical setting, the validity of using IDIF instead of BSIF as well as the need for manual arterial or venous blood samples were assessed.
Simplified Methods
Once validated, simplified methods can provide estimates of relevant uptake parameters using a far simpler imaging protocol than that required for full kinetic modeling. Therefore, the performance of several simplified measures was evaluated, for example, lesion-to-muscle ratio (LMr), lesion-to-blood ratio (LBr), and standardized uptake value (SUV) for several normalization factors: body weight, body surface area, lean body mass, body mass index, and ideal body weight.
RESULTS
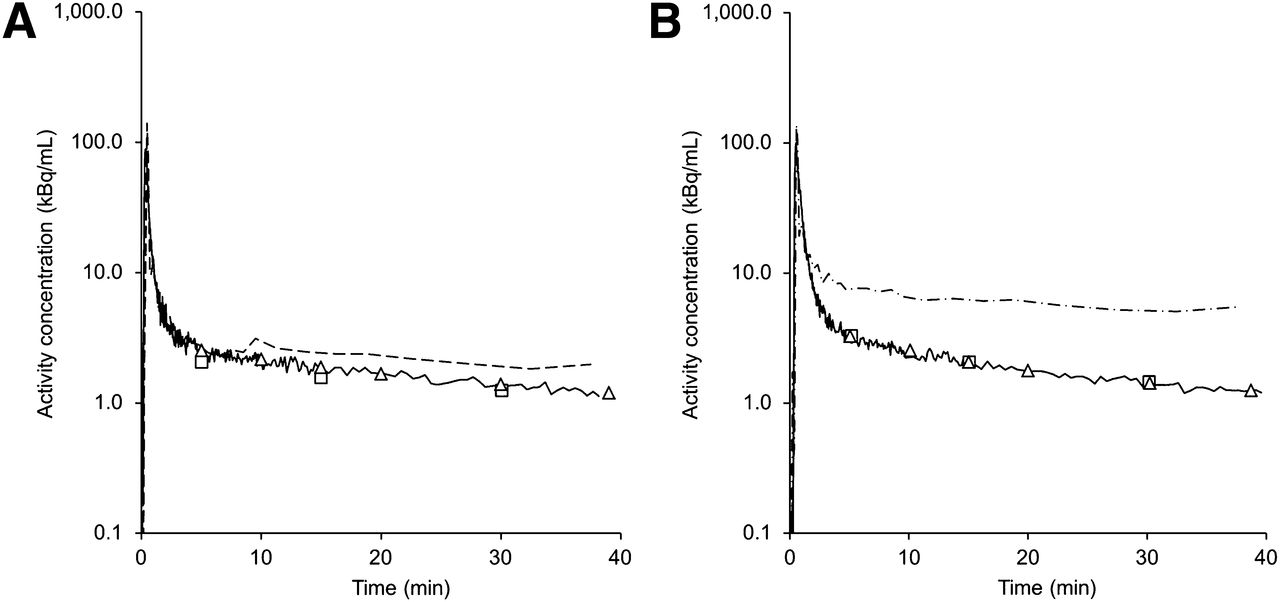
Eight patients diagnosed with PCa were included: age, 66 ± 8 y; weight, 89 ± 12 kg; height, 185 ± 7 cm; T stage ≥ 2; Gleason score, 7 (n = 2) or 9 (n = 6); and high prostate-specific antigen at the time of PET/CT imaging (113 ± 91 ng/mL). Patients were previously treated by prostatectomy (n = 4) or external-beam radiotherapy on the prostate in combination with antihormonal therapy (n = 4). Three patients were receiving therapy at the time of PET/CT imaging: luteinizing hormone-releasing hormone antagonists, oral androgen receptor inhibitor enzalutamide, and dendritic cell therapy. Figure 1 shows typical 18F-fluoromethylcholine PET/CT images. Two typical examples of acquired blood activity concentrations are shown in Figure 2.

Two typical examples of measured whole-blood time–activity curves for patient imaged over thorax region (A) and patient imaged over abdominal region (B). Lines = calibrated blood sampler data; dashed lines (image-derived) = aortic arch; dash-dot lines (image-derived) = abdominal descending aorta; triangles = manual arterial blood samples; squares = manual venous blood samples.
Validation
Model Selection
Typical tissue time–activity curves are shown in Figure 3A. Figure 3B shows the same lesion time–activity curve with associated nonlinear regression analysis fits. AIC results indicate irreversible kinetics, with 2T3k+VB producing the best fits (preferred model in 7/24 lesion time–activity curves), followed by the simpler irreversible model 2T3k (7/24) and 1T1k+VB (5/24). However, as displayed in Table 1, 2T3k+VB was less robust than 1T1k+VB whereas correspondence between respective quantification parameters was excellent (R2 = 0.96; intraclass correlation coefficient [ICC] = 0.94; Table 2) and remained so even for K1 derived from shorter scan durations (R2 > 0.92; ICC > 0.89; SE [K1]<5%; for scan durations > 20 min). It is thus conceivable that Ki can be substituted by K1 produced by the 1T1k+VB model without loss of accuracy. Therefore, in the validation analysis presented in this article, K1 produced by full kinetic modeling with 1T1k+VB for the 40-min dynamic PET scan will be used as a reference. One patient was excluded because this patient’s estimated K1 values were outside the expected physiologic range (see the “Discussion” section). For the sake of completeness, the supplemental data show the results for 2T3k+VB.
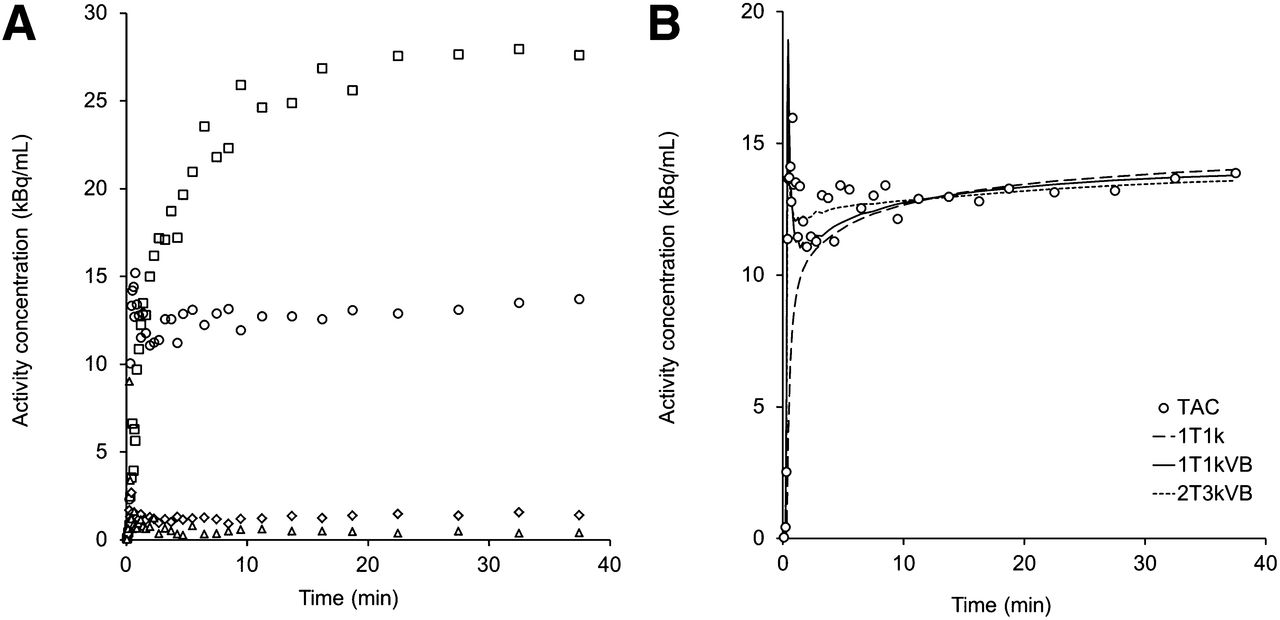
(A) Typical measured time–activity curves for patient shown in Figure 1. ◱ = liver; ○ = lesion; ♢ = muscle; △ = fat tissue. (B) Nonlinear regression fits to lesion time–activity curve displayed in A, using various compartment models.
Comparing Scan Durations
Comparing 1T1k+VB with 2T3k+VB
Alternatives to Arterial Blood Sampling
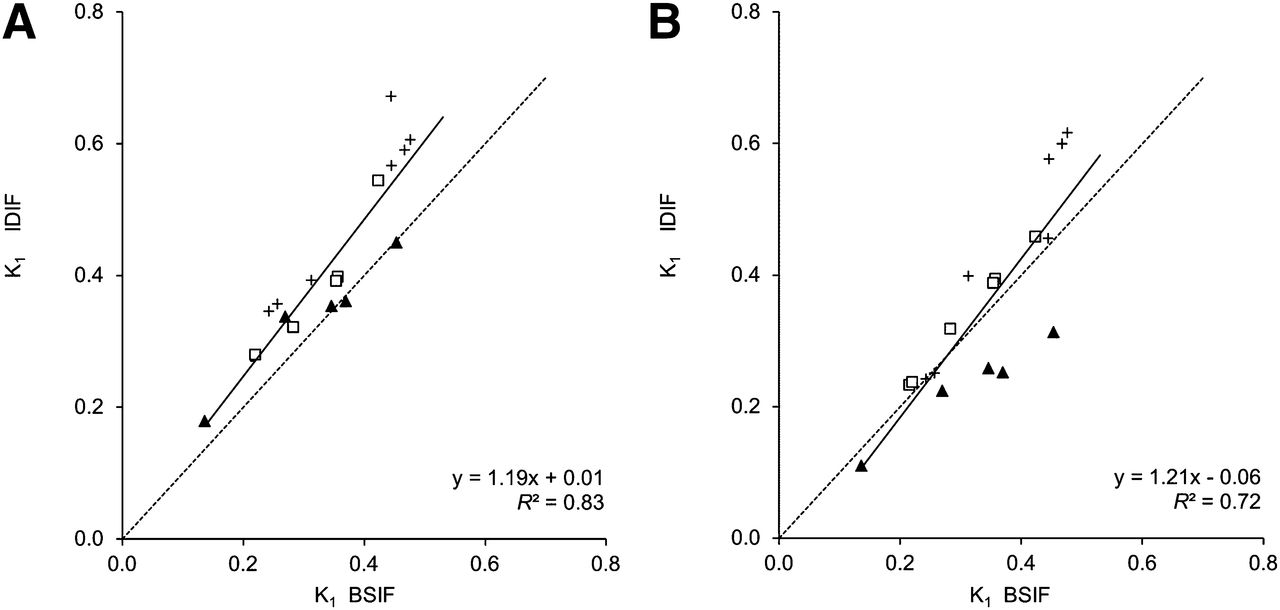
IDIFs overestimated whole-blood activity concentrations at later time points, compared with BSIFs (as illustrated in Fig. 2), most markedly when derived from VOIs located near high 18F-fluoromethylcholine uptake structures, such as the liver (Fig. 2B) or kidneys. Figure 4 shows nonlinear regression analysis results using IDIFs derived from VOIs in blood structures located away from the liver or kidneys only, compared with those using BSIFs. To minimize calibration errors due to possible overestimation at late time points, calibration of IDIF was performed using data obtained at approximately 500–1,500s after injection. For 1 patient, imaged over the abdominal region, no suitable IDIF could be found because marked overestimation of blood activity concentrations was observed all along the descending aorta. Good correlation was found for calibrated IDIFs (calibration factor, 0.82 ± 0.13), although a bias was observed (R2 = 0.83, slope = 1.19; ICC = 0.74). Figure 4B shows results for noncalibrated IDIFs (R2 = 0.72; ICC = 0.80). Input function correction based on venous blood samples was not equivalent to correction based on arterial blood samples. Although good correspondence was found for whole-blood activity concentrations at late time points, and for plasma-to-blood ratios (ICC = 0.89; supplemental data), parent fraction measures were substantially different (ICC = 0.61; Fig. 5).

K1 obtained using 1T1k+VB with calibrated (A) and noncalibrated (B) IDIF-derived, compared with BSIF method. Symbols indicate IDIF origin: ▲ = aortic arch; ◱ = descending aorta; + = femoral artery.
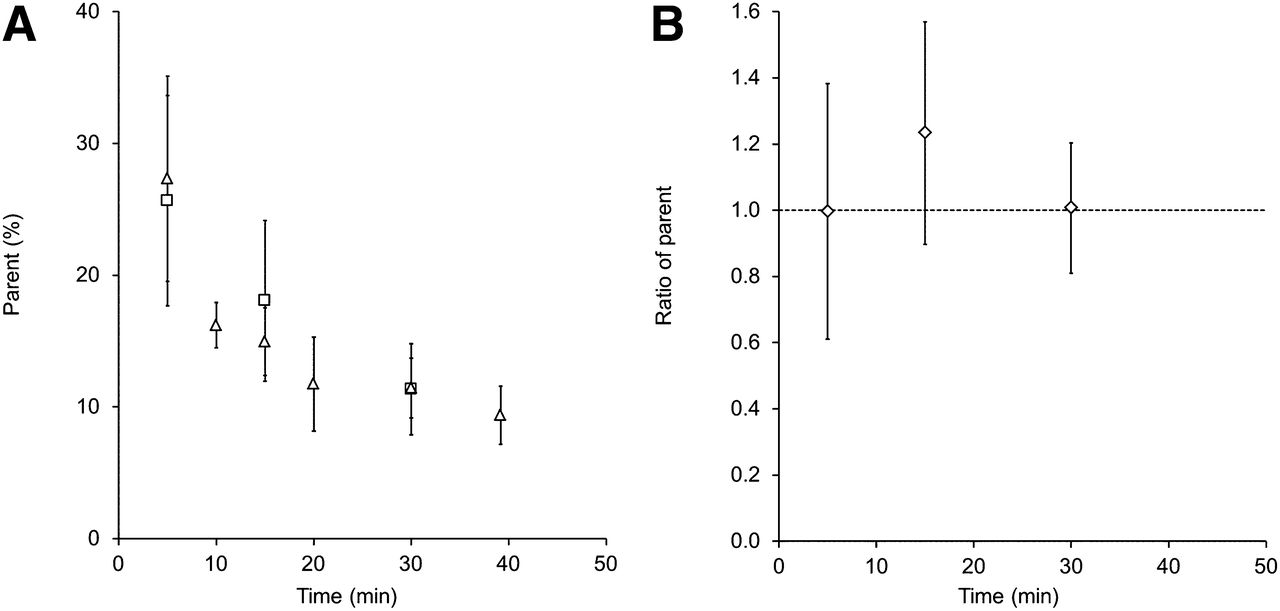
Manual blood sample data as function of time: mean parent fractions (△ = arterial, ◱ = venous) (A) and ratio of venous to arterial parent fractions (B). Error bars represent ± SD.
Simplified Methods
Correlation between SUV (35–40 min after injection) and K1 was poor (Table 3; Fig. 6A), with R2 less than 0.34, irrespective of the normalization factor used. LMr (35–40 min after injection; Fig. 6B) and LBr (35–40 min after injection) performed somewhat better (R2 = 0.50 and 0.44, respectively).
Comparison of Simplified Parameters to K1 Resulting from Full Kinetic Modeling with 1T1k+VB
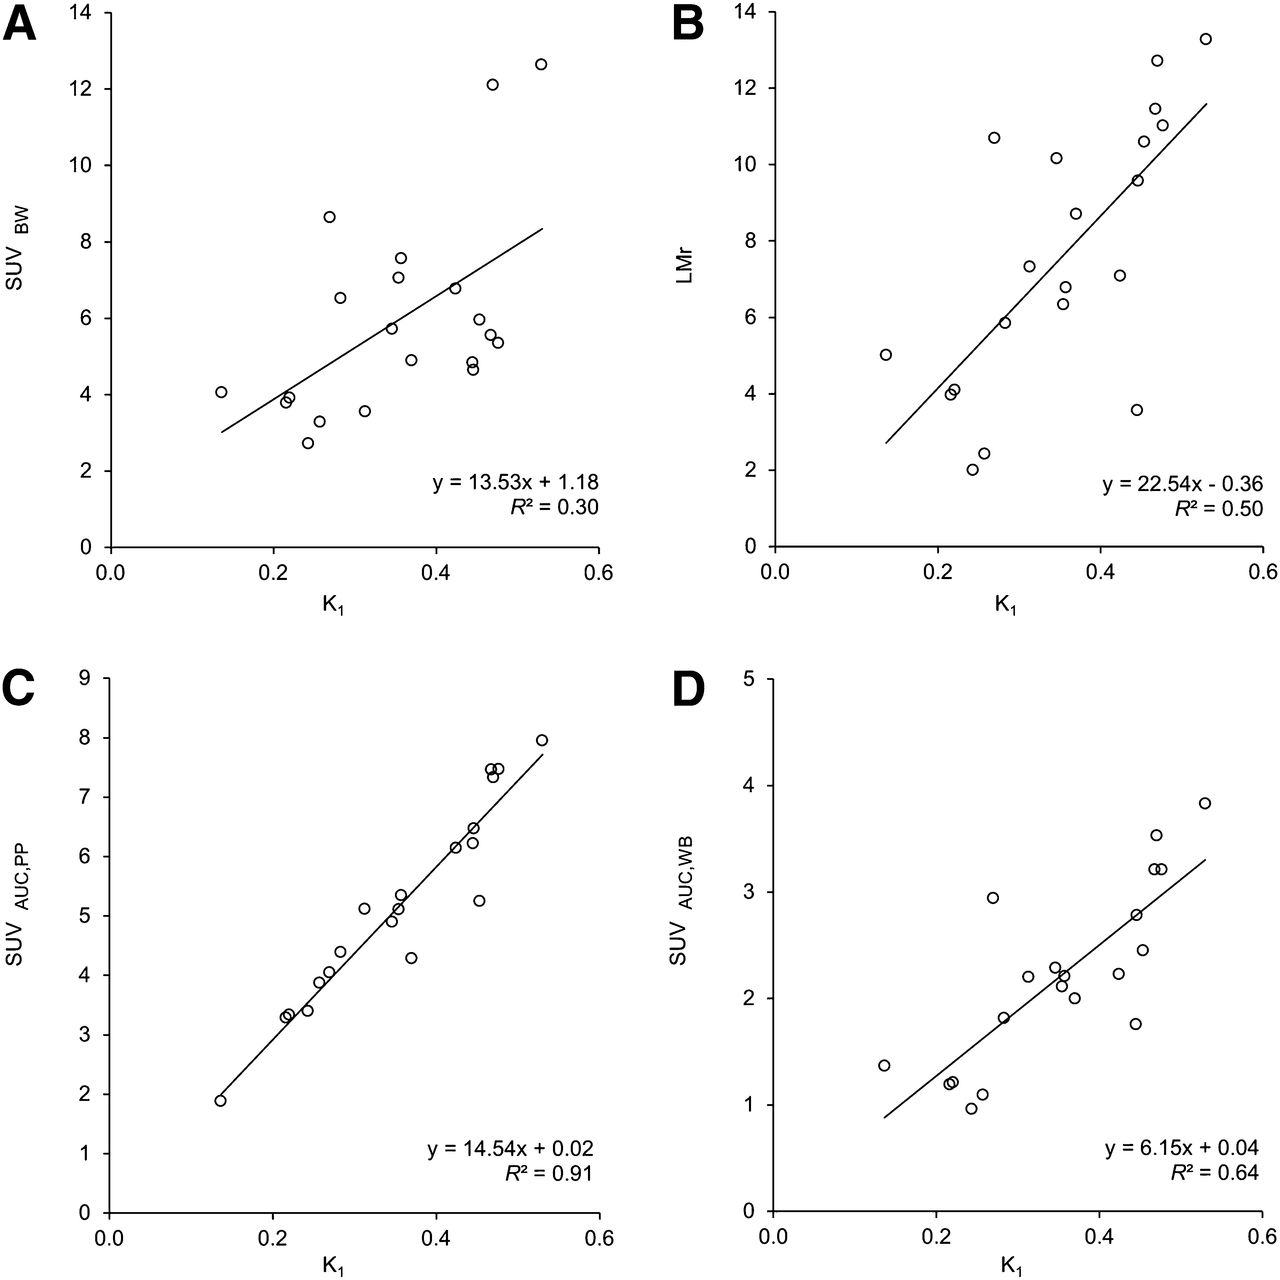
Correlation between simplified uptake measures and K1 (1T1k+VB). (A) SUV normalized to body weight (SUVBW), (B) LMr and lesion activity concentration in kBq at 30–40 min after injection divided by AUC of parent plasma (C), and whole-blood activity concentration (D) in MBq over 0–30 min (SUVAUC,PP and SUVAUC,WB, respectively).
In contrast, SUVAUC,PP, calculated by dividing lesion activity concentrations (35–40 min after injection) by cumulative delivery, that is, the area under curve (AUC) of the parent plasma input function (0–40 min after injection), provided an excellent correlation to K1 (R2 = 0.92). This correlation reduced to an R2 of 0.65 when using whole-blood AUC rather than parent plasma AUC (SUVAUC,WB). SUVAUC calculated from lesion activity concentrations at 30–40 min after injection and AUC over 0–30 min after injection resulted in similar correlations: an R2 of 0.91 for SUVAUC,PP (Fig. 6C) and 0.64 for SUVAUC,WB (Fig. 6D), respectively. Good correspondence was found between SUVAUC derived from BSIF and SUVAUC derived from IDIF (calibrated, R2 = 0.98, ICC = 0.93; noncalibrated, R2 = 0.86, ICC = 0.91).
DISCUSSION
This study focused on pharmacokinetic analysis of 18F-fluoromethylcholine in PCa metastases and investigated the validity of strategies to simplify acquisition and analysis, to enable quantification of 18F-fluoromethylcholine uptake in a routine clinical setting.
On the basis of AIC alone, 18F-fluoromethylcholine kinetics in PCa lymph node metastases could best be described using a 2T3k+VB model. However, the fitting procedure proved nonrobust, particularly for shorter scan durations (as shown in Table 1). We hypothesized that this was caused by the rapid uptake in combination with the limited efflux to the blood pool (k2). This renders the model unable to accurately distinguish K1 and k3, which also explains why 1T1k+VB yielded similar results (R2 = 0.96; ICC = 0.94). This indicates that, even though AIC selected 2T3k+VB, 1T1k+VB can be used without loss of quantification accuracy. Moreover, 1T1k+VB results were more robust and consistent for shorter scan durations, indicating this to be the most suitable model.
An additional issue arising from the fast kinetics observed for 18F-fluoromethylcholine is the inability of either model to accurately distinguish between the first tissue compartment (influx K1 and efflux k2) and signal originating from blood volume in the VOI. High VB areas were therefore excluded.
One patient was excluded because K1 estimates were found to be unrealistically high (K1 > 1) using either irreversible model. We hypothesized that this might be the result of high lesion blood volume fraction; despite our efforts to exclude large blood volume structures, as described previously, lesion VB estimates were 0.49 ± 0.05 for this patient. As rapid lesion uptake occurred, delayed arrival of blood activity concentrations in blood-pool structures may have rendered them visually indistinguishable from lesion tissue. Another explanation may be markedly different kinetics in this patient, leading to inaccurate estimates caused using the wrong model. We were unable to verify or reject either hypothesis based on the available data. Interestingly, all lesions were located within the mediastinum. In the rest of the study population, 3 of 4 mediastinal lesions also showed increased VB estimates (0.23 ± 0.11, compared with 0.08 ± 0.05 for all other lesions studied). Also of interest is that this particular patient had received an experimental type of therapy (dendritic cell therapy; up to 1 mo before the PET/CT scan). Because many patients eligible for 18F-fluoromethylcholine PET will receive some form of therapy, the possible influence of drugs on 18F-fluoromethylcholine kinetics should be investigated. For example, it has been suggested that androgen-deprivation therapy, a pharmaceutical used to maintain the biochemical castration level in recurrent PCa, causes decreased choline uptake in hormone-sensitive PCa in various studies (24). In the present study, 1 patient was on androgen-deprivation therapy during the scan. Nevertheless, results were consistent with the rest of the study population, indicating negligible influence on 18F-fluoromethylcholine uptake for this patient.
Having determined the kinetic model and relevant quantification parameter, the possibilities for simplifying the acquisition protocol and analysis methods were investigated—that is, alternatives for deriving plasma input functions as well as the validity of using simplified methods for quantification.
For several blood VOI locations, overestimation of blood activity concentrations was observed (for this reason 1 patient could not be analyzed with IDIF). We hypothesized that the apparent increase in image-derived blood activity concentrations near high 18F-fluoromethylcholine uptake structures was caused by incorrect scatter correction in these areas, possibly leading to large quantification errors with IDIFs derived from blood VOIs in these areas. For other blood VOIs, however, good correspondence was found for results with IDIF and BSIF (R2 = 0.83 and ICC = 0.74 for calibrated IDIF). The observed 19% bias was mainly caused by results for IDIF originating from small (femoral) arteries (Fig. 4), indicating that these may not be suitable for deriving IDIF. In summary, IDIF derived from large blood-pool structures located away from high-uptake structures, such as the aortic arch, can substitute continuous arterial blood sampling. Unfortunately, manual arterial blood samples and specialized laboratory analysis remain necessary as parent fractions are greatly reduced shortly after injection, and variability between patients is high (12% ± 4% at 20 min after injection; Fig. 5). Parent fractions measured from venous blood showed low correspondence to those obtained from arterial blood samples.
High metabolite formation rates may also complicate quantification when radiolabeled metabolites enter tissue. The main metabolite is betaine, an organic osmolyte (10). Because the presence of 18F-betaine will not be specific to lesions and LMrs as high as 7.84 ± 3.15 were observed (Fig. 6B), it is unlikely that radiolabeled betaine significantly affected observed lesion activity concentrations.
A major simplification of the imaging protocol would be to use simplified methods instead of full kinetic modeling. Simplified methods, such as SUV, however, do not take into account possible influences on quantification by, for example, VB and metabolite formation. Therefore, results obtained using simplified methods were compared with those obtained with full kinetic modeling. Commonly used simplified methods showed poor correlation to results from full kinetic modeling (SUV, R2 < 0.34; LMr, R2 = 0.50; LBr, R2 = 0.44). We hypothesized that as 18F-fluoromethylcholine kinetics are rapid and irreversible, even late-time lesion activity concentrations will depend heavily on the AUC of the plasma input function, a characteristic not accounted for in commonly used simplified methods. SUVAUC performs better because it incorporates information from the input function itself (R2 = 0.92 for SUVAUC,PP and 0.65 for SUVAUC,WB).
In a routine clinical setting, static imaging would be preferable. Whole-blood AUC can be image-derived directly from a static PET image acquired over 0–40 min after injection (R2 = 0.98), from a VOI within the aortic arch defined using the low-dose CT. However, simultaneous imaging of both the lesions and the aortic arch will be impossible in most patients, as the typical metastatic pattern of PCa usually involves the pelvic or abdominal region. Therefore, SUVAUC was also validated when obtained from 2 consecutive time intervals: AUC over 0–30 min after injection and lesion activity concentrations averaged over 30–40 min after injection (R2 = 0.91 for metabolite-corrected plasma data and 0.64 for whole-blood data). As lesion activity concentrations appear stable from 10 min onward, the latter can also be obtained with a whole-body PET scan. To obtain SUVAUC,PP, arterial blood sampling and analysis would be required. With the proposed static imaging protocol, VOIs cannot be adjusted to exclude high-VB areas because for this purpose an early PET image over the lesion would be required. Apart from aforementioned modeling issues, high VB causes underestimation in simplified parameters. We therefore recommend caution when evaluating lesions near arterial structures until the clinical impact of these potential errors has been fully investigated.
Characteristics such as metabolism, perfusion, and blood volume fraction are likely to change over the course of therapy. Therefore, the performance of the parameters presented in this article should be verified in test–retest and longitudinal trials, before they can be validated or disqualified for application in a clinical (response-monitoring) setting. Should 18F-fluoromethylcholine metabolism remain constant throughout the response-monitoring study, the performance of SUVAUC,WB, and to a lesser extent SUV, may be equivalent to SUVAUC,PP as a relative measure of response. Challapalli et al. recently reported on a novel 18F-labeled choline tracer that metabolizes less rapidly than 18F-fluoromethylcholine, with parent fractions gradually decreasing to approximately 0.3 over the first hour after injection (25,26). With decreased interpatient variability in parent fractions, the performance of SUV and SUVAUC,WB may improve with respect to SUVAUC,PP.
CONCLUSION
18F-fluoromethylcholine uptake should be quantified using full kinetic modeling with 1T1k+VB and metabolite-corrected plasma input function based on arterial blood sampling.
Results indicate that SUV cannot be used to estimate 18F-fluoromethylcholine uptake. A clinically feasible alternative could be SUVAUC,WB based on 2 consecutive static PET scans. Further studies are needed to substantiate these findings.
DISCLOSURE
The costs of publication of this article were defrayed in part by the payment of page charges. Therefore, and solely to indicate this fact, this article is hereby marked “advertisement” in accordance with 18 USC section 1734. No potential conflict of interest relevant to this article was reported.
Acknowledgments
We thank our colleagues at the Department of Radiology and Nuclear Medicine involved in tracer production and data acquisition for this study. We are also grateful to urologists from VUmc (Dr. André N. Vis), Amstelland Hospital Amstelveen (Drs. Cobi Reisman and Joop W. Noordzij), and Medical Center Alkmaar (Dr. Ton A. Roeleveld) and oncologists from VUmc (Drs. Jens Voortman, Marije M. Vleugel, Liselot Wertenbroek, and Maurice J.D.L.van der Vorst) for their contribution to patient selection and inclusion.
Footnotes
↵* Contributed equally to this work.
Published online Feb. 12, 2015.
- © 2015 by the Society of Nuclear Medicine and Molecular Imaging, Inc.
REFERENCES
- Received for publication August 30, 2014.
- Accepted for publication January 5, 2015.


Jump to section
Related Articles
Cited By...
- Simplified Methods for Quantification of 18F-DCFPyL Uptake in Patients with Prostate Cancer
- [18F]Fluorocholine and [18F]Fluoroacetate PET as Imaging Biomarkers to Assess Phosphatidylcholine and Mitochondrial Metabolism in Preclinical Models of TSC and LAM
- 11C-Choline Pharmacokinetics in Recurrent Prostate Cancer
- Repeatability of Quantitative 18F-Fluoromethylcholine PET/CT Studies in Prostate Cancer
- Reply: Simplified Methods for Quantification of 18F-Fluoromethylcholine Uptake: Is SUVAUC,PP Actually an SUV?
- Simplified Methods for Quantification of 18F-Fluoromethylcholine Uptake: Is SUVAUC,PP Actually an SUV?