


Abstract
PET/CT imaging allows for image-based estimates of organ and red marrow (RM) residence times. The aim of this study was to derive PET/CT-based radiation dosimetry for 89Zr-cetuximab, with special emphasis on determining RM-absorbed dose. Methods: Seven patients with colorectal cancer received 36.9 ± 0.8 MBq of 89Zr-cetuximab within 2 h after administration of a therapeutic dose of 500 mg·m−2 of cetuximab. Whole-body PET/CT scans and blood samples were obtained at 1, 24, 48, 94, and 144 h after injection. RM activity concentrations were calculated from manual delineation of the lumbar vertebrae and blood samples, assuming a fixed RM–to–plasma activity concentration ratio (RMPR) of 0.19. The cumulated activity was calculated as the area under the curve of the organ time–activity data (liver, lungs, kidneys, spleen, and RM), assuming physical decay after the last scan. The residence time for each organ was derived by dividing the cumulated activity with the total injected activity. The residence time in the remainder of the body was calculated as the maximum possible residence time minus the sum of residence time of source organs, assuming no excretion during the time course of the scans. The (self and total) RM- and organ-absorbed doses and effective whole-body radiation dose were obtained using dose conversion factors from OLINDA/EXM 1.1. Several simplified 3-time-point dosimetry approaches were also evaluated. Results: The first approach yielded self and total RM doses of 0.17 ± 0.04 and 0.51 ± 0.06 mGy·MBq−1, respectively. The second approach deviated by −21% in self-dose and −6% in total dose. RMPR increased over time in 5 of 7 patients. The highest 89Zr-absorbed dose was observed in the liver with 2.60 ± 0.78 mGy·MBq−1, followed by the kidneys, spleen, and lungs, whereas the effective whole-body dose was 0.61 ± 0.09 mSv·MBq−1. The simplified 3-time-point (1, 48, and 144 h) dosimetry approach deviated by at most 4% in both organ-absorbed doses and effective dose. Conclusion: Although the total RM dose estimates obtained with the 2 approaches differed only by at most 6%, the image-based approach is preferred because it accounts for nonconstant RMPR. The number of successive scans can be reduced to 3 without affecting effective dose estimates.
PET using long-lived radionuclides has proven to be a valuable tool for predicting the biodistribution of labeled monoclonal antibodies (mAbs) (1,2) and organ dosimetry for radioimmunotherapy (2). In addition, the dose-limiting tissue can be determined, enabling dose escalation and optimization of therapeutic treatment planning. In particular, a recent study showed that the biodistributions of 89Zr-Df-cetuximab and 88Y-DOTA-cetuximab (88Y as a substitute for 90Y) were comparable for all organs (1). Another study from the same group demonstrated nearly identical biodistributions of 89Zr-ibritumomab and 90Y-ibritumomab (2). Recently, the effect of radioimmunotherapy using 90Y-cetuximab (combined with external-beam irradiation) on local tumor control in vivo was examined in 3 human squamous cell carcinoma models (3). The latter study showed that PET imaging using 86Y-cetuximab may be used to assess epidermal growth factor receptor expression, which in turn could be a potential predictor for response to combined radioimmunotherapy and external-beam radiotherapy.
With radioimmunotherapy, bone marrow can be the dose-limiting organ. Conventionally, the red marrow (RM) activity concentration is assumed to be 19% of the plasma activity concentration (4). Assuming a hematocrit value of 0.44, the red marrow (RM)–to–blood ratio (RMBLR) will be assigned a value of 0.34. However, recent studies by Schwartz et al. (5) and Hindorf et al. (6) have reported a time-dependent RM-to-plasma ratio (RMPR) based on PET imaging using 124I-cG250 and 124I-huA33 and scintigraphic imaging using 131I-labeled anti-CD22 mAb, respectively. This increase in RMPR may reflect binding to Fc receptor–expressing cells in bone marrow. Those observations imply that RM dose estimates based on blood or plasma activity concentrations may be inappropriate, at least for some mAbs. Schwartz et al. (5) reported that the plasma-based approach can produce discrepancies of as much as −74 to +62% in individual patients for self RM dose (after 124I-labeled mAb administration), as compared with PET/CT image–based dosimetry. It has also been reported that 124I-labeled mAbs tend to release free radionuclides on antibody internalization, resulting in rapid clearance of the radionuclides from the target tissue, leading to reduced tumor contrast (7) and a change in RMPR over time. Unlike 124I, 89Zr appears to be a residualizing radiometal potentially circumventing these problems (7). However, increased radioactivity in bone, as reported in recent studies (8,9) using 89Zr as a PET tracer, has not been analyzed adequately yet to assess whether or not in vivo metal release or other mechanisms are involved. Again, a consequence could be that the assumption of a constant RMPR is wrong.
The novelty of this study lies in the exploration of the added potential of performing a PET/CT-derived biodistribution/dosimetry study in humans for a mAb labeled with a positron emitter. The advantage of the associated (low-dose) CT scan is more robust organ delineation. In addition, use of a CT-defined volume of interest (VOI) of the lumbar vertebrae (LV) may allow for noninvasive quantification of RM activity concentrations. The aim of this study was to assess biodistribution and radiation dosimetry of 89Zr-cetuximab in humans, with a special emphasis on a comparison of image- and plasma-based RM dose–estimation approaches.
MATERIALS AND METHODS
Imaging Protocol
Seven patients (4 men, 3 women) with histopathologically confirmed advanced kRas wild-type colorectal cancer (Table 1) received 36.9 ± 0.8 MBq of 89Zr-cetuximab within 2 h after administration of the first therapeutic dose of 500 mg·m−2 of cetuximab. PET/CT scans (Gemini TF-64; Philips Healthcare) and blood samples were obtained at 1, 24, 48, 94, and 144 h after injection (10). PET data were normalized; corrected for decay, randoms, dead time, scatter, and attenuation; and reconstructed using a time-of-flight list-mode ordered-subsets expectation maximization reconstruction method with a matrix size of 144 × 144 and a voxel size of 4 × 4 × 4 mm3. In addition, for each time point, a 50-mA low-dose CT scan was acquired for attenuation-correction purposes. Corresponding CT images were reconstructed with an image matrix size of 512 × 512 and a voxel size of 1.17 × 1.17 × 5 mm3. For the present analysis, all 5 CT scans for each patient were rebinned into a 4 × 4 × 4 mm3 voxel size to map CT VOIs onto the PET images. The study was approved by the Medical Ethics Committee of the VU University Medical Center, and all patients signed a written informed consent form before the inclusion.
Patient Details
Organ Dosimetry
The activity for each organ that was visible in all PET scans (liver, lungs, kidneys, spleen, and RM) was determined using the mean activity concentration in VOIs with in-house–developed software. VOIs were independently drawn on all 5 CT scans for each patient and subsequently mapped onto the respective PET scans. Total organ activities were derived using standard organ masses as reported by Stabin et al. (11). The cumulated activity was calculated as the area under the curve of the organ time–activity data approximated by the trapezoidal rule and assuming only physical decay after the last measurement. Next, the residence time was derived by dividing the cumulated activity by the total injected activity. The residence time in the remainder of the body was calculated as the maximum residence time (based on physical decay only) minus the sum of residence time of source organs (an organ was designated as source organ when uptake was visible), assuming no excretion during the time course of the scans. Although the effective total residence time could also be derived from a whole-body VOI (on average 35% lower values), this approach was not followed to obtain conservative estimates of the effective dose. Individual residence times were scaled with the mass ratio of the patient to reference man/woman before being used as input in OLINDA/EXM 1.1. This software was used for the calculation of organ-absorbed doses and effective dose (11). To derive a simplified dosimetry protocol with 3 time points, all possible combinations were tested for the ability to estimate organ-absorbed doses and effective doses as accurately as possible.
RM Dose-Estimation Methods
Blood-Based Method
Conventionally, the blood-based approach assumes that plasma activity concentration is equal to the extracellular fluid activity concentration in the marrow space and, therefore, that RMPR is constant, equal to the fraction of RM composed of extracellular fluid (RMECFF) (4). In this method, a fixed, time-independent RMPR value of 0.19 is used. In Table 2, a parameter overview can be found. Plasma samples were counted in a Wallac 1470 well counter (Perkin Elmer Lifescience), and conversion of the derived counts per minute to disintegration per minute was done (a description of the methodology of cross calibration between the PET scanner and the well counter can be found in Greuter et al. (12)). The total cumulated activity concentration in the RM is given by: Eq. 1or alternatively the cumulated activity can be written as:
 Eq. 2The RM mass can be approximated through the standard adult and patient-specific whole-body mass:
 Eq. 3
Eq. 3 Eq. 4where
  ,
,  , and
, and  correspond to the standard adult mass for RM (men, 1.12 kg; women, 1.30 kg), whole body (men, 73.7 kg; women, 58.0 kg) (11), and the patient-specific whole-body mass, respectively (Table 2). The total RM-absorbed dose can be divided into 2 contributions, the self RM dose—which represents the dose from the marrow spaces—and the cross RM dose—which represents the dose from the remaining tissues of the body (13,14). This dose can be expressed by the following equations:
 Eq. 5
Eq. 5 Eq. 6The full expressions of self-dose and cross-dose contribution to the RM can be obtained by substituting Equations 2, 3, and 4 into Equation 6. By introducing a mass scaling for the S factors in Equation 6, the
  terms cancel out and a patient mass–independent term remains, whereas the final cross RM dose term will be patient mass–dependent. Calculations and full expression of the formulas can be found in the supplemental materials (available at http://jnm.snmjournals.org).
Parameter Overview
Manual VOI Delineation Method
In immuno-PET studies, a second approach to determine  is by delineating VOIs in each of the 5 (L1–L5) segments of the LV on CT slices (Fig. 1). Each VOI had a spheric shape with a volume of 6 mL, providing a total volume of 30 mL for all 5 segments. Subsequently, all 5 VOIs were transferred to the PET images, and the mean activity concentration was calculated. The effect of using smaller or larger volumes in estimating mean activity concentration was also investigated. The LV consists of compact bone, trabecular bone, and marrow space elements—that is, red and yellow marrow, extracellular fluid, and vasculature. Assuming that there is no specific binding of the radiolabeled antibody cetuximab to trabecular bone, it follows that the trabecular bone activity concentration should be zero. Thus, a correction factor was applied for the presence of trabecular bone in the LV segments. To this end, the RM activity concentration was scaled on the basis of the volume of the LV composed of trabecular bone (ftb; men, 0.135; women, 0.148) (15), thus a multiplicative correction factor (1/(1 − ftb)) was applied. This approach does not assume a constant RMPR over time as it is an image-derived method. Equation 4 was adjusted by replacing
  with
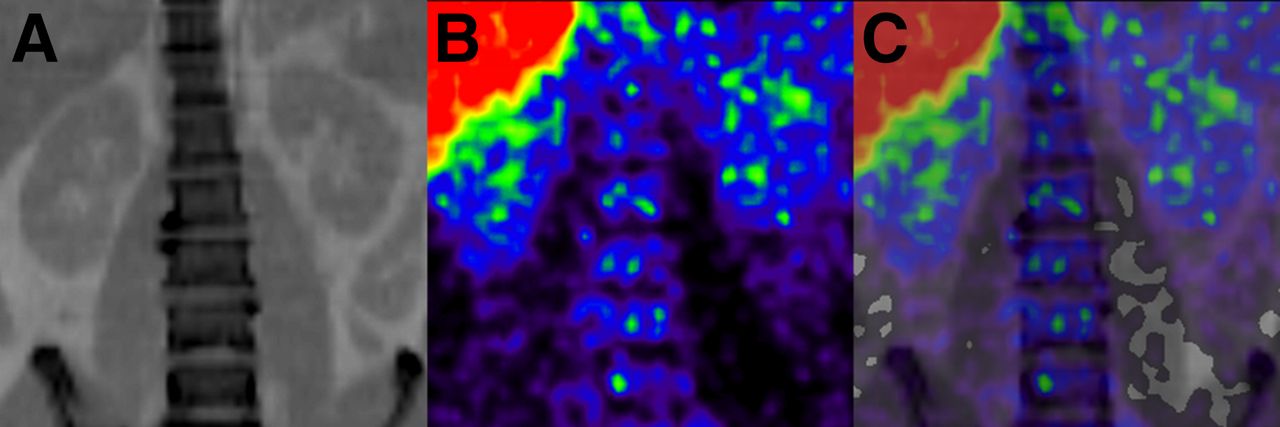
with  , as the RM activity concentration was directly obtained from the PET images. Visual inspection of the PET images did not show higher uptake in the compact bone component when compared with the marrow space elements of the LV (Fig. 2).
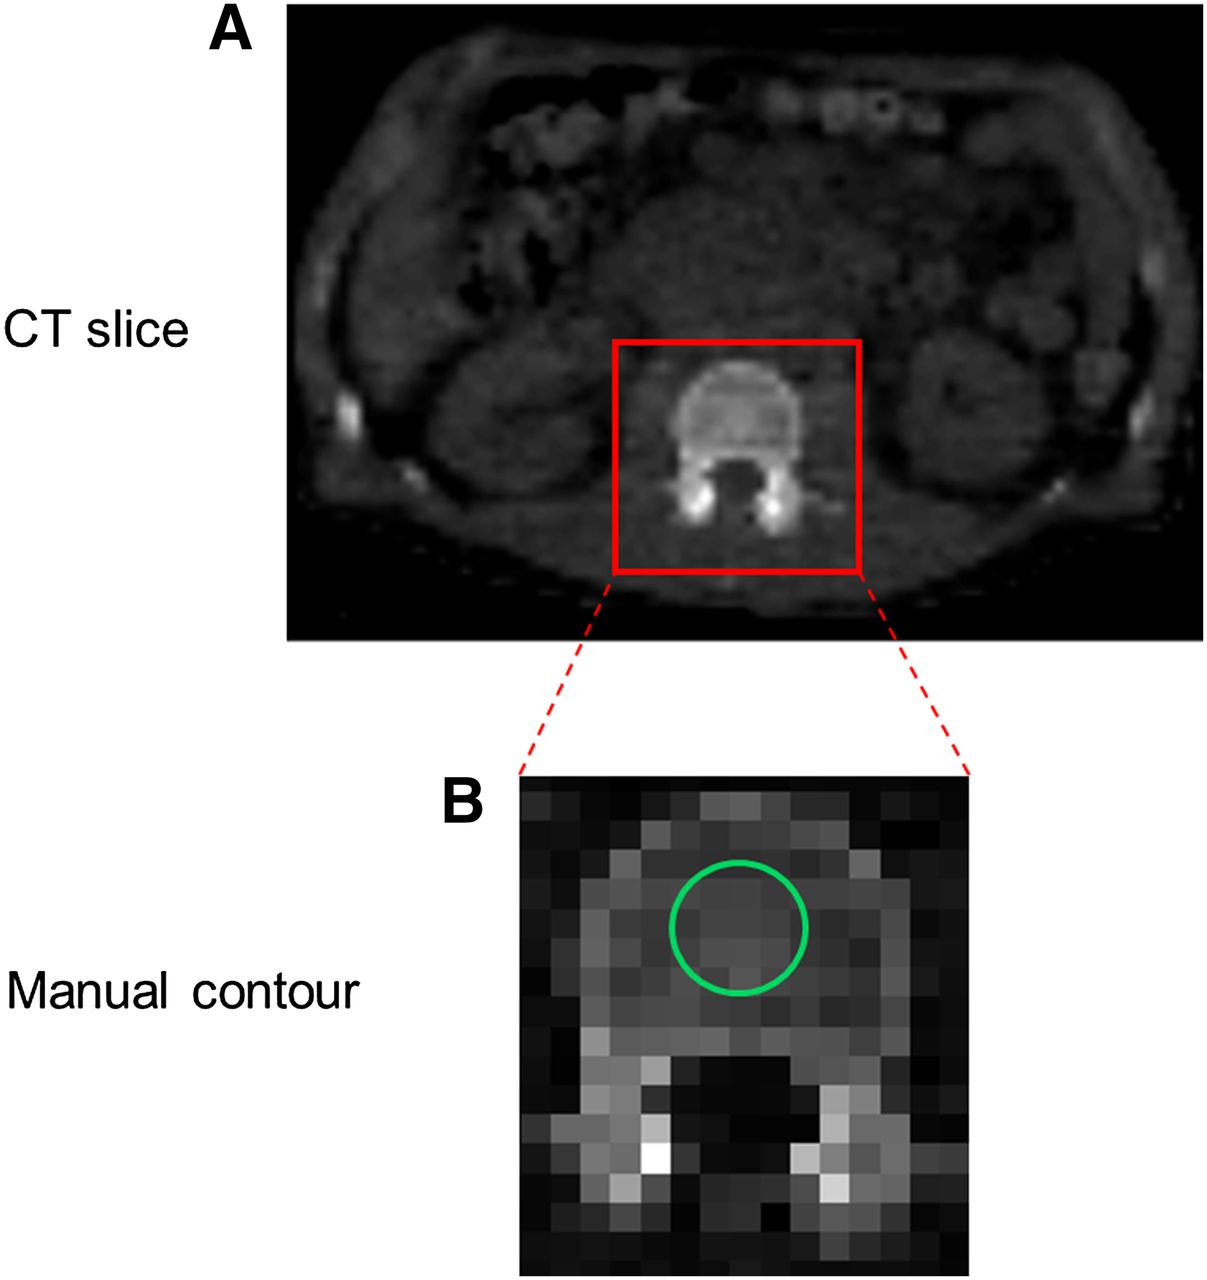
Original CT slice (A) and axial CT slice (B) with manually defined LV contour (green line) enclosing intraosseous volume.

Typical example of coronal slices of CT (A), PET (B), and PET/CT (C).
RESULTS
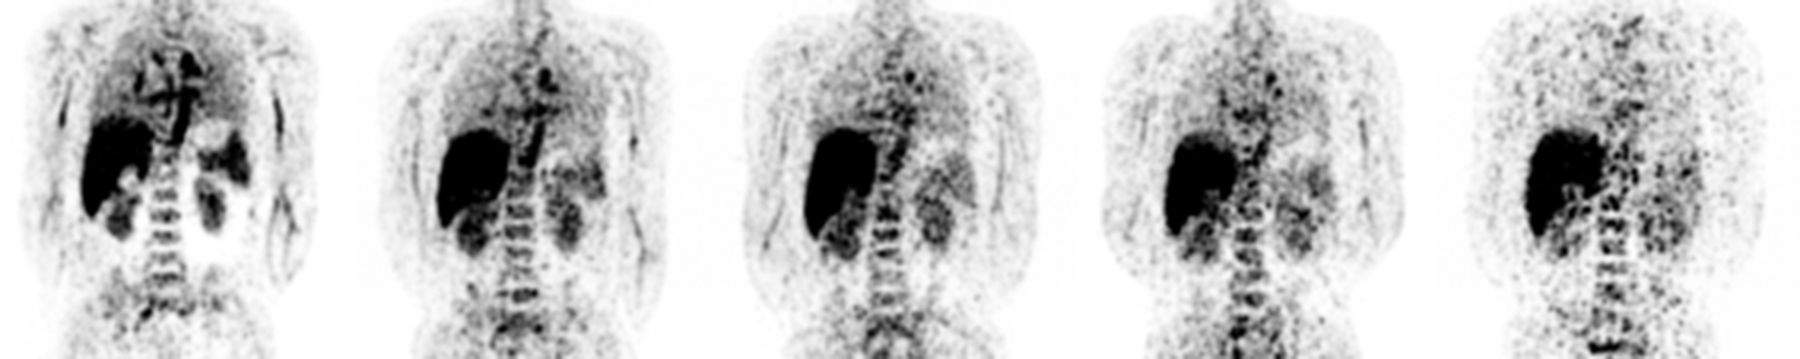
Figure 3 shows RMPR as a function of time for patients injected with 89Zr-cetuximab. RMPR at the time of the first scan (1 h) was 0.13 ± 0.03 (range, 0.09–0.16), whereas for the last scans (144 h) an increased RMPR of 0.49 ± 0.29 (range, 0.22–0.99) was observed. While varying the volumes used in the bone marrow of the LV, we obtained bone marrow activity concentration that deviated, at most 7%, when compared with ACRM obtained from 30-mL bone marrow volumes. Typical coronal slices of 89Zr-cetuximab images during the time course of 7 d can be seen in Figure 4.

Image-derived RMPR as function of imaging time after injection of 89Zr-cetuximab. Five of 7 patients depict increasing RMPR as function of time, and only in 2 patients RMPR corresponds with nominal value of 0.19 (dotted line).

Biodistribution of 89Zr-cetuximab as visualized using PET during course of 7 d (left to right: 1, 24, 48, 72, and 144 h after injection).
The self RM dose estimate as calculated for the plasma-based approach was 0.13 ± 0.05 mGy·MBq−1 (range, 0.08–0.24, Fig. 5). The LV-based self RM dose estimate was 0.17 ± 0.04 mGy·MBq−1 (range, 0.11–0.22 mGy·MBq−1). The total RM dose estimate for the plasma- and LV-based approaches was 0.48 ± 0.08 mGy·MBq−1 (range, 0.41–0.65 mGy·MBq−1) and 0.51 ± 0.06 mGy·MBq−1 (range, 0.44–0.63 mGy·MBq−1), respectively (Table 3). The contribution of cumulated activity before the first and after the last scan as compared with the total RM cumulated activity was 16% ± 2% and 27% ± 4% for plasma- and LV-based methods, respectively. In addition, across all patients, the self RM dose percentage contribution to the total RM dose varied from 18% to 35%, whereas the whole-body–to–blood cumulated activity ratio varied from 3.4 to 1.8.

RM dose estimates based on plasma and LV approach for self- and total dose in 89Zr PET/CT studies. For radionuclides with little or no long-range photon emission, such as 90Y or 177Lu, only self-dose component of overall RM dose should be considered. Relative change in self RM dose between LV-based and plasma-based approaches was 21% (whereas in total RM dose this difference was diluted due to cross-dose contribution, and therefore, the average relative change in total dose was only 6%).
RM-Absorbed Dose
The organ average uptake for liver, lungs, kidneys, spleen, and RM is shown in Figure 6. The highest average absorbed dose was observed in the liver with 2.60 ± 0.78 mGy·MBq−1, followed by the kidneys (1.04 ± 0.24 mGy·MBq−1), spleen (0.89 ± 0.22 mGy·MBq−1), lungs (0.66 ± 0.17 mGy·MBq−1), and RM (0.51 ± 0.06 mGy·MBq−1). The effective dose was calculated to be 0.61 ± 0.09 mSv·MBq−1. All possible 3-time-point combinations were tested in estimating organ-absorbed doses and effective doses. The 1 h–48 h–144 h and the 48 h–72 h–144 h protocols showed the smallest (<4%) and the largest (∼20%) discrepancies, respectively, when compared with the 5-time-point dosimetry protocol (Table 4). Table 5 shows organ effective half-lives of 89Zr-cetuximab for 1- to 72-h and 72- to 144-h time intervals. The whole-body effective half-life was 70 ± 6 h for the whole imaging range.
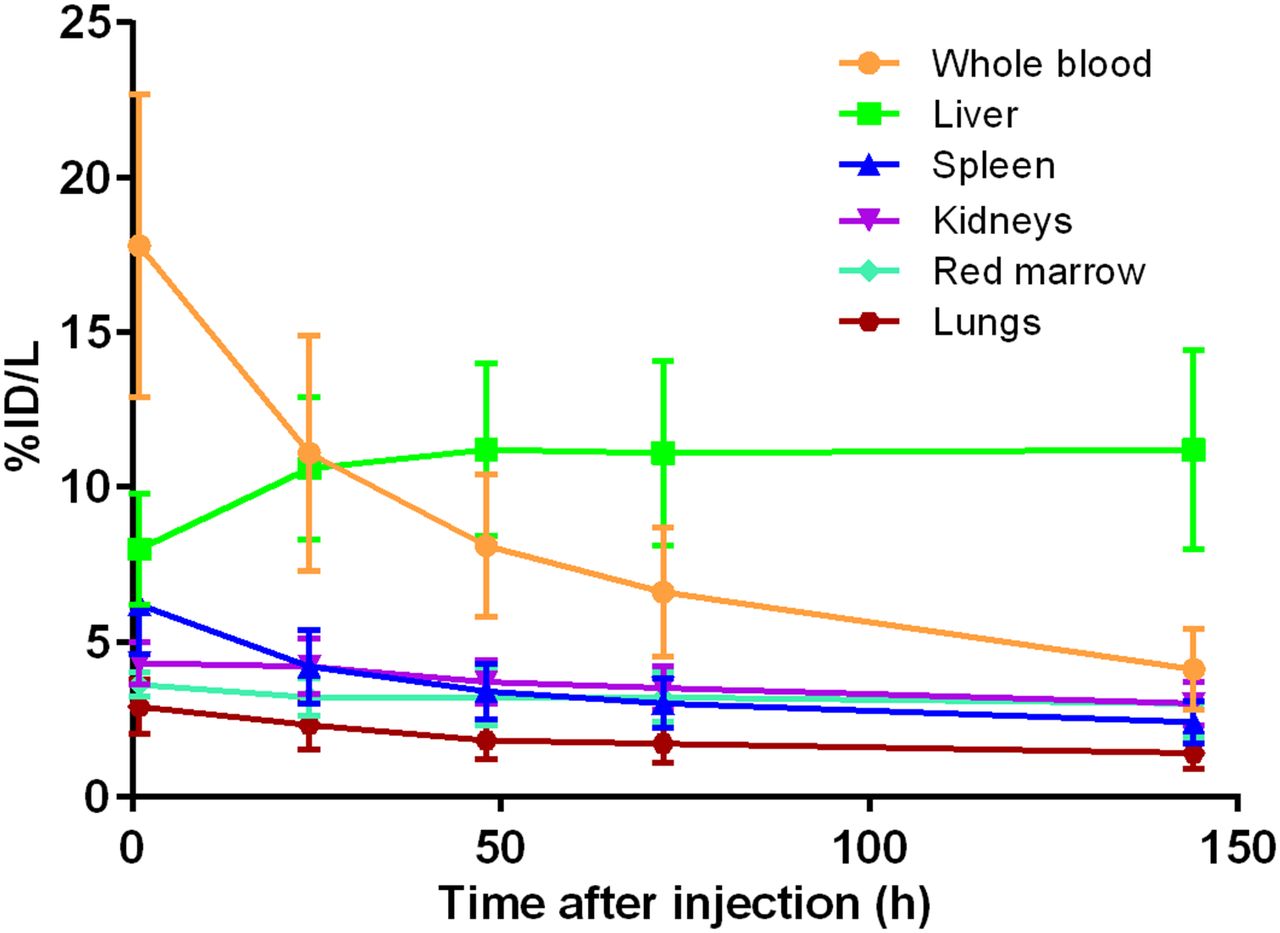
Average %ID per liter as function of time after injection (with decay correction) for all visible organs. Error bars correspond to SD as calculated for 7 patients.
Organ-Absorbed Doses
Effective Half-Life (h)
DISCUSSION
This study assessed PET/CT-based biodistribution and dosimetry of 89Zr-cetuximab for all organs with positive PET uptake. In addition, an image-based approach for estimating the RM-absorbed dose in 89Zr PET/CT studies was compared with the conventional plasma-based approach.
While 18F-FDG is a metabolic tracer that targets tumors in a nonspecific manner, radiolabeled mAbs target a specific tumor cell surface marker. That said, immuno-PET can give insight on tumor targeting and on the amount of the mAb accumulated in the tumor, offering the opportunity to select those patients who will benefit from mAb-based therapy and allowing treatment planning to be tailored to the needs of each patient. More information on the potential added value of immuno-PET in the clinical setting is presented by Wu (16).
The present study showed a nonconstant RMPR over time for 89Zr-cetuximab. Hindorf et al. (6) have shown an increasing RMBLR for up to 6 d after the administration of 131I-labeled anti-CD22 mAb in patients. Similar findings were reported by Schwartz et al. (5), who found an increasing RMPR with time after radiolabeled antibody administration for patients injected with 124I-cG250 and 124I-huA33. Perk et al. (1) demonstrated approximately 2.5 times higher accumulation of N-sucDf-89Zr conjugates in bone over time (5.85 ± 1.05 percentage injected dose [%ID]·g−1) than of the radioimmunotherapy conjugates in tumor-bearing nude mice studies at 72 h after injection. This higher accumulation is in agreement with a study by Chang et al. (17), who demonstrated an elevated bone uptake of 5.70 ± 3.00 %ID·g−1 at 120 h after injection. In contrast, the present findings showed a constant RM uptake over time, which could be due to catabolism of cetuximab in the liver. Then the associated 89Zr-containing metabolites reenter the bloodstream and they redistribute in the bone marrow. Therefore, the increasing RMPR could be explained, at least in part, by the relative rapid washout of 89Zr-cetuximab from the bloodstream in combination with the constant RM uptake. No foci of high activity were detected in bone sites.
The contribution of extrapolations in the cumulated activity before the first and after the last scan was below 20% as recommended by the dosimetry guidelines of the European Association of Nuclear Medicine (18). In addition, the small interpatient variation of the extrapolations (data not shown) implies that the uncertainty due to extrapolations is comparable between patients. Although the whole-body–to–blood cumulated activity ratio decreased, the self RM dose percentage contribution to the total RM dose increased, thus making any variations in parameters related to self RM dose, such as hematocrit and RMECFF, more important.
The estimation of self RM dose as determined with the LV-based approach yielded, on average, 21% higher values than those obtained with the plasma-based approach. These higher values are due to the constant RMPR (0.19) used in the plasma-based approach. The present findings suggest an increasing RMPR, thus making the latter approach inappropriate. In other words, the relative faster washout of 89Zr-cetuximab from the plasma component, compared with the constant uptake in the RM, suggests that the plasma-based approach may not provide for an accurate estimation of RM-absorbed doses. The total RM doses based on plasma and LV approaches were within 6% of each other. However, for therapeutic analogs with no or little emissions of long-range photons (depending on their energy and half-life) only the self RM dose term is relevant.
The absorbed-dose estimates in the present study are in line (within 20% for all organs except the liver) with previous 89Zr-labeled studies. Rizvi et al. (2) reported that, for 89Zr-ibritumomab tiuxetan, the liver was the organ with the highest absorbed dose (1.36 ± 0.58 mGy·MBq−1), followed by the spleen (1.04 ± 0.16 mGy·MBq−1), kidneys (0.75 ± 0.06 mGy·MBq−1), lungs (0.63 ± 0.11 mGy·MBq−1), and RM (0.46 ± 0.05 mGy·MBq−1), whereas the effective dose was found to be 0.55 ± 0.07 mSv·MBq−1. Borjesson et al. (19) in a radiation dosimetry study of 89Zr-cmAb U36 found the highest absorbed dose for the liver (1.30 ± 0.34 mSv·MBq−1), followed by the kidneys (1.00 ± 0.30 mSv·MBq−1), lungs (0.79 ± 0.26 mSv·MBq−1), and spleen (0.72 ± 0.18 mSv·MBq−1). The effective dose was estimated to be 0.60 ± 0.04 mSv·MBq−1. However, a direct comparison of organ-absorbed dose estimates between 89Zr-labeled cetuximab and other 89Zr-labeled mAbs should be interpreted with care, because metabolism in the liver and specific targeting of each mAb may vary. 89Zr-cetuximab is used only for diagnostic purposes, and therefore the effective dose was presented. But in the setting of radioimmunotherapy, the dose on a tumor or the RM should be presented as absorbed dose as well. Because no tumor data are discussed in this article, only RM-absorbed dose data have been reported.
With regards to effective half-lives, only 1 immuno-PET study reports on 89Zr effective half-lives and more specifically in whole-body biologic clearance (20). This was found to be 219 h on average, and it can be translated to 58 h on the whole-body effective half-life. This figure is somewhat comparable to the 70 h seen in the current study. We split the image data points into 2 time intervals to gain insight of organ kinetics over time. With regards to the simplified 3-time-point dosimetry protocol, the first time point (1 h) is of importance, because the use of it will lead to more accurate absorbed-dose estimations than when the 24 h scan is used. In addition, 89Zr-labeled mAbs exhibit slow kinetics; thus, targeting of specific organs or tumors will occur in late time points, making the 144-h time point essential in a simplified protocol. The present study suggests that a simplified 3-time-point dosimetry approach may be used for organ-absorbed dose estimation as an alternative to the reference approach, because it yielded similar results (within ∼4%). This simplified approach will reduce the total scanning time, avoiding unnecessary discomfort and additional radiation burden (due to additional low-dose CT scans) to the patient and without compromising accuracy in dose estimation.
There are technical factors that may hamper accurate quantification of RM activity concentration and thus absorbed-dose estimation. From a technical point of view, partial-volume effect might have resulted in underestimation of RM activity concentrations. On the basis of 89Zr phantom studies (21), the activity concentration of a 2.5-cm sphere surrounded by a homogeneous background can be underestimated by as much as 20%. Nevertheless, the present observation of a nonconstant (increasing) BM-to-background ratio as function of time indicates that partial-volume corrections based on a fixed factor taken from phantom studies (with a sphere-to-background ratio of 10) would provide misleading results. Schwartz et al. (5) used recovery coefficients for partial-volume correction derived from phantom studies. Unfortunately, there was no report on how the BM-to-background ratio behaved over time, because a nonconstant ratio would require a time-varying partial-volume correction. Notably, the current study showed small deviations in ACRM while varying the VOIs, indicating a minimal impact of the partial-volume effect. In addition, the 6-mL VOIs were used on the LV segments such that a distance of at least 1 cm (∼2 × scanner spatial resolution) from the outer LV bone was ensured. In any case, even if partial-volume corrections were applied, it would only increase the dissociation of RM dose estimation between image- and plasma-based approaches.
CONCLUSION
Total RM dose estimates derived from plasma- and image-based approaches are equal within 6%. For dosimetry purposes in immuno-PET this would be acceptable. Nevertheless, an image-based approach, using manual delineation of the LV, is preferred for determining RM dose estimates, because it accounts for a nonconstant RMPR. The liver showed the highest absorbed dose among all organs, and the effective dose was 0.61 ± 0.09 mSv·MBq−1. A simplified approach using 3 time points appears to be feasible, reducing logistical costs and scanning time required.
DISCLOSURE
The costs of publication of this article were defrayed in part by the payment of page charges. Therefore, and solely to indicate this fact, this article is hereby marked “advertisement” in accordance with 18 USC section 1734. The study was financially supported in part by Philips Healthcare. No other potential conflict of interest relevant to this article was reported.
Footnotes
Published online Jan. 22, 2015.
- © 2015 by the Society of Nuclear Medicine and Molecular Imaging, Inc.
REFERENCES
- Received for publication August 30, 2014.
- Accepted for publication December 15, 2014.


Jump to section
Related Articles
Cited By...
- A general approach to reduce off-target radioactivity in vivo via Tetrazine-Knock-Out (TKO)
- Click-to-Release: Cleavable Radioimmunoimaging with 89Zr-DFO-Trans-Cyclooctene-Trastuzumab Increases Tumor-to-Blood Ratio
- Pharmacokinetics, Biodistribution, and Radiation Dosimetry for 89Zr-Trastuzumab in Patients with Esophagogastric Cancer
- Recombinant Human Thyroid-Stimulating Hormone Versus Thyroid Hormone Withdrawal in 124I PET/CT-Based Dosimetry for 131I Therapy of Metastatic Differentiated Thyroid Cancer
- ImmunoPET with Anti-Mesothelin Antibody in Patients with Pancreatic and Ovarian Cancer before Anti-Mesothelin Antibody-Drug Conjugate Treatment
- PET Imaging in Head and Neck Cancer Patients to Monitor Treatment Response: A Future Role for EGFR-Targeted Imaging