


Abstract
We present a combined PET/7 T MR imaging and 16.4 T microscopic MR imaging dual-modality imaging approach enabling quantification of the amyloid load at high sensitivity and high resolution, and of regional cerebral blood flow (rCBF) in the brain of transgenic APP23 mice. Moreover, we demonstrate a novel, voxel-based correlative data analysis method for in-depth evaluation of amyloid PET and rCBF data. Methods: We injected 11C-Pittsburgh compound B (PIB) intravenously in transgenic and control APP23 mice and performed dynamic PET measurements. rCBF data were recorded with a flow-sensitive alternating inversion recovery approach at 7 T. Subsequently, the animals were sacrificed and their brains harvested for ex vivo microscopic MR imaging at 16.4 T with a T2*-weighted gradient-echo sequence at 30-μm spatial resolution. Additionally, correlative amyloid histology was performed. The 11C-PIB PET data were quantified to nondisplaceable binding potentials (BPND) using the Logan graphical analysis; flow-sensitive alternating inversion recovery data were quantified with a simplified version of the Bloch equation. Results: Amyloid load assessed by both 11C-PIB PET and amyloid histology was highest in the frontal cortex of transgenic mice (11C-PIB BPND: 0.93 ± 0.08; amyloid histology: 15.1% ± 1.5%), followed by the temporoparietal cortex (11C-PIB BPND: 0.75 ± 0.08; amyloid histology: 13.9% ± 0.7%) and the hippocampus (11C-PIB BPND: 0.71 ± 0.09; amyloid histology: 9.2% ± 0.9%), and was lowest in the thalamus (11C-PIB BPND: 0.40 ± 0.07; amyloid histology: 6.6% ± 0.6%). However, 11C-PIB BPND and amyloid histology linearly correlated (R2 = 0.82, P < 0.05) and were significantly higher in transgenic animals (P < 0.01). Similarly, microscopic MR imaging allowed quantifying the amyloid load, in addition to the detection of substructures within single amyloid plaques correlating with amyloid deposition density and the measurement of hippocampal atrophy. Finally, we found an inverse relationship between 11C-PIB BPND and rCBF MR imaging in the voxel-based analysis that was absent in control mice (slopetg: −0.11 ± 0.03; slopeco: 0.004 ± 0.005; P = 0.014). Conclusion: Our dual-modality imaging approach using 11C-PIB PET/7 T MR imaging and 16.4 T microscopic MR imaging allowed amyloid-load quantification with high sensitivity and high resolution, the identification of substructures within single amyloid plaques, and the quantification of rCBF.
One major hallmark of Alzheimer disease (AD) is the prominent deposition of various amyloid species in brain tissue (1). Today, a range of transgenic rodent models of AD is available, most of which are models of cerebral β-amyloidosis, either lacking or with only minor additional intraneuronal deposition of neurofibrillary tangles or global neuronal loss as observed in AD patients (2–8). However, for studying the quantity or dynamics of amyloid deposition, these animal models are both appropriate and widely used for fundamental research investigations.
Further, noninvasive imaging modalities such as PET, along with specific amyloid tracers (e.g., Pittsburgh compound B [11C-PIB]) or MR imaging allow in vivo studies of the diseased rodent brain. One major reason for the use of MR imaging at a very high spatial resolution (microscopic MR imaging) in brain imaging applications in transgenic AD mouse models is the potential possibility of resolving individual amyloid plaques—possibly even without the use of contrast agents. This approach, however, lacks sensitivity and specificity, as signal voids obtained by T2- or T2*-weighted MR imaging may be related to blood vessels oriented in the orthogonal direction relative to the imaging plane or to microhemorrhages (9). T2-weighted acquisitions more precisely reflect the amyloid plaque size, whereas T2*-weighting yields an iron-sensitive contrast and possibly susceptibility artifacts. However, T2*-weighting also results in a higher contrast-to-noise-ratio and, thus, enhanced image contrast (10). Thus, the combination of T2*-weighted microscopic MR imaging with a second imaging modality providing high sensitivity and specificity appears logical. Recently, we and others have demonstrated the potential of 11C-PIB PET for selective imaging of amyloid deposits in the brain tissue of transgenic AD mice (11–13). Taken together, microscopic MR imaging and 11C-PIB PET potentially provide a powerful combination for the non-invasive quantification and characterization of amyloid deposits at a high spatial resolution and with unmatched sensitivity and specificity.
Further, since the neurophysiology is heavily affected throughout the course of AD (14,15), the in vivo assessment of functional parameters such as regional cerebral blood flow (rCBF) is needed to validate novel treatment strategies, study the pathophysiology of AD, and for differential clinical diagnosis of AD and other forms of dementia. In the past, the feasibility of arterial spin labeling (ASL) MR imaging for the non-invasive quantification of rCBF in the brain of AD mice has been demonstrated (16) and specific 11C-PIB binding has been compared with control animals using voxel-based analysis (17). However, to our knowledge, quantitative rCBF has never been compared with 11C-PIB PET on a voxelwise basis in transgenic AD mice.
Thus, our aims were to quantify the amyloid burden in the APP23 mouse brain with in vivo 11C-PIB PET and postmortem microscopic MR imaging at 16.4 T, to correlate rCBF and specific 11C-PIB binding on a voxelwise basis, and to match both approaches to amyloid histology.
MATERIALS AND METHODS
Animals
For all studies, we used female transgenic (n = 5) and littermate control (n = 5) APP23 mice aged 27.5–30 mo; 4 of the littermate control mice were already included in a previous publication (13). APP23 transgenic mice were generated as described previously (5,13). All mice were obtained from the Novartis Institutes for BioMedical Research in Basel, Switzerland, and were a kind gift of Dr. Mathias Staufenbiel.
All animals were maintained in our vivarium in isolated ventilated cages on a 12-h day and night cycle at a 22°C room temperature and 50% humidity and with free access to a standard diet and tap water. All animal experiments were performed according to the current guidelines for the care and use of research animals under the German Animal Protection Law. Animal experiments were approved by the local government (Regierungspräsidium Tübingen).
PET Measurements
All PET measurements were performed with a dedicated small-animal PET scanner (Inveon; Siemens Healthcare) with a spatial resolution in the reconstructed images of 1.4 mm (full width at half maximum) at the center of the field of view (18,19) and an axial field of view of 12.7 cm. The mice were injected intravenously on the bed with 10.2 ± 0.7 MBq 11C-PIB in 50 μL of 0.9% NaCl with a custom-made catheter (11C-PIB was synthetized according to a previously published method (20); details are provided in the Supplemental Methods; available at http://jnm.snmjournals.org). PET emission scans (60 min) were acquired with a coincidence window of 3.4 ns and an energy window of 350–650 keV. Further details are listed in the Supplemental Methods.
MR Imaging Measurements
In vivo MR imaging scans were performed using a horizontal-bore, 7 T small-animal MR tomograph with a maximum gradient strength of 290 mT/m (ClinScan; Bruker BioSpin MR imaging). T2-weighted images (referred to as tse3DT2 in the following sections) were used for PET image fusion and region-of-interest definitions using PMOD, version 3.2, image view and fusion tools (PMOD Technologies). Sequence details for all MR imaging sequences are detailed in the Supplemental Methods. rCBF measurements were conducted with single-slice pulsed ASL using a flow-sensitive alternating inversion recovery true fast imaging with steady-state precession approach (21). ASL MR imaging data were analyzed using a simplified version of the Bloch equation (Supplemental Methods) and Matlab, version R2009a (The MathWorks), with an in-house-programmed routine.
Ex vivo microscopic MR imaging scans were performed at the Centre for Advanced Imaging, Brisbane, Australia, on a vertical-bore small-animal MR scanner operating at 16.4 T (Avance II; Bruker BioSpin) using a Micro 2.5 gradient system, a 15 mm SAW volume coil, and ParaVision, version 5.1. T2*-weighted (referred to as highres-3DT2*) images at high resolution were used for MR imaging–based amyloid plaque quantification.
Data Evaluation
For the evaluation of 11C-PIB PET data, attenuation-corrected scans were analyzed with PMOD, version 3.2, image view and fusion tools. 11C-PIB time–activity curves were analyzed using the Logan graphical analysis method and the cerebellum as reference region yielding non-displaceable binding potentials (BPND) (22).
Amyloid quantification was estimated from both microscopic MR imaging and amyloid histology. As the exact spatial matching of microscopic MR imaging and histologic slides is difficult, we used a statistical approach to estimate the total amyloid burden of each region. Every third slice of the microscopic MR imaging scans, corresponding to every 12th–14th slice of the paraffin-embedded brains, was used to quantify the amyloid burden, with a total of 3 slice groups for microscopic MR imaging and amyloid histology. Further details, along with the histologic procedures and a description of the data analysis method used for the voxel-based correlation of 11C-PIB PET and ASL MR imaging, are listed in the Supplemental Methods.
Statistics
Differences in 11C-PIB BPND between transgenic and littermate control mice were compared using the Mann–Whitney U test, and P values of less than 0.05 were considered statistically significant. 11C-PIB PET and ASL MR imaging voxelwise correlation quadrant assignments are displayed as median with the respective interquartile range. Testing of homoscedasticity between comparison groups was performed using the Brown–Forsythe test and the Origin, version 8.0, Pro software package (OriginLab). It was further ensured that the data included in the analyses met all assumptions of the used statistical tests before statistical testing and data interpretation were conducted. All values are represented as the average ± SE of the mean (SEM), unless stated otherwise. All regression analyses and statistical tests were performed with the Origin, version 8.0, Pro software package and the JMP, version 10.0.2, software package (SAS Institute GmbH). No animals were excluded from the data analysis.
RESULTS
Quantification of the Amyloid Burden with 11C-PIB PET
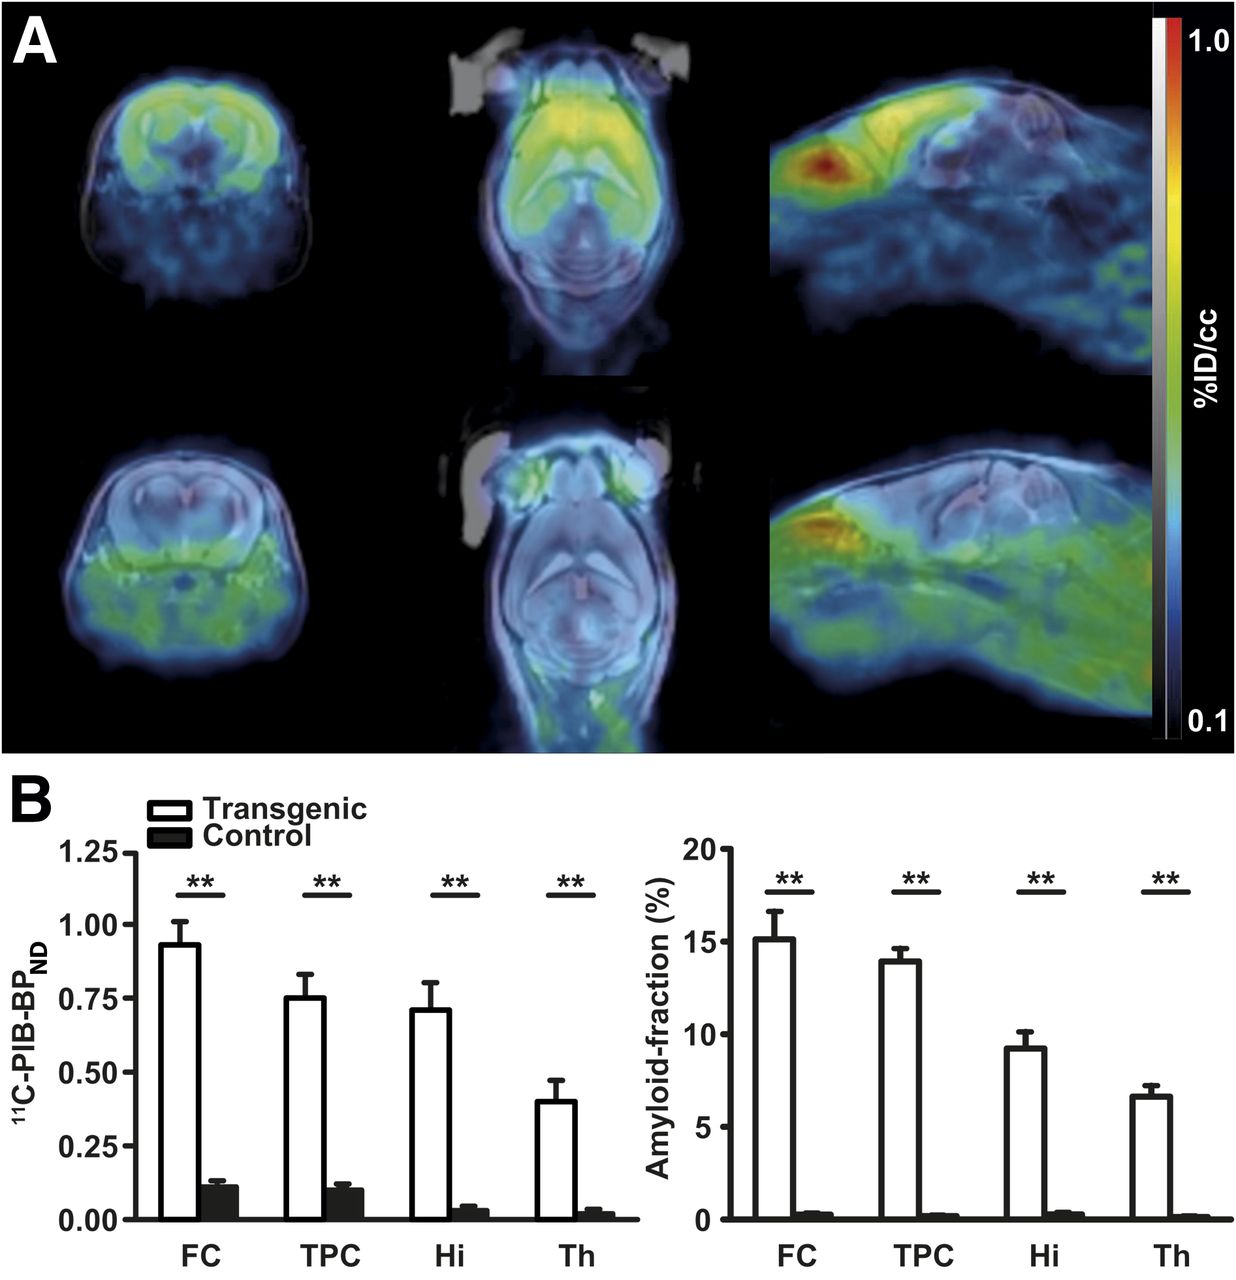
First, we analyzed specific 11C-PIB binding in transgenic and littermate control APP23 mice. Figure 1A shows an example of 11C-PIB PET/tse3DT2 MR image fusion. The highest BPND in comparison to control animals were observed in the frontal cortex of APP23 mice (transgenic: 0.93 ± 0.08; control: 0.11 ± 0.02; n = 5, P < 0.01). Comparable BPND were found in the temporoparietal cortex and the hippocampus (transgenic: 0.75 ± 0.08 in temporoparietal cortex and 0.71 ± 0.09 in hippocampus; control: 0.10 ± 0.01 in temporoparietal cortex and 0.03 ± 0.01 in hippocampus; n = 5, P < 0.01). The lowest 11C-PIB BPND were calculated for the thalamus (transgenic: 0.40 ± 0.07; control: 0.02 ± 0.01; n = 5, P < 0.01; all 11C-PIB BPND are illustrated in Fig. 1B). Further, we assessed the amyloid load histologically in the same animals after the last imaging experiment was conducted for 16.4 T MR imaging. Figure 1B shows the quantified amyloid burden (expressed as percentage of the volume of interest, covered with deposited amyloid) in the brain regions that were examined by dedicated PET and MR imaging. Again, the highest amyloid load was in the frontal cortex (transgenic: 15.1% ± 1.5%; control: 0.24% ± 0.03%; n = 5, P < 0.01), followed by the temporoparietal cortex (transgenic: 13.9% ± 0.7%; control: 0.16% ± 0.03%; n = 5, P < 0.01), the hippocampus (transgenic: 9.2% ± 0.9%; control: 0.25% ± 0.08%; n = 5, P < 0.01) and the thalamus (transgenic: 6.6% ± 0.6%; control: 0.11% ± 0.04%; n = 5, P < 0.01, 2-sided unpaired t test). 11C-PIB BPND and amyloid histology were linearly correlated (Supplemental Fig. 1); however, the comparable 11C-PIB BPND of the temporoparietal cortex and the hippocampus could not be reproduced in the amyloid histology (Fig. 1B). This is most probably attributable to partial-volume effects.

Quantification of amyloid burden with 11C-PIB PET and amyloid histology. (A) Transversal, horizontal, and sagittal views of fused 11C-PIB PET/tse3DT2 MR imaging at 7 T of 30-mo-old transgenic APP23 mouse (upper panel) and of age-matched control mouse (lower panel). Note specific 11C-PIB binding in amyloid-affected brain regions of transgenic animal (frontal cortex, hippocampus, temporoparietal cortex, thalamus) in contrast to cerebellum, which is amyloid-unaffected. (B) Quantification of 11C-PIB BPND in transgenic and control mice reveals significantly higher binding in transgenic mice (n = 5) and matches amyloid load assessed by amyloid histology (n = 5). **P < 0.01. FC = frontal cortex; TPC = temporoparietal cortex; Hi = hippocampus ; Th = thalamus.
Correlation of 11C-PIB PET, High-Resolution Gre3DT2* Microscopic MR Imaging at 16.4 T, and Amyloid Histology
After dedicated in vivo PET and MR imaging examinations, the mice were euthanized and their brains harvested and sent to our Australian collaboration partners. There, the brains were prepared for ex vivo high-resolution microscopic MR imaging at 16.4 T. Figures 2A and 2B show an example of dedicated in vivo 11C-PIB PET and MR imaging at 7 T, Figure 2C shows the corresponding ex vivo microscopic MR imaging at 16.4 T in the frontal cortex of the same animal (bregma: 0.14 mm), and Figure 2D shows the correlation of 11C-PIB BPND and the microscopic MR imaging–derived amyloid load for this transgenic mouse (R2 = 0.98). Similar to the histology, we chose to express the amyloid load as percentage of the microscopic MR imaging volume of interest that was covered with deposited amyloid.

Correlation of 11C-PIB PET and T2*-weighted microscopic MR imaging at 16.4 T. (A–C) Example of tse3DT2 MR imaging at 7 T (A), corresponding dedicated 11C-PIB PET and MR imaging overlay (B), and respective postmortem T2*-weighted imaging (C) at 16.4 T of same 30-mo-old transgenic APP23 mouse as shown in Figure 1. (D) 11C-PIB BPND and microscopic MR imaging amyloid fractions calculated from T2*-weighted imaging at 16.4 T were correlated linearly (R2 = 0.98, Pearson correlation coefficient; P = 0.99; data are shown for animal presented in A–C and refer to 11C-PIB BPND ± SE of Logan fitting routine and percentage of T2*-weighted amyloid-positive fraction of thalamus, hippocampus, temporoparietal cortex, and frontal cortex). Highres-3DT2*= T2*-weighted.
Figure 3A illustrates a microscopic MR imaging section of the same brain as shown in Figure 2C at the level of the temporoparietal cortex (bregma: −1.94 mm). The amyloid deposition pattern estimated from microscopic MR imaging (Fig. 3A) corresponds well with the respective amyloid histology (Fig. 3B) in the temporoparietal cortex, especially in the piriform cortex (Fig. 3D). The amyloid deposition in the hippocampus and the thalamus is not perfectly matched (Figs. 3A and 3B), which is most likely attributable to deviations between the 3-dimensional orientation of the sectional planes of microscopic MR imaging and amyloid histology. At a higher magnification, substructures within amyloid deposits in the T2*-weighted microscopic MR imaging and the amyloid histology can be clearly identified (Fig. 3D). The observed substructures, characterized by lower signal intensities in the T2*-weighted microscopic MR imaging, correspond to dense-cored amyloid within senile plaques (Fig. 3D; achievable contrast-to-noise ratio described in the Supplemental Results). Figure 3C provides an example of T2*-weighted microscopic MR imaging of an age-matched littermate control mouse. Areas with lower signal intensities can be clearly identified either as blood vessels in the temporoparietal cortex (parallel to the imaging plane) or as blood vessels transverse to the imaging plane (caudal to the dentate gyrus or to axon bundles such as the mammillothalamic tract or the perifornical nucleus) (arrowheads in Fig. 3C indicate the mentioned structures). However, T2* signal voids comparable to those observed in transgenic APP23 mice were located neither in the frontal cortex, the temporoparietal cortex, the hippocampus, nor the thalamus, and hence, T2*-weighted microscopic MR imaging enables a clear separation of the control from the transgenic APP23 mouse brain (Supplemental Results and Supplemental Fig. 3).
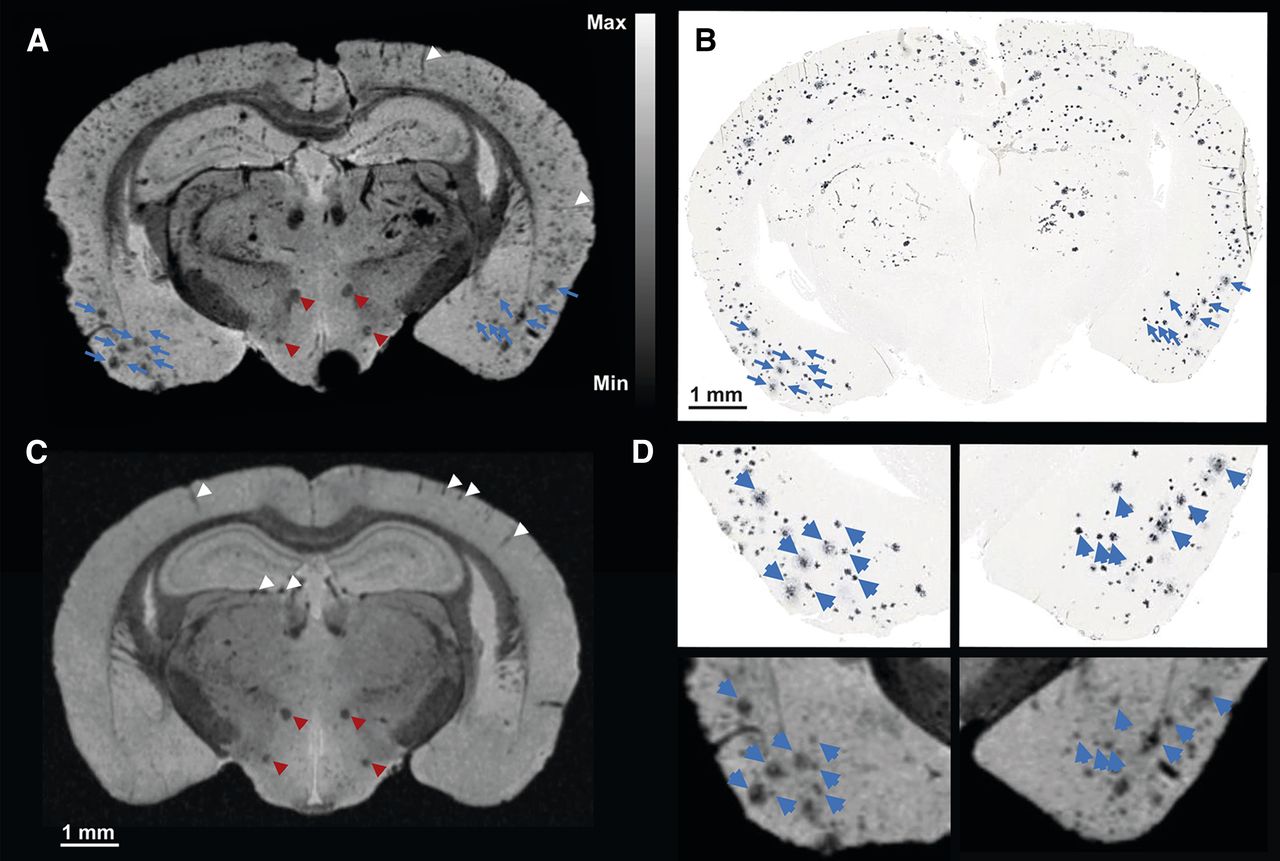
Correlation of T2*-weighted microscopic MR imaging at 16.4 T and amyloid histology. T2*-weighted image (A) at 16.4 T of 30-mo-old transgenic APP23 mouse and corresponding amyloid histology (B), with matching amyloid plaques are indicated by blue arrowheads. (C) T2*-weighted image at 16.4 T of littermate control APP23 mouse. Only rare hypointensities are present in temporoparietal cortex corresponding to blood vessels parallel to imaging plane or in hippocampus orthogonal to imaging plane (indicated by white arrowheads). Mammillothalamic tract and perifornical nucleus are indicated by red arrowheads. (D) Higher magnification of A and B allows identification of substructures within single amyloid plaques that are related to density of amyloid deposition (blue arrowheads).
Voxel-Based Correlation of 11C-PIB PET and ASL MR Imaging at 7 T
After the 11C-PIB PET acquisitions, we investigated the same animals with ASL MR imaging at 7 T to quantify physiologic alterations accompanying amyloid deposition (the 11C-PIB PET and ASL MR imaging results of 4 control mice were already included in a previous study (13); however, here we used a novel, voxel-based data analysis method). Methodologic details are provided in the Supplemental Methods and Supplemental Figure 5.
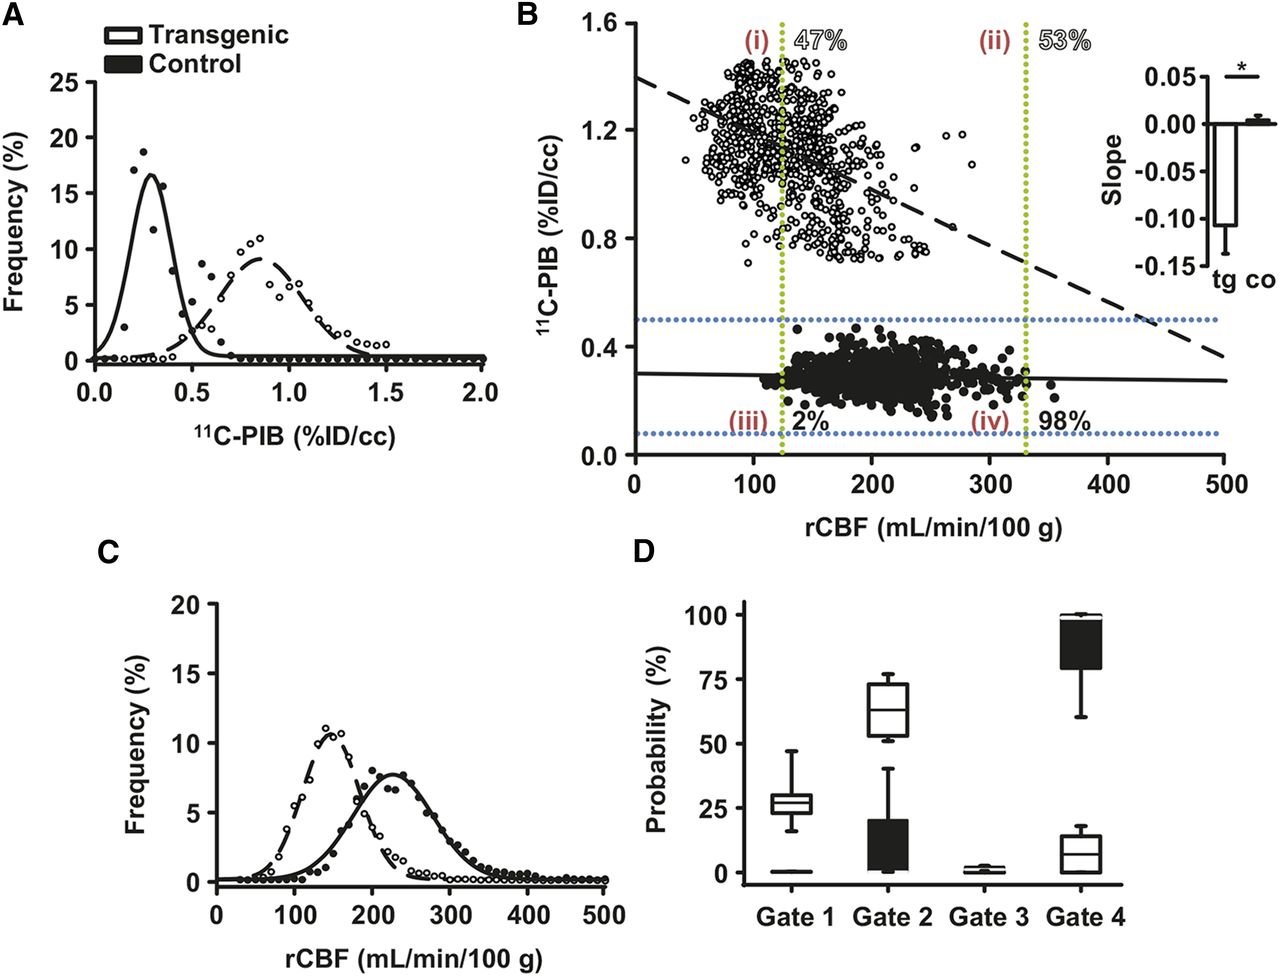
Clusters for all analyzed regions of interest are displayed for one transgenic and one control mouse in Figure 4B; the respective ASL MR imaging scans are provided in Supplemental Figure 4. We chose to introduce 2 gates in the respective 11C-PIB/rCBF scatterplots to separate 4 possible voxel populations characterized by high 11C-PIB/low rCBF (quadrant 1), high 11C-PIB/normal rCBF (quadrant 2), low 11C-PIB/low rCBF (quadrant 3), or low 11C-PIB/normal rCBF (quadrant 4) (Fig. 4B). The cutoff values for subsequent gating were chosen at a 95.45% probability population threshold directly from the gaussian distributions of the 11C-PIB PET and ASL MR imaging voxel values of littermate control mice (mean ± 2 SDs of the gaussian distribution, corresponding to 95.45% of all values; Supplemental Table 1). As expected, the majority of the 11C-PIB/rCBF voxels in transgenic APP23 mice on a group level (n = 5 mice, 3,903 voxels) were in quadrant 1 (26.9%; range, 16.3%–46.8%) and quadrant 2 (62.7%; range, 51.4%–77.0%), whereas 0.0% (range, 0.0%–0.4%) were assigned to quadrant 3 and 6.7% (range, 0.0%–18.2%) to quadrant 4 (Fig. 4D shows the quadrant distribution for 1 transgenic mouse). The results in control animals were diametrically opposed (group level, n = 5 mice, 3,901 voxels): 0.0% (range, 0.0%–0.0%) were in quadrant 1, 0.0% (range, 0.0%–40.1%) in quadrant 2, 0.6% (range, 0.0%–1.9%) in quadrant 3, and 98.5% (range, 59.8%–99.9%) in quadrant 4 (Fig. 4D shows the quadrant distribution for 1 control mouse). Further, we applied a linear fit to the voxel-based scatterplots of all animals and clearly observed an inverse correlation of 11C-PIB binding and rCBF in transgenic mice on a group level (slope: −0.107 ± 0.030, n = 5 mice, inset Fig. 4B), whereas there was no correlation in control mice on a group level (slope: 0.004 ± 0.005, n = 5 mice, inset Fig. 4B, linear fits for 2 mice in Fig. 4B). Taken together, the 2 presented analysis approaches allowed a clear separation of transgenic APP23 from littermate control mice.

Voxel-based correlation of 11C-PIB PET and ASL MR imaging at 7 T. (A and C) Frequency distribution and gaussian fits of 11C-PIB (A) and of rCBF values (C). (B) Example of 2-dimensional voxelwise correlation of 30-mo-old transgenic and littermate control APP23 mouse. Mean ± 2 SD thresholds calculated from A and C are indicated by dashed lines (blue: 11C-PIB thresholds; green: ASL thresholds). This allows assignment of 2-dimensional voxelwise datasets to 4 described gates (indicated by red numbers), gate assignments as percentage for both animals are shown in open numbers (transgenic) and solid numbers (control). (Inset: linear fits to voxelwise correlation plots revealed inverse correlation of 11C-PIB and rCBF in transgenic APP23 mice; littermate controls displayed no such correlation (n = 5, P < 0.05)). (D) Two-dimensional voxel-value probability distribution of all transgenic and control APP23 mice (shown is voxel distribution in 4 gates as percentage).
DISCUSSION
Because new amyloid-targeted treatment concepts are on the horizon, more refined PET and MR imaging protocols and data analysis methods are required for clinical differential diagnosis and to fully understand treatment effects and efficacy. The major motivation behind the use of 11C-PIB PET in both clinical and basic research settings of AD is to quantify amyloid load with high sensitivity, whereas the driving force behind the use of microscopic MR imaging is to measure amyloidosis at the spatial resolution of single amyloid plaques—ideally without the need for externally administered contrast agents. Recently, it was proven that 11C-PIB binding does not necessarily serve as a surrogate marker for disease severity in AD (8) but rather as a tool for the dichotomous division of the examined subjects. Thus, adding measurement protocols such as ASL MR imaging is crucial to understand the physiologic alterations accompanying amyloid deposition.
So far, only few reports have demonstrated the feasibility of 11C-PIB PET in fundamental research applications using small-animal models of cerebral β-amyloidosis, although this method is gathering momentum (11,12,17,23). On the other hand, other groups have shown the feasibility of using high-resolution microscopic MR imaging to detect single amyloid plaques (1,9,24–26). This approach, however, lacks sensitivity and specificity as signal voids originating from T2- or T2*-weighted MR imaging may be related to blood vessels oriented in the orthogonal direction relative to the imaging plane or to microhemorrhages. Although the combination of microscopic MR imaging with an imaging protocol providing high sensitivity and specificity appears logical, to our knowledge this has not been previously reported. We demonstrate for the first time the excellent correlation of 11C-PIB PET, T2*-weighted microscopic MR imaging, and amyloid histology.
Recent studies exclusively investigated different APPPS1 mouse models and Tg2576 mice (1,9,24–26), whereas we used the APP23 mouse model, harboring much larger parenchymal amyloid deposits that are mostly dense-cored and congophilic. This approach also enabled, for the first time, the detection of substructures within amyloid deposits—correlating with the histologic phenotypes and density of the amyloid deposition within single plaques. It has been hypothesized that the inherent contrast of parenchymal β-amyloid deposits in either T2- or T2*-weighted microscopic MR imaging is caused either by paramagnetic iron accumulation within the core of the amyloid plaque or by the dense packing of highly ordered amyloid fibrils, finally forming a congophilic dense-cored deposit. Wengenack et al. reported that the fast decay of transverse magnetization (T2*) is not solely attributed to the presence of iron within the amyloid plaques in the cortex and hippocampus in APPPS1 double transgenic mice (27). This notion was further supported by Nabuurs et al., as only fibrillar amyloid plaques rather than diffuse plaques induced significant changes in either T2 or T2* values and the loss of transverse magnetization was not necessarily correlated with the presence of iron within amyloid deposits (28). We now provide further evidence that the density of the amyloid deposition is a key factor for fast transverse magnetization decay, as T2* signal intensity is inversely correlated with amyloid deposition density within single amyloid plaques. One major advantage of microscopic MR imaging is that it is fast, efficient, and less labor-intensive than histologic examinations. In addition, microscopic MR imaging allows fully 3-dimensional volume quantification—in sharp contrast to histology. The cross correlation of microscopic MR imaging and histologic datasets remains difficult as there are always uncertainties in the coregistration that can be caused by nonisotropic deformations of the brain tissue by dehydration (24). The strength of a combined PET and MR imaging approach is the specific identification of amyloid deposits by amyloid PET, while at the same time, high-resolution microscopic MR imaging renders the identification of individual plaques feasible although it does not solve the problem of misidentification of non-APP deposits (29,30). Further details regarding the limitations and benefits of microscopic MR imaging and PET are provided in the Supplemental Discussion.
We also demonstrate that 11C-PIB binding and rCBF were inversely correlated on a voxelwise basis in 27.5- to 30-mo-old APP23 mice, whereas control animals displayed no such correlation (in accordance with previous findings by our group). Our gaussian-based gating approach for a voxel-based analysis and the separation of specific clusters could be useful in any multiparametric imaging application. The respective clusters could be back-projected onto the original imaging data to aid the identification of diseased tissue. In the future, we plan to compare the presented data with different supervised or unsupervised support vector machine learning approaches.
CONCLUSION
Microscopic MR imaging and 11C-PIB PET provide a powerful combination for the quantification of amyloid deposits at high spatial resolution and with unmatched sensitivity and specificity. The combination of amyloid-targeted imaging approaches with examinations of the accompanying physiology in the AD brain potentially aids disease staging and the evaluation of new treatment strategies, enabling morphologic and functional classification of the underlying mechanism of action.
DISCLOSURE
The costs of publication of this article were defrayed in part by the payment of page charges. Therefore, and solely to indicate this fact, this article is hereby marked “advertisement” in accordance with 18 USC section 1734. This work was funded by BMBF grant 01 Gi 0705 and DFG grant PI 771/1-1. Prof. Pichler receives grant or research support from AstraZeneca, Bayer Healthcare, Boehringer-Ingelheim, Bruker, Oncodesign, Merck, and Siemens; none of the grants are directly related to this work. Prof. Galloway receives research support from Siemens; however, it is not related to this work. No other potential conflict of interest relevant to this article was reported.
Acknowledgments
We thank Maren Harant for excellent technical assistance during in vivo experiments; Anke Stahlschmidt, Walter Ehrlichmann, and Gerald Reischl for providing 11C-PIB; Mathias Staufenbiel for kindly providing transgenic and littermate control APP23 mice; and the Queensland NMR Network and the Queensland node of the National Imaging Facility for technical support.
Footnotes
Published online Aug. 6, 2015.
- © 2015 by the Society of Nuclear Medicine and Molecular Imaging, Inc.
REFERENCES
- Received for publication April 15, 2015.
- Accepted for publication July 21, 2015.


