


Abstract
The purpose of this study was to prospectively evaluate the timing of metabolic response monitoring with 18F-FDG PET of (neoadjuvant) erlotinib treatment in patients with early-stage non–small cell lung cancer. Methods: This study was designed as an open-label phase II trial performed in 4 hospitals in The Netherlands. Patients received preoperative erlotinib (150 mg) once daily for 3 wk. Response evaluation was performed after 4–7 d and at 3 wk with 18F-FDG PET/CT scans. Tumor 18F-FDG uptake and changes were measured as standardized uptake values (SUVs). The metabolic response was classified on the basis of European Organization for Research and Treatment of Cancer criteria (>25% decrease in the maximum SUV) and was compared with histopathologic regression as observed in the resection specimen. Results: From December 2006 to November 2010, 60 patients with non–small cell lung cancer eligible for surgical resection were enrolled in this study. For 43 patients (18 men and 25 women), baseline 18F-FDG PET/CT scans as well as both monitoring scans and histopathologic response monitoring were available. A partial metabolic response on 18F-FDG PET/CT scans was observed for 10 patients (23%) after 1 wk and for 14 patients (33%) after 3 wk. Histopathologic examination revealed regression (necrosis of >50%) in 11 patients (26%). In these patients, the maximum SUV decreased by a mean of 17% within 1 wk and a mean of 31% at 3 wk. Seven patients were identified as responders within 1 wk. Conclusion: Response monitoring with 18F-FDG PET/CT within 1 wk after the start of erlotinib treatment identified approximately 64% of histopathologic responders on the basis of European Organization for Research and Treatment of Cancer criteria.
Recent advances in targeted therapy have provided novel treatment options for non–small cell lung cancer (NSCLC) (1). The epidermal growth factor receptor (EGFR) is overexpressed or may harbor activating mutations, mainly in adenocarcinoma. EGFR tyrosine kinase inhibitors (TKIs), such as erlotinib, can block the catalytic activity of this enzyme, which is involved in tumor cell proliferation, angiogenesis, invasion, and metastasis (2,3). The probability of a response to EGFR TKIs is considerably higher in patients who have tumors with EGFR mutations (4–6). However, the prediction of a response by mutation analysis only is suboptimal (7,8). It is known that some patients without apparent sensitizing EGFR mutations do benefit from erlotinib therapy (9), perhaps because of heterogeneity within tumors or the limitation of biopsy analysis not always showing relevant mutations. On the other hand, patients who do not respond to EGFR TKIs, despite the presence of activating mutations, could be spared unnecessary toxicity and costs.
Metabolic imaging of NSCLC and several other tumor types has been shown to be valuable in response assessment in the setting of targeted therapy (10–14). 18F-FDG PET/CT provides information about tumor metabolic activity, which may be useful for monitoring molecular changes associated with the treatment response (15,16). An early assessment of the tumor response with 18F-FDG PET/CT performed during therapy was recently proposed as a criterion for treatment modulation or modification (17,18). Early decision making about the effect of treatment can help avoid overtreatment or ineffective treatment, lower health care costs, reduce side effects and, ultimately, improve outcomes (17,19,20).
This phase II study was designed to evaluate the timing of metabolic response monitoring with 18F-FDG PET/CT of neoadjuvant erlotinib treatment of patients with NSCLC before surgery. Response evaluation was performed within 1 wk of the initiation of treatment and after 3 wk of treatment. In addition to evaluation of the timing of metabolic response monitoring during erlotinib treatment, another study objective was to relate the data to the histopathologic response in patients with NSCLC.
MATERIALS AND METHODS
Study Design
The study design, eligibility criteria, and treatment schedule have been described in detail elsewhere (20). In short, this study was designed as an open-label, noncomparative phase II trial performed in 4 hospitals in The Netherlands and was approved by each local independent ethics committee and institutional review board (or equivalent). All patients signed a written informed consent form before the start of the study treatment.
Patients with newly diagnosed resectable NSCLC, that is, clinical T1–T3 N0–N1, were allowed to enter the study. The primary lesion had to be measurable, that is, the longest diameter had to be greater than or equal to 1 cm as measured by a spiral CT scan. Sixty patients received 1 tablet of erlotinib (150 mg) daily during an intended course of 3 wk. Surgical resection was scheduled for the fourth week after the start of treatment.
Imaging Data
PET/CT imaging was performed with a hybrid system (GeminiTF; Philips) 60 min after 18F-FDG injection. 18F-FDG was administered in dosages of 180–240 MBq. Patients fasted for 6 h before imaging. Diabetes mellitus was regulated in advance (plasma glucose level of <10 mmol/L). The interval between 18F-FDG administration and scanning was 60 min (±10 min). Low-dose CT images (40 mAs; 5-mm slices) were acquired without intravenous contrast material.
The images generated (PET/CT, low-dose CT, and PET) were displayed with an OsiriX DICOM Viewer (Pixmeo) in a Unix-based operating system (Mac Pro; Apple) and were evaluated on the basis of 2-dimensional orthogonal reslicing. The images were evaluated by 1 nuclear physician. 18F-FDG PET/CT imaging was evaluable only when scans were acquired with the same scanner, acquisition protocol, and reconstruction software and with similar intervals from tracer injection to scanning.
A baseline 18F-FDG PET/CT scan was obtained during routine staging for all patients. The baseline 18F-FDG PET/CT scan had to be acquired within 1 mo before the start of erlotinib treatment. For early monitoring, the 18F-FDG PET/CT scan was planned for within 7 d after the initiation of erlotinib therapy. For late monitoring, the 18F-FDG PET/CT scan was planned for about 21 d after the initiation of erlotinib therapy. All metabolic data were compared with the patient’s baseline data.
Assessment of Metabolic Response
All imaging data were sent to The Netherlands Cancer Institute–Antoni van Leeuwenhoek Hospital, Amsterdam, The Netherlands, for review and analyses. 18F-FDG PET/CT scans obtained during and after treatment with erlotinib were compared with baseline 18F-FDG PET/CT scans. 18F-FDG tumor uptake was quantified as the maximum standardized uptake value (SUVmax; the maximum activity concentration of 18F-FDG divided by the injected dose and corrected for the body weight of the patient). For determination of the SUVmax, the volume of the primary tumor was searched for the maximum 18F-FDG uptake. Regions of interest were manually drawn. The metabolic response was assessed on the basis of European Organization for Research and Treatment of Cancer (EORTC) criteria for a tumor response (21). In short, progressive metabolic disease was classified as an increase in the SUVmax of more than 25%, stable metabolic disease was classified as an increase or a decrease in the SUVmax of less than 25%, and a partial metabolic response was classified as a reduction in the SUVmax of at least 25%.
Histopathologic Assessment
From formalin-fixed resection specimens, areas with macroscopically viable tumor tissue were embedded in paraffin, and serial sections were stained with hematoxylin and eosin. The samples were scored for residual vital tumor tissue and the presence of morphologic signs of therapy-induced regression, such as necrosis with foam cell reaction, giant cell reaction, cholesterol clefts, and fibrotic alterations (classification of Junker et al. (22)) For reporting in this study, a cutoff of 50% necrosis (with morphologic signs of therapy-induced regression) was used for a partial histopathologic response. When more than 90% necrosis was present in a resection specimen, tumor regression was defined as a nearly complete histopathologic response. One pathologist evaluated all of the resection specimens and was unaware of other patient data. Testing for EGFR and K-ras mutations was performed at the certified laboratory of The Netherlands Cancer Institute–Antoni van Leeuwenhoek Hospital, Amsterdam, The Netherlands, as described by van Zandwijk et al. (2).
Statistical Considerations
The association of the timing of an early 18F-FDG PET/CT scan and relative changes in the SUVmax was tested with a linear-by-linear association test. The association of relative changes in the SUVmax and a histopathologic response was tested with a linear-by-linear association test. Differences in SUVmax measurements according to EGFR mutation status were tested with a Kruskal–Wallis test. All analyses were performed with R version 2.152.
RESULTS
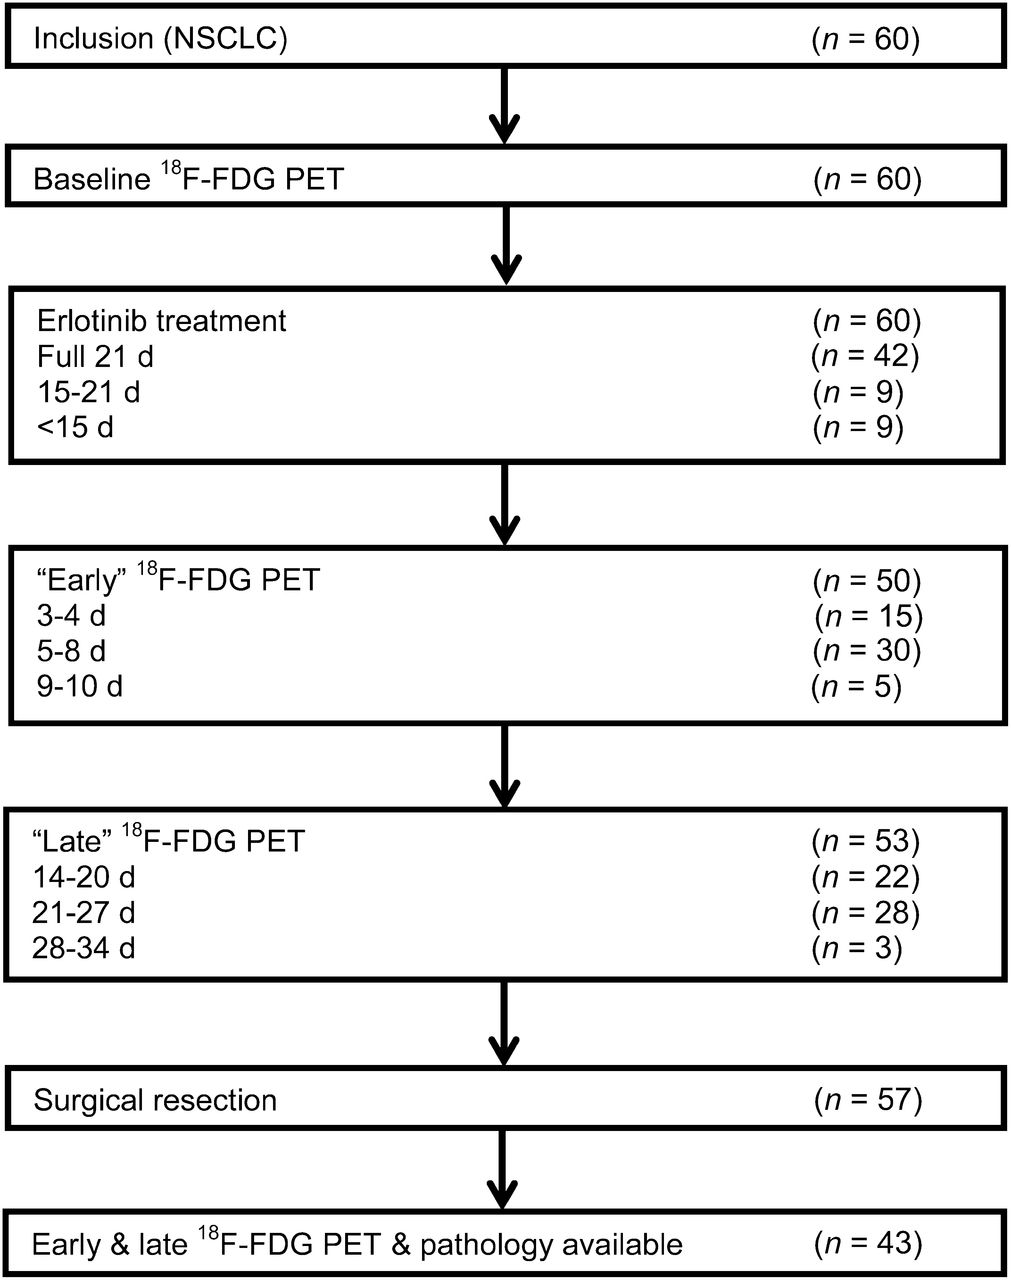
From December 2006 to November 2010, 60 patients with NSCLC eligible for surgical resection entered the study. A patient flow diagram is shown in Figure 1. For 43 patients (18 men and 25 women), both early and late 18F-FDG PET/CT scans were obtained, and histopathologic evaluation was available as well. The median age of the patients was 65 y (range, 36−76 y). Patients received a median treatment of 20 d (range, 9–27 d). General patient characteristics are shown in Table 1.

Patient flow diagram.
Characteristics of 43 Patients
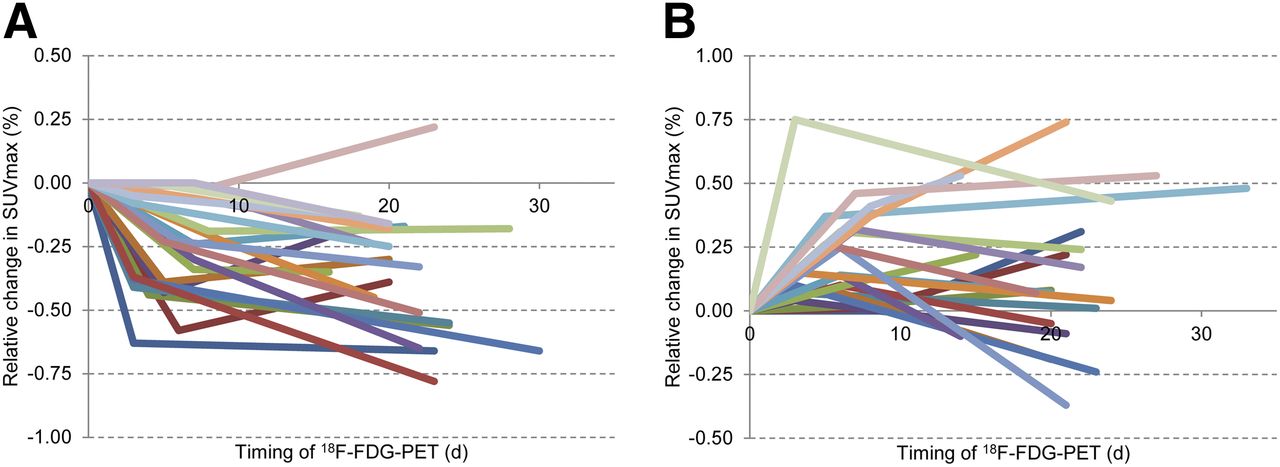
The median SUVmax at the baseline 18F-FDG PET/CT scan was 9.1 (range, 1.8–24.3). Early 18F-FDG PET/CT scans were obtained after a median treatment of 6 d (range, 2–11 d). The median SUVmax at the early scans was 8.5 (range, 0.7–24.0). Later 18F-FDG PET/CT scans were obtained after a median of 21 d (range, 14–33 d). The median SUVmax at the later scans was 8.1 (range, 0.6–22.7). The absolute SUVmax at the later 18F-FDG PET/CT scans was highly correlated with the absolute SUVmax at the early 18F-FDG PET/CT scans (0.91; P < 0.001). SUVmax data for individual patients are shown in Figure 2.

(A) Relative change in SUVmax data for individual patients with decrease in SUVmax on early scan. Baseline SUVmax (set as 0) and data from early and later scans are shown. (B) Relative change in SUVmax data for individual patients with increase in SUVmax on early scan. Baseline SUVmax (set as 0) and data from early and later scans are shown.
At the early 18F-FDG PET/CT scan (within 1 wk), 20 patients showed a relative decrease in the SUVmax ranging from 63% to 2%. No change or an increase in the SUVmax ranging from 0% to 75% was seen in 23 patients. The relative change in the SUVmax showed no significant correlation with the timing of the early 18F-FDG PET/CT scan (P = 0.78). At later monitoring, 27 patients showed a decrease in the SUVmax ranging from 78% to 5%. Sixteen patients showed an increase in the SUVmax ranging from 1% to 74%. The relative change in the SUVmax at the early 18F-FDG PET/CT scan (compared with the baseline) showed a significant correlation with the relative change in the SUVmax at the later 18F-FDG PET/CT scan (0.82; P < 0.001) (Fig. 3). Of the 20 patients with a decrease in the SUVmax within 1 wk, only 1 patient showed a later increase above the baseline level (22%).
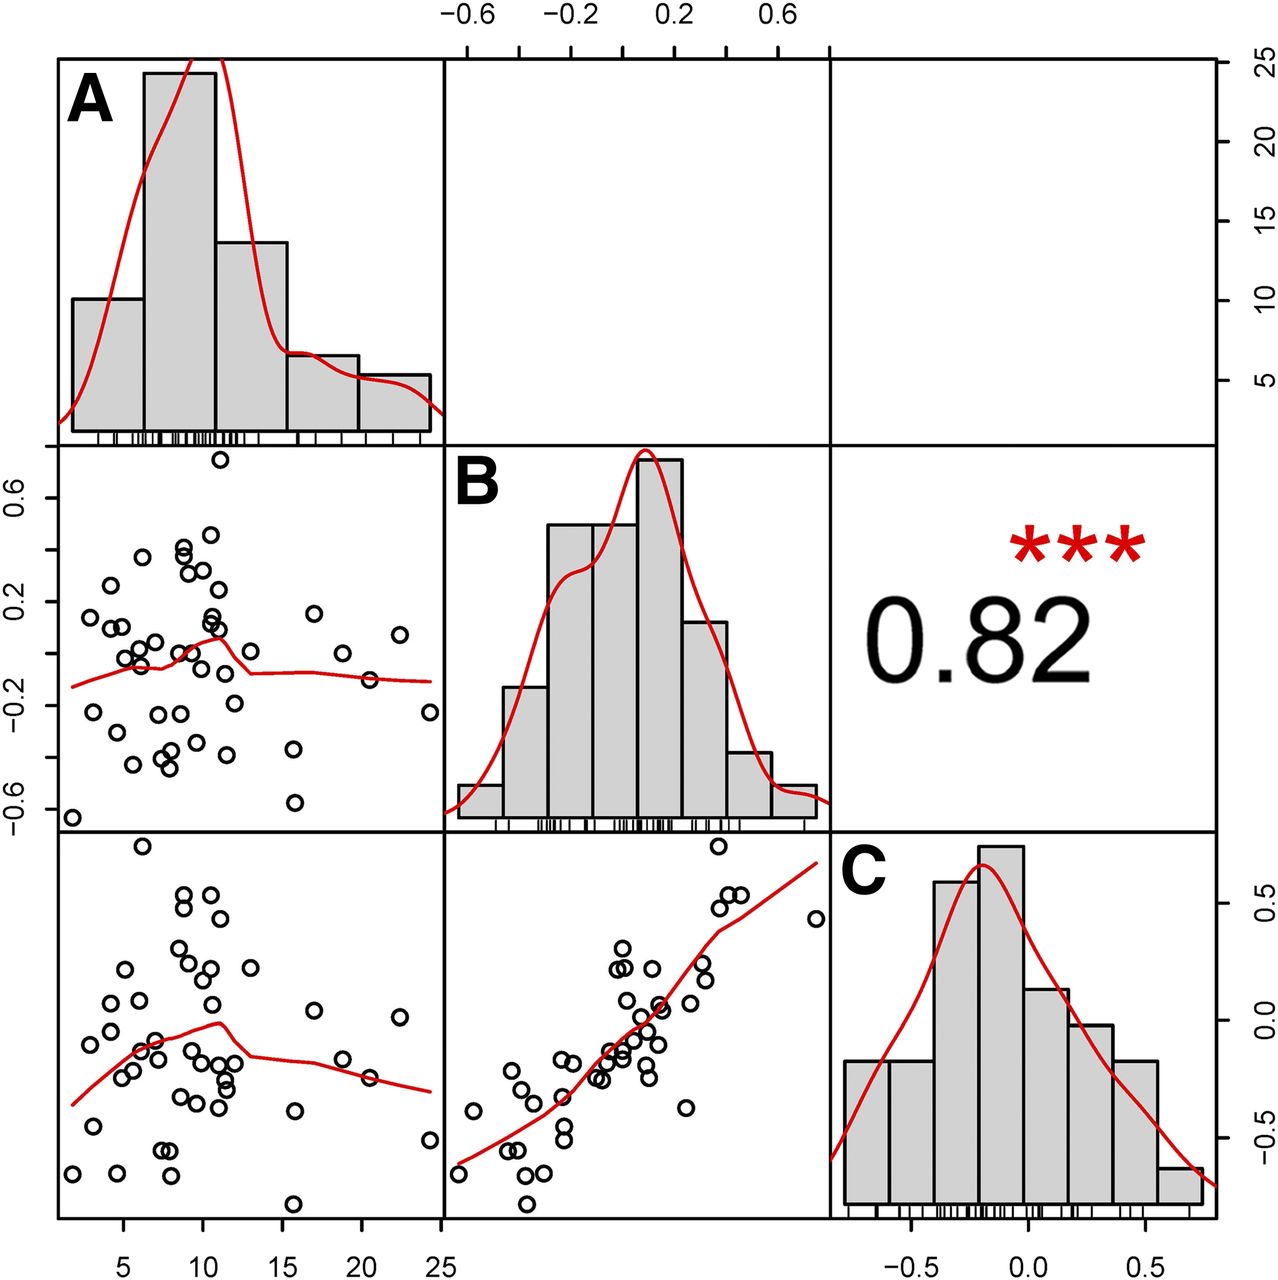
Correlation matrix for (relative) SUVmax. (A) Distribution of absolute SUVmax at baseline. (B and C) Distributions of relative changes in SUVmax at 1 wk (B) and 3 wk (C). ***P < 0.001.
Table 2 shows the metabolic data at early and later scans according to EORTC criteria. None of the patients with progressive metabolic disease at the early 18F-FDG PET/CT scan showed a significant decrease in the SUVmax at the later scan. At early monitoring, 10 patients (23%) showed a partial metabolic response (decrease in the SUVmax of more than 25%). After 3 wk, 14 patients (33%) were classified as responders; 9 of them had been identified at early monitoring. The median percentage of tumor necrosis in the resection specimens was 30% (range, 0%–97%). In 3 patients (7%), more than 90% tumor necrosis was seen. Tumor specimens from 8 patients (19%) showed 50%–90% tumor necrosis. In the resection specimens from 32 patients (74%), less than 50% tumor necrosis was seen.
Responses at Early and Later 18F-FDG PET/CT Scans According to EORTC Criteria
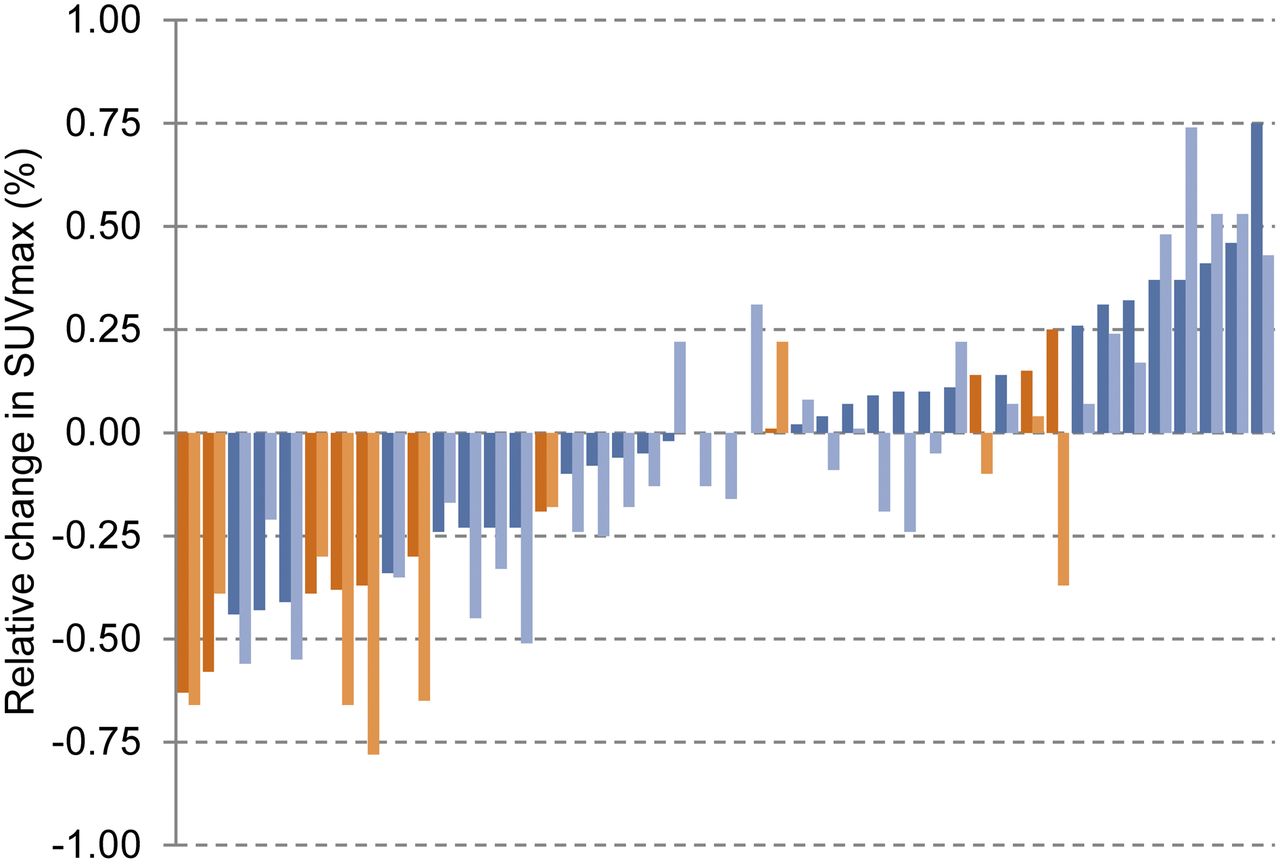
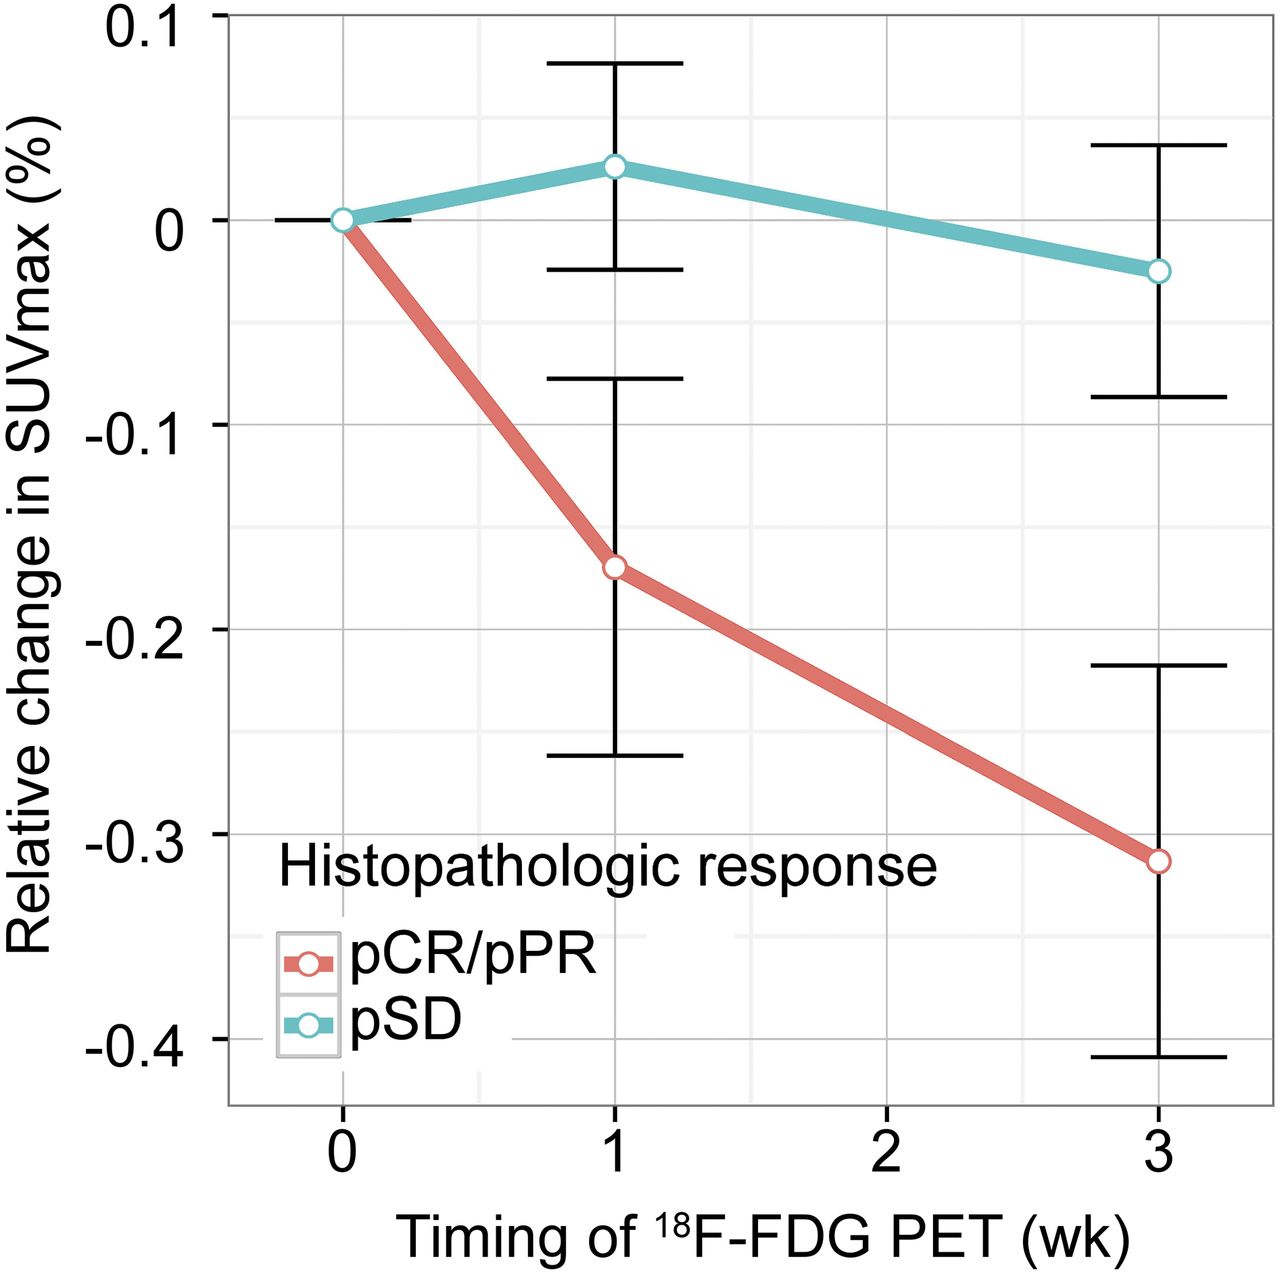
Figures 4 and 5 show the relative change in the SUVmax according to the histopathologic response at both early and later scans. In patients with more than 50% tumor necrosis, the SUVmax decreased by a mean of 17% within 1 wk and a mean of 31% at 3 wk.

Waterfall plot of individual relative change in SUVmax according to histopathologic response. Dark orange bars show relative change in SUVmax at early 18F-FDG PET/CT scan in patients with pathologic response. Light orange bars show relative change in SUVmax at late 18F-FDG PET/CT scan in patients with pathologic response. Dark blue bars show relative change in SUVmax at early 18F-FDG PET/CT scan in patients without pathologic response. Light blue bars show relative change in SUVmax at late 18F-FDG PET/CT scan in patients without pathologic response.

Relative change in SUVmax according to histopathologic response. pCR = more than 90% tumor necrosis; pPR = 50%–90% necrosis; pSD = less than 50% necrosis.
Of the patients for whom the early 18F-FDG PET/CT scan indicated progressive disease, none had a significant later metabolic response or histopathologic response (>50% necrosis).
There was no significant difference in 18F-FDG uptake at baseline between EGFR-positive and EGFR-negative tumors (mean ± SD, 9.1 ± 4.6 and 9.9 ± 5.3, respectively; P = 0.74). All 5 patients who had tumors with EGFR mutations showed a metabolic response at the early scan, and 4 patients also showed a response at the later scan (1 patient discontinued erlotinib after 13 d because of toxicity). 18F-FDG uptake in tumors with EGFR mutations decreased to a mean SUVmax of 5.7 (SD, 2.8) at the early scan and a mean SUVmax of 4.0 (SD, 2.5) at the later scan (P = 0.004).
DISCUSSION
The results of the present study showed that a change in metabolic activity within 1 wk after the initiation of erlotinib treatment is informative for a histopathologic response after 3 wk of treatment. A decrease in metabolic activity within 1 wk likely will continue after 3 wk of therapy (94%). On the other hand, an increase in the SUVmax during the first week will persist in most patients, suggesting ineffective treatment.
Although screening after 3 wk revealed 5 more patients with a partial metabolic response than screening after 1 wk, a partial histopathologic response was seen in the resection specimen from only 1 of these patients. In addition, 1 other patient had a partial metabolic response at the early 18F-FDG PET/CT scan and stable metabolic disease at the late 18F-FDG PET/CT scan. In this patient, erlotinib treatment was discontinued because of side effects. Furthermore, 4 of the 23 patients with no change or an increase in the SUVmax at the early 18F-FDG PET/CT scan showed a partial histopathologic response, of which only 1 patient with a partial metabolic response was identified at the later scan.
The metabolic response did not exactly correspond to histopathologic regression of the tumor. 18F-FDG uptake on PET may reflect various tissue reactions, such as tumor progression or regression, as well as senescence, fibrosis formation, and inflammatory reactions such as macrophage infiltration. Pathologic evaluation of (residual) tumor tissue after targeted treatment is also challenging. Although some pathologic reports have described criteria for a response to neoadjuvant treatment based on necrosis, fibrosis, and regression, a gold standard for classifying regression in response to TKI therapy is lacking. A response to erlotinib can be expected to develop within several weeks, but apoptosis, transitioning of necrosis to fibrosis, and inflammatory and granulomatous reactions are difficult to quantify. Because some spontaneous necrosis exists in most NSCLCs, a cautious cutoff of more than 50% necrosis was used for a pathologic response (20).
Despite the heterogeneous and metabolically dynamic nature of the tumor, the results of the present study showed that additional screening after 3 wk seems to have less value. Therefore, for patients with no change or an increase in the SUVmax on early 18F-FDG PET/CT scans, TKI treatment could be discontinued and surgery could be advanced. Adequate early treatment monitoring has several advantages. Patients who do not benefit from therapy are only exposed to potential toxicity for a short period of time (20). In addition, the successes of new therapeutic agents have led to increases in health care costs that are causing serious financial burdens for patients, hospitals, and society (23). With early assessment, the futile use of medications can be avoided, and patients who do not respond to EGFR TKIs may be given other, more effective treatments (24,25). In our series, early screening for no change or an increase in the SUVmax on 18F-FDG PET/CT will result in a discontinuation of TKI therapy for 53% of the patients.
To our knowledge, the present study is the first to analyze the timing of monitoring of the metabolic response to neoadjuvant targeted therapy in early-stage lung cancer and the relationship with pathologic signs of regression. Several other investigations have demonstrated the value of early metabolic monitoring (days 7–14) for predicting progression-free survival and overall survival in advanced-stage disease. Our data are in line with those of Zander et al. (19) and O’Brien et al. (26), who showed that early monitoring can predict the metabolic response at a later scan after erlotinib treatment in patients with advanced NSCLC.
For categorization of the metabolic response, we used EORTC criteria (25% decrease in the SUVmax). One could argue that this cutoff might be suboptimal for early assessment (within 1 wk of treatment initiation). Takahashi et al. (27) used 18F-FDG PET/CT for gefitinib response monitoring after 2 d and 1 mo of treatment of 20 patients with advanced lung adenocarcinoma and suggested a cutoff of 20% for a decrease in the SUVmax at early monitoring. However, the size of the study did not permit testing of other cutoff values.
In our series, there was large variability in the timing of the 18F-FDG PET/CT studies because of difficulties in scheduling and therefore in adherence to the protocol. However, our analyses regarding the timing of the studies revealed no difference in correlation between early and later metabolic responses. The observed changes in the SUVmax were above and beyond variations or errors (28). Other limitations of the study were the lack of an untreated control group and the fact that some patients did not complete the planned treatment course of 21 d because of toxicity.
Nevertheless, our data showed that response monitoring with 18F-FDG PET/CT has great potential for targeted treatment and can be performed as early as 1 wk after the initiation of treatment. Patients with a substantial decrease in metabolic activity during erlotinib treatment probably will benefit from continued treatment. Metabolic cutoff values may be optimized.
CONCLUSION
Response monitoring with 18F-FDG PET/CT scans within 1 wk after the start of erlotinib treatment identified most histopathologic responders. A decrease in metabolic activity within 1 wk is likely to continue after 3 wk of therapy. Therefore, an additional 18F-FDG PET/CT scan after 3 wk of treatment seems to have less value.
DISCLOSURE
The costs of publication of this article were defrayed in part by the payment of page charges. Therefore, and solely to indicate this fact, this article is hereby marked “advertisement” in accordance with 18 USC section 1734. This phase II study was an investigator-initiated study supported by an unrestricted educational grant from Roche, The Netherlands. No other potential conflict of interest relevant to this article was reported.
Acknowledgments
We thank the staff of the data center at The Netherlands Cancer Institute for data management and logistic support. The members of the NEL Study Group are as follows: Houke M. Klomp, MD, PhD, Department of Surgical Oncology, The Netherlands Cancer Institute–Antoni van Leeuwenhoek Hospital, Amsterdam, The Netherlands; I. Kappers, MD, Department of Surgical Oncology, The Netherlands Cancer Institute–Antoni van Leeuwenhoek Hospital, Amsterdam, The Netherlands; M.W. Wouters, MD, PhD, Department of Surgical Oncology, The Netherlands Cancer Institute–Antoni van Leeuwenhoek Hospital, Amsterdam, The Netherlands; Eva E. Schaake, MD, Department of Thoracic Oncology, The Netherlands Cancer Institute–Antoni van Leeuwenhoek Hospital, Amsterdam, The Netherlands; Tjeerd S. Aukema, MD, PhD, Department of Surgical Oncology, The Netherlands Cancer Institute–Antoni van Leeuwenhoek Hospital, Amsterdam, The Netherlands; N. van Zandwijk, MD, PhD, Department of Thoracic Oncology, The Netherlands Cancer Institute–Antoni van Leeuwenhoek Hospital, Amsterdam, The Netherlands; Sjaak A. Burgers, MD, PhD, Department of Thoracic Oncology, The Netherlands Cancer Institute–Antoni van Leeuwenhoek Hospital, Amsterdam, The Netherlands; P. Baas, MD, PhD, Department of Thoracic Oncology, The Netherlands Cancer Institute–Antoni van Leeuwenhoek Hospital, Amsterdam, The Netherlands; M. van den Heuvel, MD, PhD, Department of Thoracic Oncology, The Netherlands Cancer Institute–Antoni van Leeuwenhoek Hospital, Amsterdam, The Netherlands; W. Buikhuisen, MD, Department of Thoracic Oncology, The Netherlands Cancer Institute–Antoni van Leeuwenhoek Hospital, Amsterdam, The Netherlands; Renato A. Valdés Olmos, MD, PhD, Department of Nuclear Medicine, The Netherlands Cancer Institute–Antoni van Leeuwenhoek Hospital, Amsterdam, The Netherlands; H.J. Teertstra, MD, Department of Radiology, The Netherlands Cancer Institute–Antoni van Leeuwenhoek Hospital, Amsterdam, The Netherlands; D. de Jong, MD, PhD, Department of Pathology, The Netherlands Cancer Institute–Antoni van Leeuwenhoek Hospital, Amsterdam, The Netherlands; Renée van Pel, MD, Department of Pathology, The Netherlands Cancer Institute–Antoni van Leeuwenhoek Hospital, Amsterdam, The Netherlands; Harm van Tinteren, PhD, Department of Biometrics, The Netherlands Cancer Institute–Antoni van Leeuwenhoek Hospital, Amsterdam, The Netherlands; O. Dalesio, PhD, Department of Biometrics, The Netherlands Cancer Institute–Antoni van Leeuwenhoek Hospital, Amsterdam, The Netherlands; Herman Rijna, MD, PhD, Department of Thoracic Surgery, Kennemer Gasthuis, Haarlem, The Netherlands; C. Weenink, MD, Department of Pulmonology, Kennemer Gasthuis, Haarlem, The Netherlands; A. Dingemans, MD, PhD, Department of Pulmonology, Maastricht Academic Medical Centre, Maastricht, The Netherlands; J. Brahim, MD, Department of Pulmonology, Haga Hospital, The Hague, The Netherlands; and H.E. Codrington, MD, Department of Pulmonology, Haga Hospital, The Hague, The Netherlands.
Footnotes
Published online May 8, 2014.
- © 2014 by the Society of Nuclear Medicine and Molecular Imaging, Inc.
REFERENCES
- Received for publication August 30, 2013.
- Accepted for publication March 14, 2014.


Jump to section
Related Articles
Cited By...
- 18F-FDG PET/CT for Very Early Response Evaluation Predicts CT Response in Erlotinib-Treated Non-Small Cell Lung Cancer Patients: A Comparison of Assessment Methods
- Prognostic value of early response assessment using (18F)FDG-PET in patients with advanced non-small cell lung cancer treated with tyrosine-kinase inhibitors