


Abstract
KRAS gene mutations occur in approximately 40% of colorectal cancers (CRCs) and are associated with resistance to anti–epidermal growth factor receptor antibody therapy. We previously demonstrated that 18F-FDG accumulation in PET was significantly higher in CRCs with mutated KRAS than in those with wild-type KRAS in a clinical setting. Here, we investigated the mechanisms by which mutated KRAS increased 18F-FDG accumulation. Methods: Using paired isogenic human CRC cell lines that differ only in the mutational status of the KRAS gene, we measured 18F-FDG accumulation in these cells in vitro and in vivo. We also investigated the roles of proteins that have a function in 18F-FDG accumulation. Finally, we examined the relationship among mutated KRAS, hypoxia-inducible factor 1α (HIF-1α), and maximum standardized uptake value with 51 clinical CRC samples. Results: In the in vitro experiments, 18F-FDG accumulation was significantly higher in KRAS-mutant cells than in wild-type controls under normoxic conditions. The expression levels of glucose transporter 1 (GLUT1) and hexokinase type 2 (HK2) were higher in KRAS-mutant cells, and 18F-FDG accumulation was decreased by knockdown of GLUT1. Hypoxic induction of HIF-1α was higher in KRAS-mutant cells than in wild-type controls; in turn, elevated HIF-1α resulted in higher GLUT1 expression and 18F-FDG accumulation. In addition, HIF-1α knockdown decreased 18F-FDG accumulation under hypoxic conditions only in the KRAS-mutant cells. Small-animal PET scans showed in vivo 18F-FDG accumulation to be significantly higher in xenografts with mutated KRAS than in those with wild-type KRAS. The immunohistochemistry of these xenograft tumors showed that staining of GLUT1 was consistent with that of HIF-1α and pimonidazole. In a retrospective analysis of clinical samples, KRAS mutation exhibited a significantly positive correlation with expressions of GLUT1 and HIF-1α and with maximum standardized uptake value. Conclusion: Mutated KRAS caused higher 18F-FDG accumulation possibly by upregulation of GLUT1; moreover, HIF-1α additively increased 18F-FDG accumulation in hypoxic lesions. 18F-FDG PET might be useful for predicting the KRAS status noninvasively.
Colorectal cancer (CRC) is the third most common cancer in the world and the fourth most common cause of cancer-related deaths. CRC develops through multiple steps with the sequential acquisition of genetic alterations in tumor suppressors and oncogenes. Mutations in the KRAS gene occur in approximately 40% of CRCs; these mutations involve codons 12 and 13 in more than 90% of cases. Several studies have shown that KRAS mutation predicts a lack of response to therapies targeted to the epidermal growth factor receptor (EGFR) (1,2). Cetuximab and panitumumab, anti-EGFR monoclonal antibodies, are now recommended for use only on CRC tumors with wild-type KRAS, although a wild-type KRAS gene does not guarantee a response to either antibody.
Hypoxia-inducible factor 1α (HIF-1α) is a transcriptional factor that mediates cellular response to hypoxia, including angiogenesis and glucose metabolism. Cellular HIF-1α levels are regulated not only by intratumoral hypoxia but also by genetic alterations such as oncogene activation or loss of tumor suppressors (3). HIF-1α is overexpressed in many types of human cancers, and HIF-1α overexpression is strongly associated with malignant progression and poor prognosis (4,5).
In cases of CRC, PET with 18F-FDG is a useful tool for staging before surgery, for detecting suspected recurrence, and for monitoring treatment response (6). 18F-FDG PET scans are used to evaluate glucose metabolism by measuring uptake of 18F-FDG, a glucose analog. 18F-FDG is transported into the cell via glucose transporters and then is phosphorylated by hexokinases to 18F-FDG-6-phosphate, which becomes trapped within the cell. Malignant tumors prefer to metabolize glucose by glycolysis even in the presence of ample oxygen, so-called aerobic glycolysis. This change was initially described by Otto Warburg (the Warburg effect) over 50 y ago (7). This general increase in glucose metabolism is responsible for 18F-FDG accumulation in tumor cells and the positive signals on 18F-FDG PET scans (8). It has been shown that 18F-FDG accumulation depends largely on the glucose transporter (GLUT1) and the rate-limiting glycolytic enzyme, hexokinase type 2 (HK2), in most types of cancer (9). Several studies on CRC have indicated that increased GLUT1 expression is the most essential factor for 18F-FDG accumulation when compared with hexokinase activity (9). Recently, we conducted a retrospective analysis on 51 CRC patients and found that KRAS/BRAF mutations significantly increase 18F-FDG accumulation (10). However, the molecular mechanism underlying KRAS-dependent effects on 18F-FDG accumulation is not yet clear. The purpose of this study was to investigate the mechanisms by which mutated KRAS causes increased 18F-FDG accumulation in CRCs, using both in vitro and in vivo experiments. In addition, we evaluated the clinical relevance of these mechanisms with clinical CRC samples.
MATERIALS AND METHODS
The “Materials and Methods” section can be found as a supplemental file online at http://jnm.snmjournals.org.
RESULTS
Relationship Between KRAS Mutation and Glucose Metabolism
To investigate whether KRAS affects glucose metabolism in CRC, we used human isogenic CRC cell lines in which an endogenous mutant KRAS allele was disrupted through targeted homologous recombination (11). The human CRC cell lines HCT116 and DLD-1 have a mutation at codon 13 (G13D) of the KRAS gene. HKe-3 and HKh-2 are 2 independent HCT116 clones disrupted at mutated KRAS; similarly, DKO-4 is a DLD-1 clone disrupted at mutated KRAS. These paired lines essentially differ by only 1 base pair that is mutated or wild-type in the KRAS gene and permit examination of cells expressing normal or mutant KRAS proteins at physiologic, normally regulated levels. Because these CRC lines also harbor additional mutations in genes such as CTNNB1 and TGFβ-RII (12,13), they allow KRAS signaling to be studied in the context of other commonly mutated genes in CRC.
Several recent studies have reported that 18F-FDG accumulation in tumor cells depends largely on the GLUT1 and HK2. Therefore, we first evaluated these expression levels in each CRC cell line by quantitative reverse transcription polymerase chain reaction analysis and found that HCT116 and DLD-1, parental cell lines with mutated KRAS, had significantly higher messenger RNA levels of GLUT1 and HK2 than did their isogenic counterparts containing wild-type KRAS allele (HKe-3 and HKh-2; DKO-4) (Fig. 1A). In addition, Western blotting demonstrated that GLUT1 protein expression was about 2.5-fold higher in HCT116 than in HKe-3 and HKh-2 cells and about 3.0-fold higher in DLD-1 than in DKO-4 cells. HK2 protein expression was also significantly higher in the parental KRAS-mutant cells than in wild-type KRAS cells (Fig. 1B).
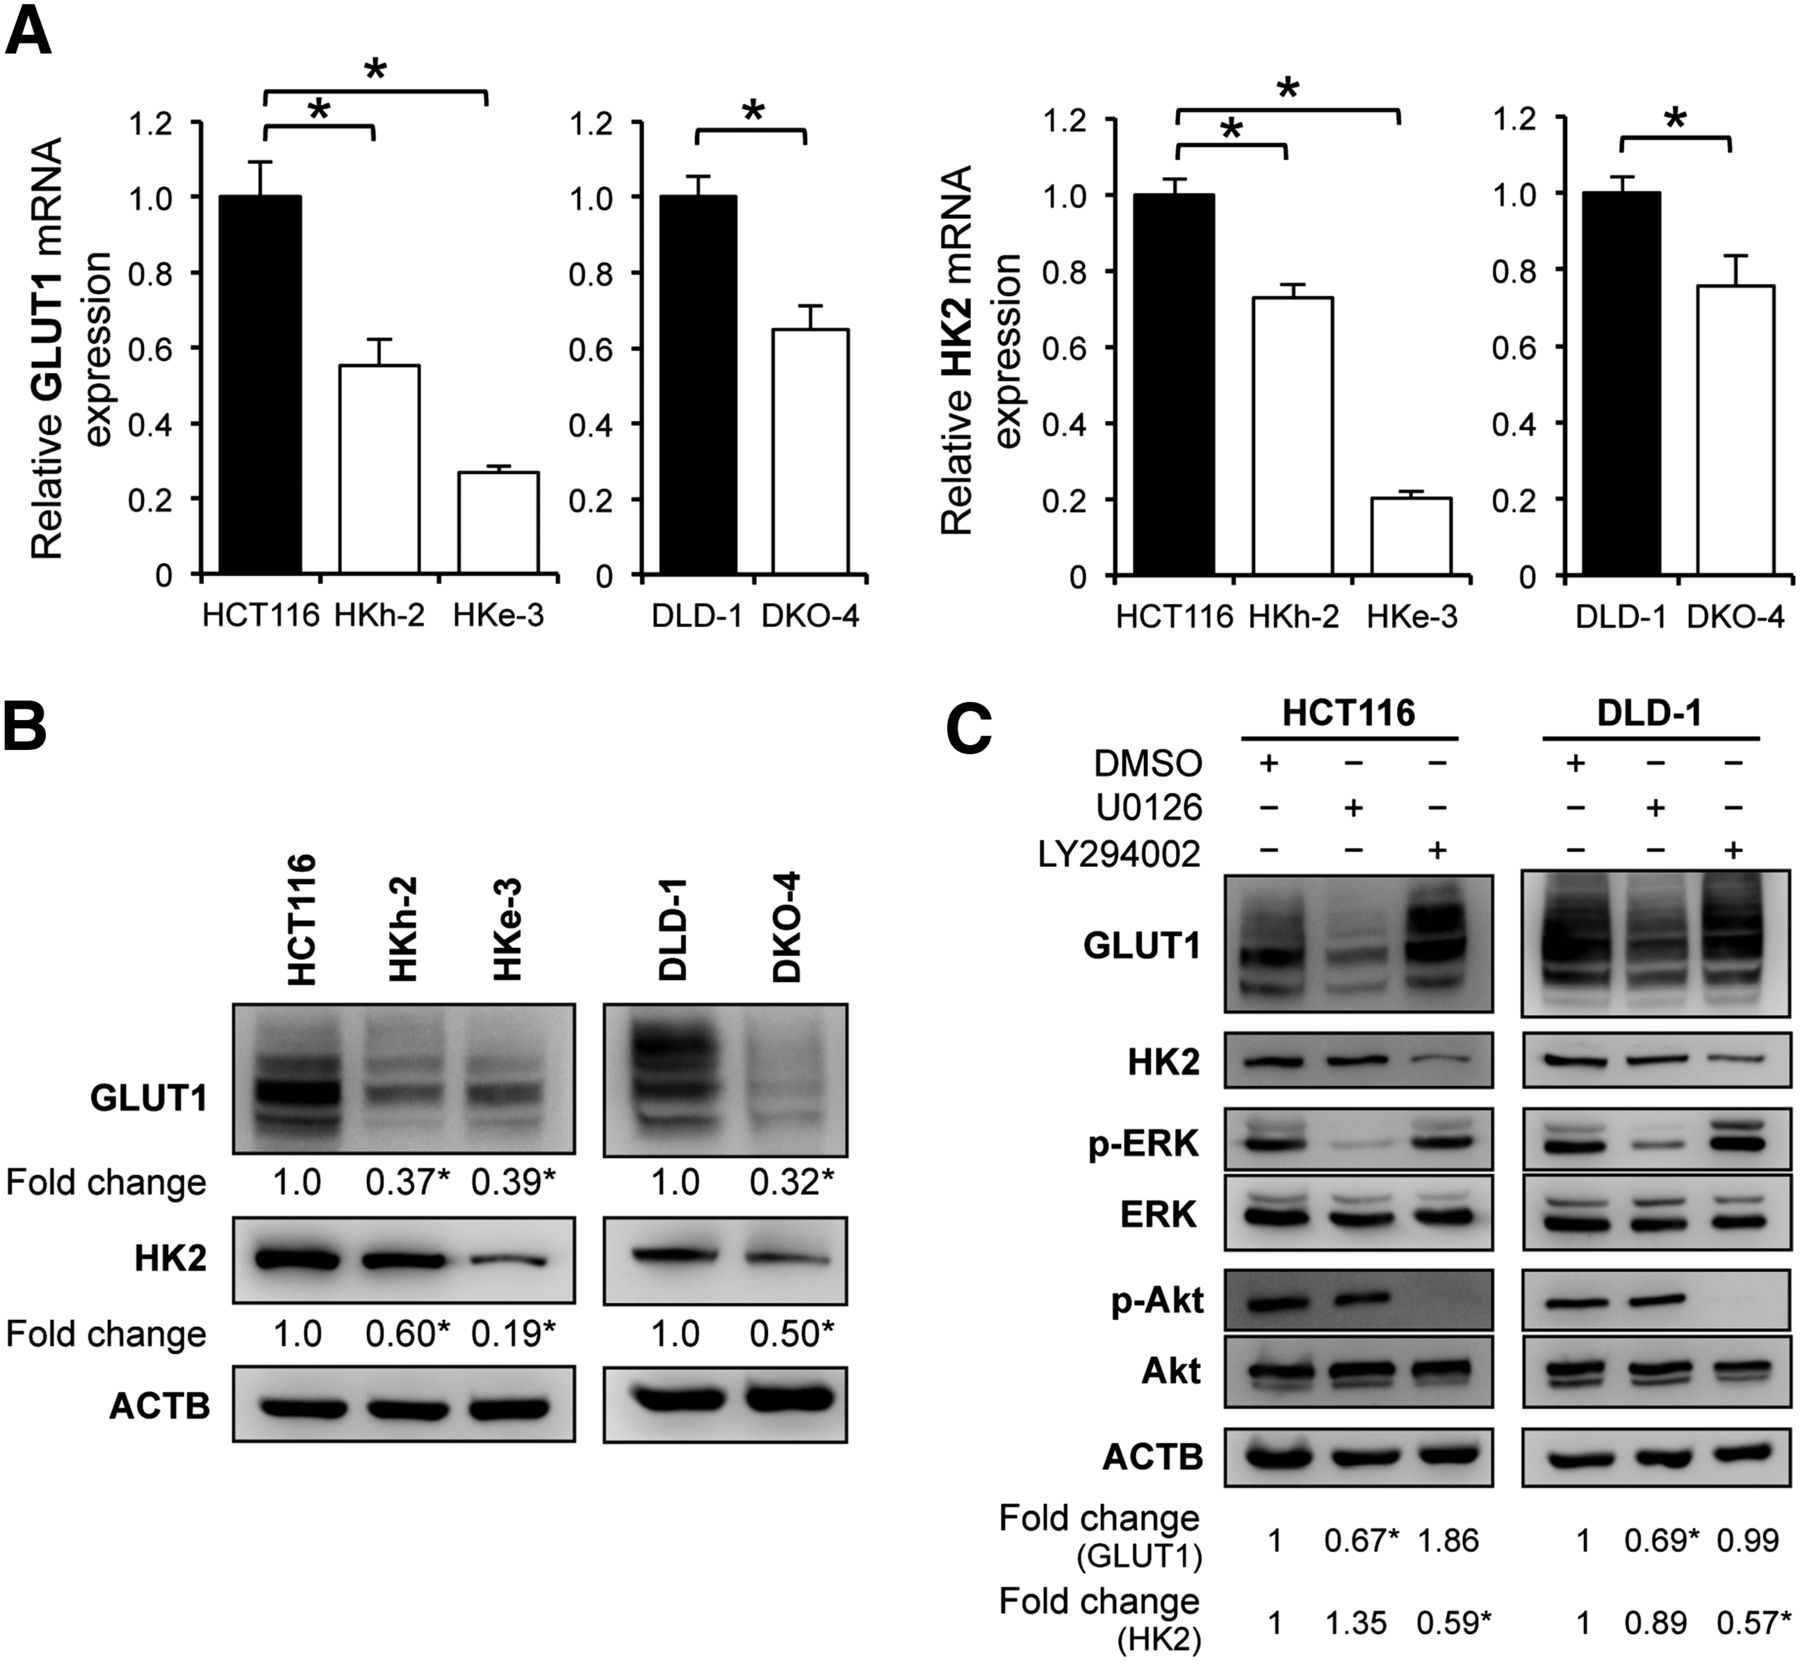
Relationship between KRAS mutation and glucose metabolism. (A) Quantitative reverse transcription polymerase chain reaction analysis showing messenger RNA levels for GLUT1 and HK2 in KRAS-mutated cell lines (HCT116 and DLD-1) and their isogenic counterparts with wild-type KRAS (HKh-2, HKe-3, and DKO-4). (B) Western blot analyses showing protein expression of GLUT1 and HK2. Signal band densities were quantified, and expression levels of GLUT1 and HK2 were normalized to β actin. Densitometry values are expressed as fold change compared with HCT116 or DLD-1. (C) Western blot analyses of HCT116 and DLD-1 cells treated with dimethyl sulfoxide (DMSO), 20 μM U0126 (MEK inhibitor), or 50 μM LY294002 (PI3K inhibitor) for 48 h. Protein levels were normalized to β-actin. Densitometry values are expressed as fold change compared with DMSO-treated cells. *P < 0.01.
KRAS protein activates its downstream signaling pathways, such as Raf/mitogen-activated protein kinase kinase (MEK)/extracellular signal-regulated kinase (ERK) and phosphoinositide 3-kinase (PI3K)/Akt, that result in malignant transformation. We used a specific inhibitor of each pathway to examine which pathway played a role in mutated KRAS-mediated upregulation of GLUT1 and HK2. HCT116 and DLD-1 cells were treated with an MEK inhibitor (1,4-diamino-2,3-dicyano-1,4-bis(2-aminophenylthio)butadiene [U0126], 10 μM), or a PI3K inhibitor (2-(4-morpholinyl)-8-phenyl-4H-1-benzopyran-4-one [LY294002], 50 μM) for 48 h. Western blotting showed that GLUT1 protein synthesis was inhibited by U0126 (about a 30% decrease for HCT116 and DLD-1) but not by LY294002. On the other hand, HK2 protein synthesis was inhibited by LY294002 (about a 40% decrease for HCT116 and DLD-1) but not by U0126 (Fig. 1C). We also confirmed that HK2 protein synthesis was significantly inhibited by another PI3K inhibitor (5-[2,6-di(4-morpholinyl)-4-pyrimidinyl]-4-(trifluoromethyl)-2-pyridinamine [BKM120], 1 μM) or mammalian-target-of-rapamycin inhibitor (Rapamycin) (20 nM) (Supplemental Fig. 1A). In HKe-3 and DKO-4 cells, we further observed that GLUT1 protein synthesis was unaltered by U0126, whereas HK2 protein synthesis was inhibited by LY294002, BKM120, or Rapamycin (Supplemental Fig. 1B). These data indicated that the Raf/MEK/ERK pathway correlated with GLUT1 expression in KRAS-mutant cells and that the PI3K/Akt pathway correlated with HK2 expression in both KRAS-mutant and wild-type KRAS cells.
In Vitro 18F-FDG Accumulation into CRC Cell Lines
We hypothesized that the KRAS mutation would increase glucose uptake and 18F-FDG accumulation in CRC cells by up-regulating expression of GLUT1, HK2, or both. To test this idea, we incubated each cell line with 18F-FDG and then measured 18F-FDG uptake in vitro. 18F-FDG accumulation was significantly higher in HCT116 cells than in HKe-3 and HKh-2 cells; similarly, accumulation was higher in DLD-1 cells than in DKO-4 cells (Fig. 2A).
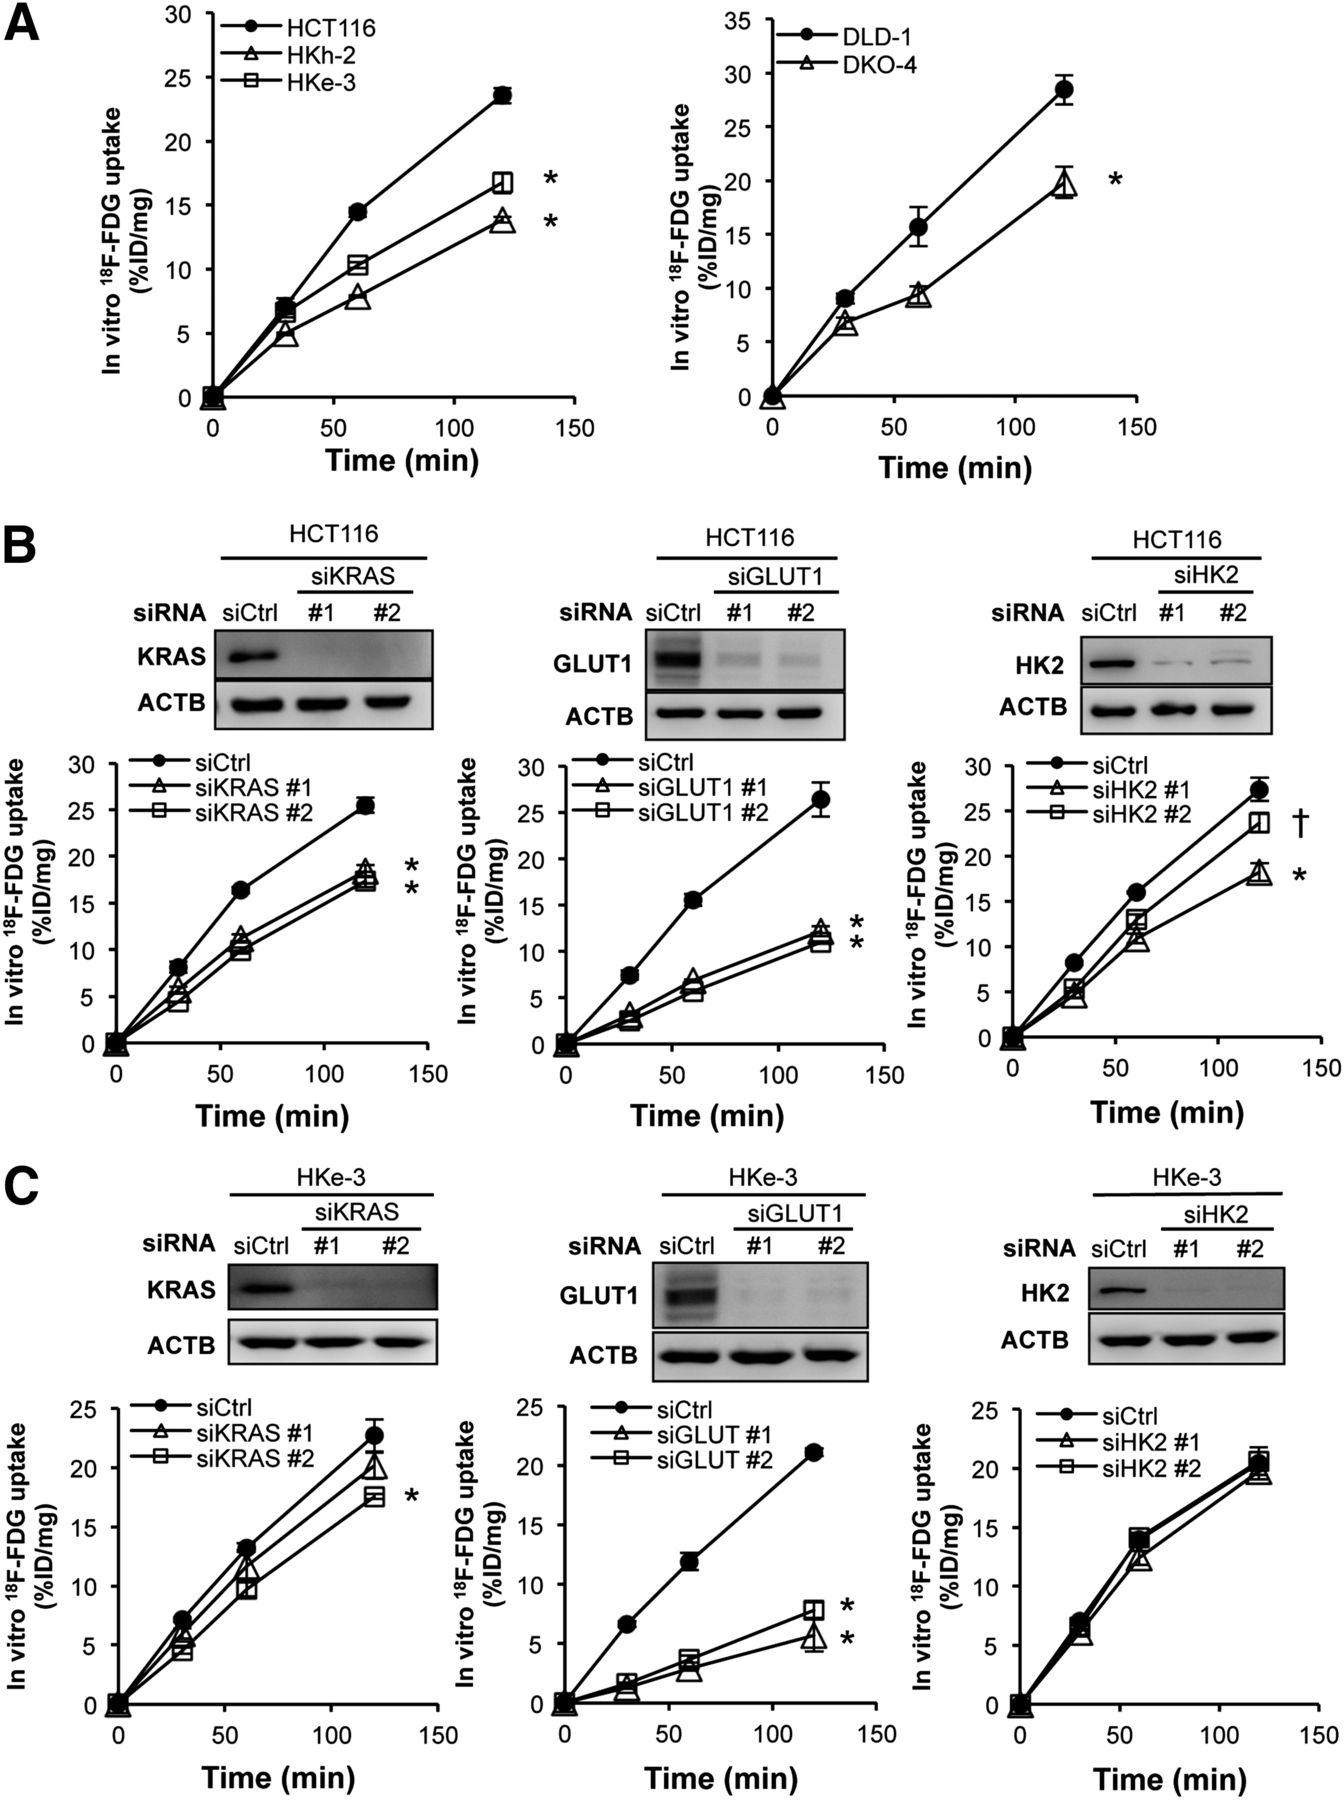
In vitro 18F-FDG accumulation. (A) In vitro 18F-FDG accumulation into CRC cells with or without KRAS mutation. HCT116 cells (B) and HKe-3 cells (C) were treated separately with 2 independent siRNA constructs (#1 and #2) targeting KRAS, GLUT1, and HK2 or non-silencing siRNA (Ctrl). Forty-eight hours after transfection, expression levels of each protein were confirmed with Western blotting (upper panels), and in vitro 18F-FDG accumulation was measured (lower panels). 18F-FDG accumulation levels are presented as mean ± SD of triplicate measurements. *P < 0.01. †P < 0.05. %ID = percentage injected dose.
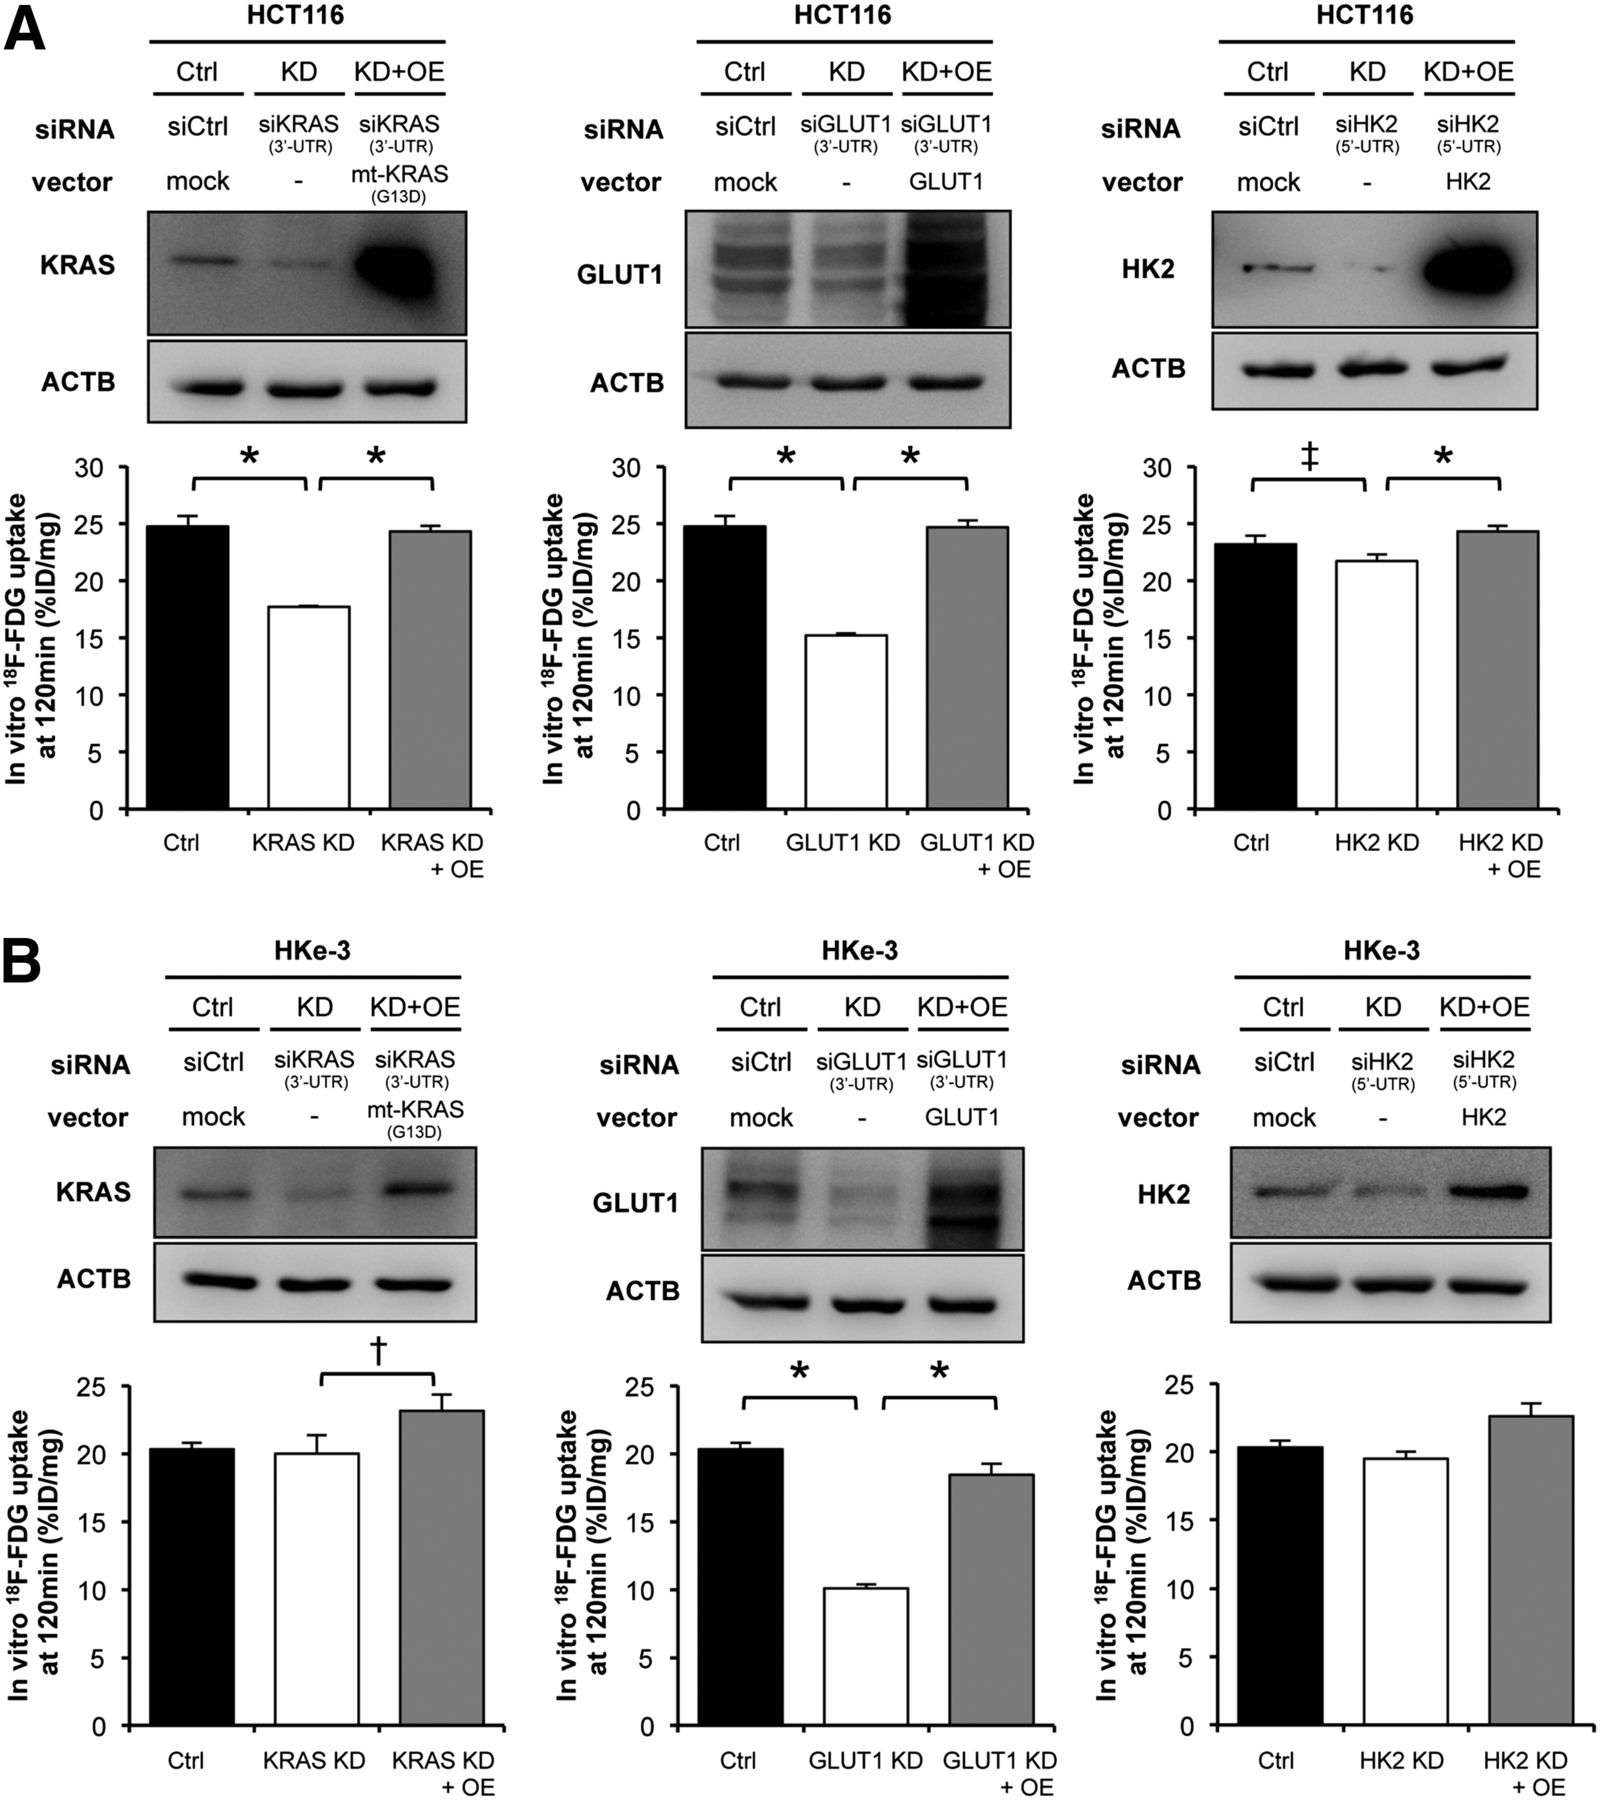
To gain further insight into 18F-FDG accumulation in CRC cells, we performed RNA interference experiments. We separately introduced into these cell lines 2 independent small interfering RNA (siRNA) constructs targeting KRAS, GLUT1, and HK2 (referred to as siKRAS #1 and #2, siGLUT1 #1 and #2, and siHK2 #1 and #2, respectively) and verified that both siRNA constructs dramatically decreased expression of each protein. In HCT116 cells, 18F-FDG accumulation was significantly decreased by treatment with either siKRAS or siGLUT1, whereas the effect of siHK2 was weak (Fig. 2B). On the other hand, 18F-FDG accumulation in HKe-3 cells was significantly decreased by siGLUT1 but only minimally decreased by siKRAS and not decreased at all by siHK2 (Fig. 2C). To test whether these effects of siRNAs were specific, we further performed rescue experiments after treatment with siRNAs. Namely, we transiently transfected the mutated KRAS (G13D), GLUT1, or HK2 expression vectors into cells treated with siRNA that were targeting 5′ or 3′ untranslated region of the respective genes. In HCT116 cells, the decrease of 18F-FDG accumulation induced by siKRAS, siGLUT1, or siHK2 was significantly recovered (Fig. 3A). In HKe-3 cells, the decrease of 18F-FDG accumulation induced by siGLUT1 was significantly recovered (Fig. 3B). Interestingly, 18F-FDG accumulation was significantly increased by overexpression of mutated KRAS (G13D), although it was not decreased by knockdown of wild-type KRAS (Fig. 3B, left panels). The results with DLD-1 cells were similar to those with HCT116 cells (Supplemental Figs. 2A and 2B). These data indicated that mutated KRAS caused increased 18F-FDG accumulation in CRC cells mainly by up-regulating GLUT1 expression.

In vitro 18F-FDG accumulation after knockdown or overexpression of KRAS, GLUT1, and HK2. Mutant-KRAS, GLUT1, and HK2 expression vectors were transiently cotransfected with siRNAs targeting 3′ or 5′ untranslated region (UTR) of respective genes into HCT116 cells (A) and HKe-3 cells (B). Forty-eight hours after transfection, expression levels of each protein were confirmed with Western blotting (upper panels). In vitro 18F-FDG accumulations at 120 min are presented as mean ± SD of triplicate measurements (lower panels). *P < 0.01. †P < 0.05. ‡P = 0.057). %ID = percentage injected dose; Ctrl = control; KD = knockdown; OE = overexpression.
In Vivo 18F-FDG Accumulation into Xenograft Tumors
To assess the effect of mutated KRAS on 18F-FDG accumulation in vivo, we measured 18F-FDG accumulation into transplanted xenograft tumors in severe combined immunodeficiency mice using small-animal 18F-FDG PET/CT scans. HCT116 and HKe-3 cells were injected subcutaneously into the right and left flanks, respectively, of the individual mice. As previously reported (11,14), HKe-3 cells do not grow as xenograft tumors in nude mice, but we found that HKe-3 cells mixed with Matrigel could grow as xenograft tumors in severe combined immunodeficiency mice. Microscopic pathologic examination revealed these tumors to be composed of viable, nonnecrotic cancer cells (Supplemental Fig. 3A), and 18F-FDG PET/CT images clearly delineated these tumors. Importantly, 18F-FDG accumulation was much higher in HCT116 tumors than in HKe-3 tumors (Fig. 4A). For quantitative analysis, we calculated tumor-to-liver 18F-FDG uptake ratios, because 18F-FDG uptake in the normal liver remains stable. We have found that there was a significant difference between HCT116 and HKe-3 tumors (4.19 ± 0.27 vs. 1.90 ± 0.28, respectively; P < 0.01; Fig. 4B, left). However, there was no significant difference in tumor size among them at the time of imaging (Fig. 4B, right).
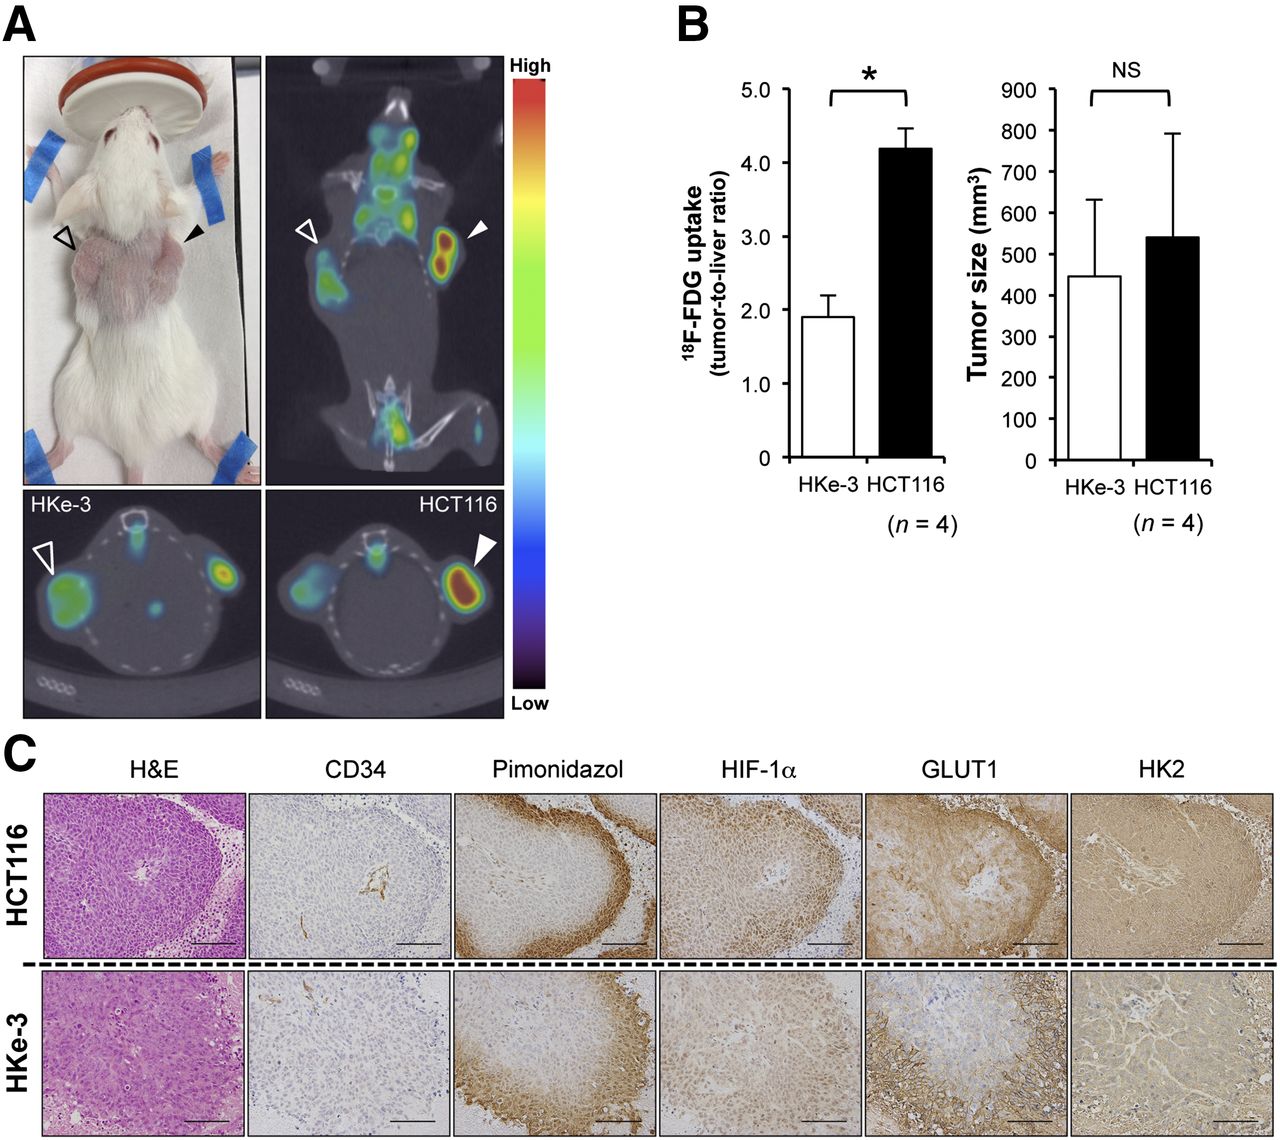
18F-FDG PET/CT scans and immunohistochemical analysis of xenograft tumors. (A) Representative images of 18F-FDG PET/CT scan. Open triangles indicate HKe-3 xenograft tumors, and closed triangles indicate HCT116 xenograft tumors. At top left is picture of tumor-bearing mouse; at top right, coronal section; at bottom left, transverse section of HKe-3 tumor; and at bottom right, transverse section of HCT116 tumor. (B) At left is quantification of 18F-FDG uptake into xenografts. Values are mean ± SD of tumor-to-liver ratio (n = 4, *P < 0.01). At right is size of HKe-3 and HCT116 tumors at time of imaging. Values are mean ± SD (n = 4, not significant [NS]). (C) Hematoxylin and eosin (H&E) and immunohistochemical staining for CD34, pimonidazole, HIF-1α, GLUT1, and HK2 of xenograft tumors derived from HCT116 and HKe-3 cells. Scale bar = 100 μm.
Immunohistochemical Analysis of Xenograft Tumors
Hypoxic regions are frequently found in solid tumors, including CRCs, and HIF-1α is a transcriptional factor that transactivates hypoxia-induced genes important for two universal characteristics: angiogenesis (e.g., VEGF expression) and glycolysis (e.g., GLUT1 expression) (4). A previous report indicated that mutated KRAS enhances the hypoxia-induced expression of HIF-1α at the translational level in CRC cells (15). Therefore, we hypothesized that mutated KRAS could increase 18F-FDG accumulation under hypoxic conditions by activating glycolysis via upregulation of HIF-1α.
To evaluate the effects of hypoxia on 18F-FDG accumulation in vivo, we conducted an immunohistochemical analysis of the xenograft tumors to investigate the expression of proteins known to be involved in 18F-FDG accumulation (Fig. 4C). Hypoxic regions within these tumors were detected by pimonidazole, a marker of hypoxia, and each lesion analyzed was located at a distance of about 100–200 μm from CD34-positive tumor vessels. Importantly, we found that the distribution of GLUT1-positive areas was similar to that of HIF-1α–positive areas and that of pimonidazole-positive areas in both HCT116 and HKe-3 tumors, although these signal intensities from each protein were much higher in HCT116 tumors than in HKe-3 tumors. In addition, we used double immunofluorescence staining and found that HIF-1α–positive CRC cells were positive for GLUT1 (Supplemental Fig. 3B), suggesting that HIF-1α–positive cells were identical to GLUT1-positive cells. On the other hand, HK2 staining did not correlate with either HIF-1α or pimonidazole staining. We also quantified the intratumoral vessel density in these tumors and found that there was no significant difference between HCT116 and HKe-3 tumors (13.9 ± 2.3/field in HCT116 vs. 13.2 ± 1.4/field in HKe-3, P = 0.603, Supplemental Fig. 3C). These data indicated that CRC tumors with mutated KRAS had higher in vivo 18F-FDG accumulation than did those with wild-type KRAS and that hypoxia within tumors also affected 18F-FDG accumulation at least partially through HIF-1α.
In Vitro 18F-FDG Accumulation into CRC Cell Lines Under Hypoxic Conditions
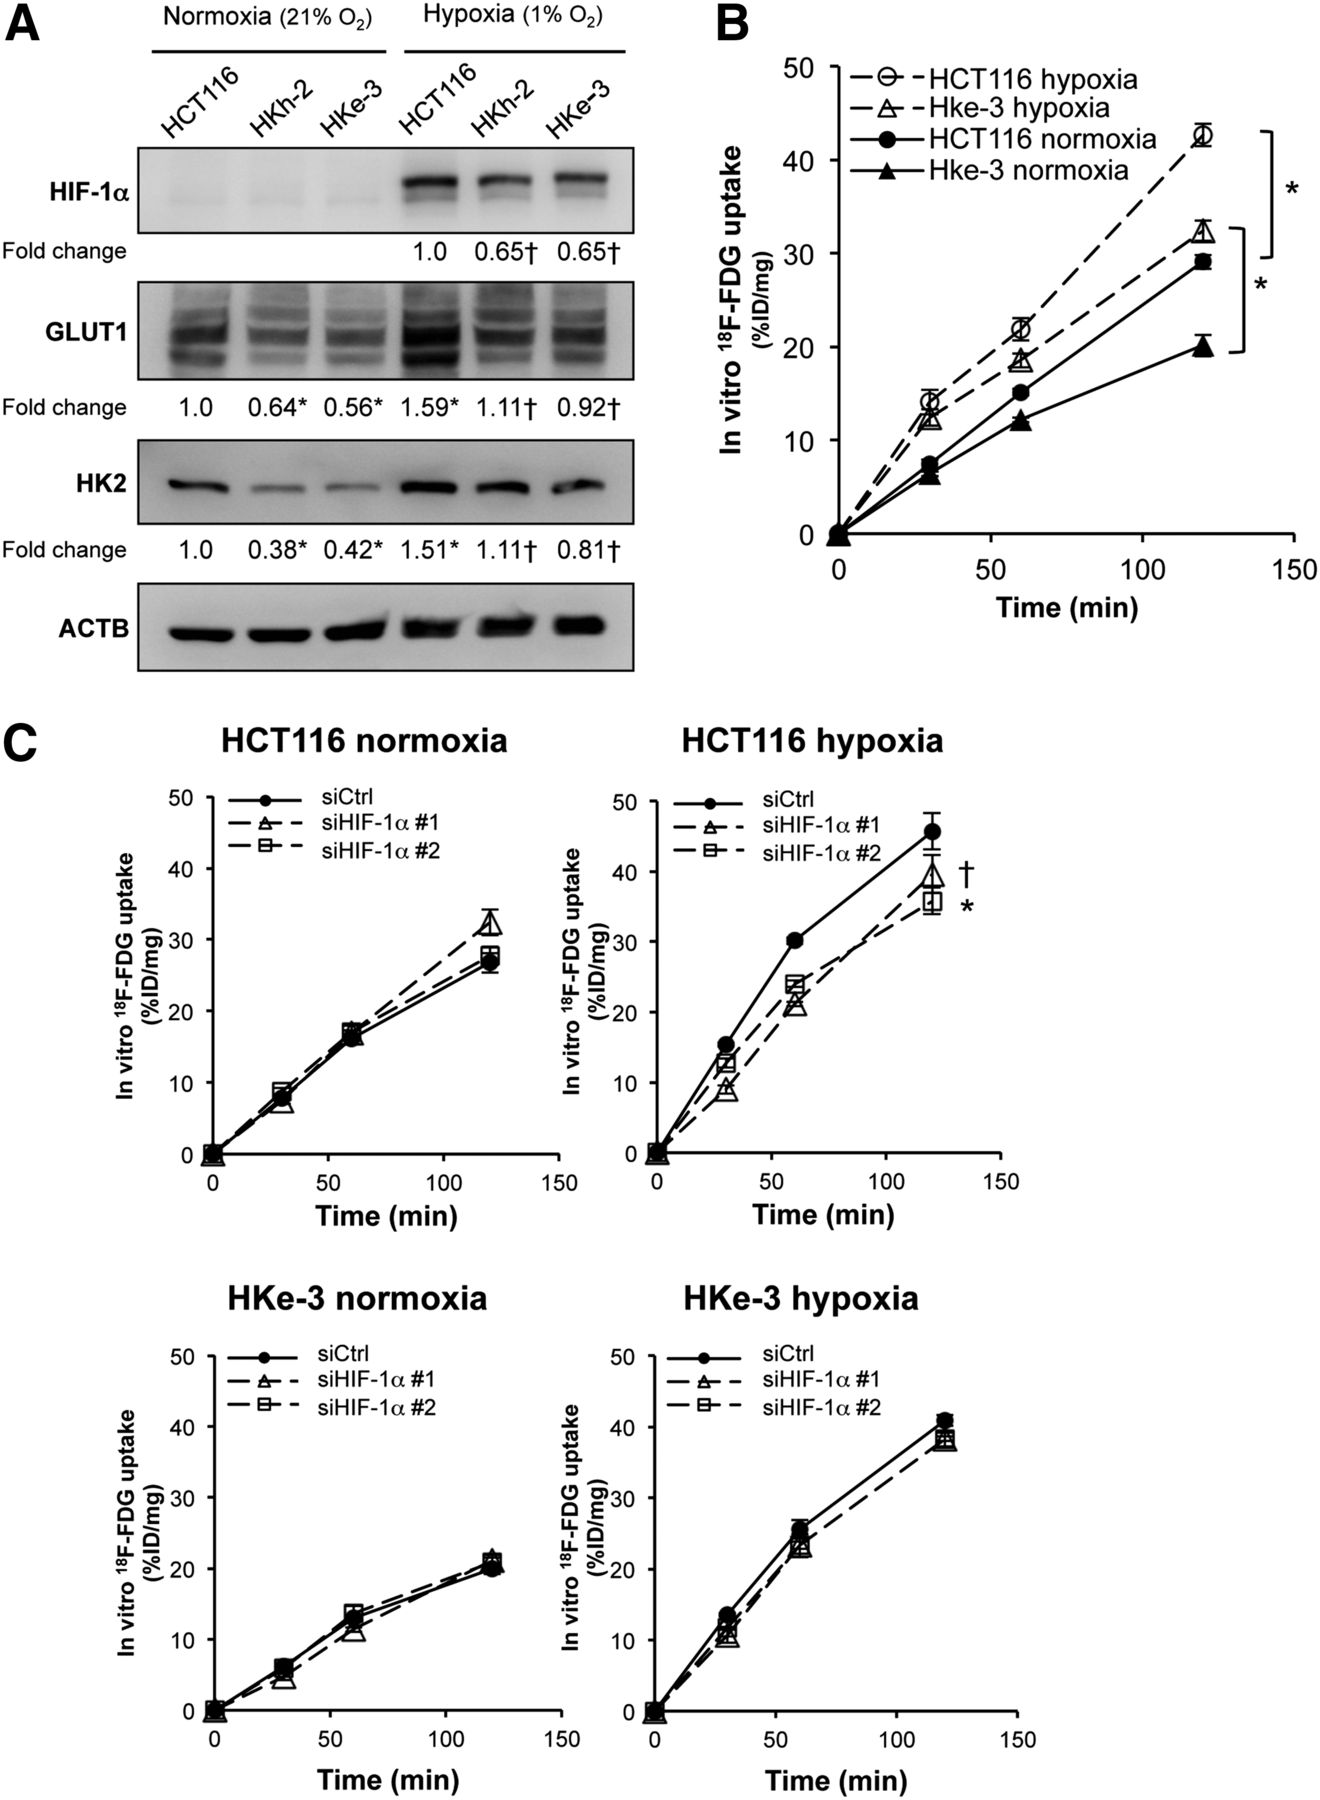
To further address whether mutated KRAS affects the hypoxic induction of HIF-1α, we evaluated HIF-1α expression in CRC cell lines under either normoxic or hypoxic conditions by Western blotting (Fig. 5A). Although HIF-1α protein was barely detected under normoxic conditions because of its rapid O2-dependent degradation, hypoxic induction of HIF-1α protein was significantly higher in HCT116 cells than in their KRAS wild-type counterparts, HKh-2 and HKe-3 cells. We also observed that the expression of GLUT1 and HK2 was enhanced under hypoxic conditions for both the KRAS mutant parental line (HCT116) and the KRAS wild-type counterparts (HKe-3 and HKh-2). We next measured 18F-FDG accumulation in vitro in HCT116 and HKe-3 cells under either normoxic or hypoxic conditions. In both HCT116 and HKe-3 cells, 18F-FDG accumulation was about 1.5-fold higher under hypoxic conditions than under normoxic conditions (Fig. 5B). To determine whether the hypoxia-induced increase in 18F-FDG accumulation was HIF-1α–dependent, we knocked down HIF-1α expression by siRNA and then measured 18F-FDG accumulation in these cells under either normoxic or hypoxic conditions. In hypoxic HCT116 cells, knockdown of HIF-1α resulted in a significantly decreased expression of GLUT1 (Supplemental Fig. 4A) and a significantly decreased 18F-FDG accumulation (Fig. 5C, upper right panel). On the other hand, in hypoxic HKe-3 cells, knockdown of HIF-1α resulted in a small decrease in expression of GLUT1 (Supplemental Fig. 4B) and a barely decreased 18F-FDG accumulation (Fig. 5C, lower right panel). In normoxic HCT116 and Hke-3 cells, neither 18F-FDG accumulation nor GLUT1 expression was affected by knockdown of HIF-1α (Fig. 5C, left, and Supplemental Figs. 4A and 4B). To test whether this effect of siHIF-1α was specific, we transiently transfected the HIF-1α expression vector into HCT116 cells treated with siHIF-1α that was targeting the 3′ untranslated region of the HIF-1α sequence and noted that the decrease in 18F-FDG accumulation was partially recovered in hypoxic HCT116 cells (Supplemental Fig. 5). The HIF-1α protein level was not completely recovered by the transient transfection approach, which may explain why the recovery of 18F-FDG accumulation was not statistically significant (P = 0.115). These data indicated that, under hypoxic conditions, CRC cells with mutated KRAS increased 18F-FDG accumulation, partially depending on the HIF-1α pathway, whereas the enhanced uptake of 18F-FDG by hypoxic CRC cells with wild-type KRAS was independent of the HIF-1α pathway.

In vitro 18F-FDG accumulation under hypoxic conditions. (A) Western blot analysis showing protein expression of HIF-1α, GLUT1, and HK2 under normoxic and hypoxic cultures. Protein levels were normalized to β-actin, and densitometry values are expressed as fold change compared with HCT116 in normoxia (*P < 0.01 vs. HCT116 in normoxia, †P < 0.01 vs. HCT116 in hypoxia). (B) In vitro 18F-FDG accumulation in HCT116 and HKe-3 cells under normoxic and hypoxic cultures. (C) In vitro 18F-FDG accumulation under normoxic and hypoxic culture in HCT116 and HKe-3 cells. These cells were treated with 2 independent siRNA constructs targeting HIF-1α (siHIF-1α #1 and siHIF-1α #2). Results are presented as mean ± SD of triplicate measurements (*P < 0.01, †P < 0.05). Ctrl = control.
Immunohistochemical Analysis of Clinical CRC Samples
To evaluate the clinical significance of the above findings, we immunohistochemically examined human CRC samples. We previously examined 51 clinical CRC samples and found that 18F-FDG accumulation is significantly higher in CRCs with KRAS/BRAF mutations than in those with wild-type KRAS/BRAF (10). In this study, we further examined the relationship between KRAS mutational status and HIF-1α expression with these same 51 clinical samples (Table 1). Each patient was classified on the basis of KRAS mutational status into two groups: patients with wild-type KRAS (n = 29) and those with mutated KRAS (n = 22). HIF-1α expression was positive in 19 (37%) of 51 tumors. Importantly, HIF-1α expression was positive in 12 (55%) of 22 tumors with mutated KRAS, whereas it was positive in only 7 (24%) of 29 tumors with wild-type KRAS, indicating a significant association between KRAS mutational status and HIF-1α expression (P = 0.026; Table 1). In these 51 samples, KRAS mutational status was also significantly correlated with maximum standardized uptake value and with GLUT1 expression but not with HK2 expression (Table 1). Representative cases of mutated and wild-type KRAS are shown in Supplemental Figures 6A and 6B. These data indicated that an increase in 18F-FDG accumulation observed by 18F-FDG PET scans might reflect activation of glucose metabolism by mutated KRAS and by tumor hypoxia. Taken together, these results highlight a unique interaction between KRAS and tumor microenvironment (e.g., hypoxia) and may potentially contribute to the phenotypic differences in KRAS mutation in CRC.
Relationship Between KRAS Mutational Status and Expression of GLUT1, HK2, HIF-1α, and 18F-FDG Accumulation
DISCUSSION
18F-FDG PET scans are widely used to diagnose, monitor treatment response, and assess prognosis for many types of cancer. However, the underlying molecular mechanisms responsible for 18F-FDG accumulation in cancer cells are not yet clear. It was previously reported that, under normoxic conditions, the increase in GLUT1 expression and glucose uptake in vitro is critically dependent on the KRAS mutation in CRC cells and follicular thyroid cancer cells (14,16). Using human clinical samples, we previously found that KRAS/BRAF mutations significantly increase 18F-FDG accumulation in CRCs possibly through upregulation of GLUT1 expression (10). In this study, we found that mutated KRAS increased 18F-FDG accumulation in CRC cells mainly through upregulation of GLUT1 under normoxic conditions (Figs. 1–3). We also suppose that HK2 is partially involved in 18F-FDG accumulation of KRAS-mutant CRCs (Figs. 1–3). HK2 was recently reported to be required for tumor initiation and maintenance in KRAS-driven lung cancer (17), suggesting the role of HK2 in KRAS-mutant CRCs. Under hypoxic conditions, induction of HIF-1α protein was more prominent in HCT116 cells than in HKe-3 cells, which additively increase 18F-FDG accumulation (Figs. 5A and 5B), and knockdown of HIF-1α in hypoxia resulted in significantly decreased 18F-FDG accumulation in HCT116 cells (Fig. 5C, top right), demonstrating a synergistic interaction between KRAS mutation and hypoxia. Meanwhile, knockdown of HIF-1α did not result in decreased 18F-FDG accumulation in HKe-3 cells under hypoxic conditions (Fig. 5C, bottom right), potentially indicating that CRC cells with wild-type KRAS increase 18F-FDG accumulation independently of HIF-1α. By an immunohistochemical analysis of xenografts and surgical specimens, we also observed that the staining pattern of HIF-1α was in accordance with that of GLUT1 (Fig. 4C) and that KRAS mutational status correlated with HIF-1α and GLUT1 expression (Table 1). Taken together, these data demonstrate that increased 18F-FDG accumulation in cancer cells as determined by PET imaging may reflect increased glucose metabolism that is dependent on KRAS mutation and enhanced by tumor hypoxia.
Somatic point mutations in the KRAS gene occur in a variety of human malignancies, most frequently in pancreatic cancer, non–small cell lung cancer, and CRC. Moreover, KRAS mutation is a strong predictor of clinical resistance to EGFR-targeted therapies; therefore, KRAS mutational testing derived from primary tumors has been incorporated into the routine clinical treatment of metastatic CRC. Although screening for KRAS mutation has a high negative predictive value for response to EGFR-targeted therapies against metastatic CRC, its positive predictive value is low and most KRAS wild-type patients do not derive benefit. Potential reasons to explain this phenomenon are the intratumoral heterogeneity of KRAS alleles within individual primary CRCs (18) and the discordant KRAS status between primary tumor and corresponding metastases (19,20). It has also been reported that the intratumoral heterogeneity within a primary CRC can explain the discordant KRAS status between primary and metastatic CRC tumors (21). In addition, mutational testing requires tumor tissue samples resected by biopsy or surgery, but samples from metastatic tumors are uncommon because of the difficulty of accessing them and low tumor content secondary to treatment effect. Our findings provide a basis by which 18F-FDG PET/CT scans can be considered predictive of the macroscopic KRAS mutational status of the whole tumor, which may inform the therapeutic strategy.
The Warburg effect is considered to be a metabolic hallmark of cancer cells and has been exploited clinically for detection of tumors by 18F-FDG PET scans. The molecular mechanisms causing upregulation of glucose metabolism are as yet not understood, but KRAS signaling has been recently reported to be implicated in the regulation of aerobic glycolysis in several types of cancer. For example, in a mouse model of pancreatic adenocarcinoma, mutated KRAS enhanced glycolysis through upregulation of glucose transporter and several glycolytic enzymes and then diverted glycolytic intermediates into hexosamine biosynthesis and pentose phosphate pathways to maintain tumor growth (22). Notably, knockdown of the rate-limiting enzymes in either hexosamine biosynthesis or pentose phosphate pathways suppressed tumor growth, suggesting potential metabolic targets for therapeutic benefit. By metabolomic analysis with HCT116, HKe-3, DLD-1, and DKO-4 cells, we have also observed that mutated KRAS caused a significant metabolic change involving multiple pathways; the most significant are intermediates of glucose metabolism, including glucose 6-phosphate, glyceraldehyde 3-phosphate, and 3-phosphoglyceric acid (Supplemental Table 1). Functional validation of several mutated KRAS-regulated metabolic enzymes may provide candidate therapeutic targets and associated biomarkers. 18F-FDG PET/CT scans directly assess glycolytic tumor phenotype and thus might predict the efficacy of glycolytic inhibitors for CRC patients with mutated KRAS who do not respond to anti-EGFR therapies and for whom alternative therapeutic strategies are needed. Thus, this study suggests the possibility of the novel use of 18F-FDG PET/CT scans for determining therapeutic strategies against CRC.
CONCLUSION
To our knowledge, this is the first study in which both in vitro and in vivo animal experiments have shown that mutated KRAS plays a role in 18F-FDG accumulation. CRC cells with mutated KRAS increased 18F-FDG accumulation by up-regulating GLUT1 and, at least partially, by up-regulating HIF-1α induction under hypoxia. We confirmed a significant association between KRAS mutational status and expression of GLUT1 and HIF-1α, as well as maximum standardized uptake value, in 51 clinical CRC samples. Collectively, these findings highlight that 18F-FDG PET/CT scans might be predictive of KRAS mutation, which leads to the novel possibility that 18F-FDG PET/CT scans might be used to determine therapeutic strategies in cases of CRC.
DISCLOSURE
The costs of publication of this article were defrayed in part by the payment of page charges. Therefore, and solely to indicate this fact, this article is hereby marked “advertisement” in accordance with 18 USC section 1734. This work was supported by grants from the Ministry of Education, Culture, Sports, Science, and Technology of Japan and by a Shimadzu Science Foundation research grant. No other potential conflict of interest relevant to this article was reported.
Footnotes
Published online Nov. 5, 2014.
- © 2014 by the Society of Nuclear Medicine and Molecular Imaging, Inc.
REFERENCES
- Received for publication May 7, 2014.
- Accepted for publication September 30, 2014.


Jump to section
Related Articles
Cited By...
- First-in-Humans PET Imaging of KRASG12C Mutation Status in Non-Small Cell Lung and Colorectal Cancer Patients Using [18F]PFPMD
- Functional Genetic Screening Enables Theranostic Molecular Imaging in Cancer
- Dual Inhibition of GLUT1 and the ATR/CHK1 Kinase Axis Displays Synergistic Cytotoxicity in KRAS-Mutant Cancer Cells
- Single-cell functional and chemosensitive profiling of combinatorial colorectal therapy in zebrafish xenografts
- Maltotriose Conjugation to a Chlorin Derivative Enhances the Antitumor Effects of Photodynamic Therapy in Peritoneal Dissemination of Pancreatic Cancer
- A Continuously Infused Microfluidic Radioassay System for the Characterization of Cellular Pharmacokinetics
- Relationship Between 18F-FDG PET/CT Scans and KRAS Mutations in Metastatic Colorectal Cancer