


Abstract
In recent years, there has been a growing interest in molecular imaging markers of tumor-induced angiogenesis. Several radiolabeled RGD (arginine, glycine, aspartate) peptides have been developed for PET imaging of αvβ3 integrins in the tumor vasculature, but there are only limited data on how angiogenesis inhibitors affect the tumor uptake of these peptides. Methods: Changes in 68Ga-NODAGA-c(RGDfK) peptide uptake were measured using PET during bevacizumab therapy of 2 αvβ3-negative squamous cell carcinoma cell lines (A-431 and FaDu) that induce αvβ3-positive neovasculature when transplanted into nude mice. Tumor uptake of 68Ga-NODAGA-c(RGDfK) was correlated to microvascular density, vascular morphology, and permeability as well as αvβ3 integrin expression. Results: Bevacizumab significantly inhibited growth of A-431 tumors and caused a significant reduction in microvascular density and αvβ3 integrin expression within 7 d after start of therapy. Bevacizumab also caused a normalization of blood vessel morphology and decreased tumor necrosis. However, 68Ga-NODAGA-c(RGDfK) uptake was significantly increased at day 7 of therapy and did not decrease until after 3 wk of treatment. In Fadu xenografts, bevacizumab therapy caused only a minor inhibition of tumor growth and minor changes in 68Ga-NODAGA-c(RGDfK) uptake. Conclusion: Uptake of radiolabeled RGD peptides is not necessarily decreased by effective antiangiogenic therapy. Early in the course of therapy a decrease in the expression of αvβ3 integrins may not be reflected by a decrease in the uptake of RGD peptides.
Angiogenesis has long been recognized to play a critical role in tumor growth and progression (1,2). On the basis of extensive preclinical and clinical studies, a variety of angiogenesis inhibitors are now used in the clinic. However, it has also become apparent that not all patients benefit from treatment with a specific antiangiogenic drug and that some tumors may become resistant to therapy (3). In the era of precision medicine, one of the most pressing challenges facing the field of antiangiogenic therapy is therefore to find predictive biomarkers to select the patients who will most likely benefit from a specific angiogenesis inhibitor, to monitor tumor response, and to detect emerging resistance (4).
Histopathologic methods for evaluating tumor angiogenesis in biopsies including microvascular density (MVD) can be misleading because of tumor heterogeneity. Imaging techniques including MR imaging and PET can overcome these problems by noninvasive sensitive and quantitative real-time imaging of biomarker expression in the entire tumor (4,5). Although MR imaging and ultrasound imaging measure functional effects of antiangiogenic therapy, mainly decrease in perfusion and blood vessel permeability, PET has the potential to characterize angiogenesis on a molecular level, based on the expression and functional activity of proteins (4,5).
The specific strength of PET is its high sensitivity for imaging biomarkers expressed during angiogenesis. Currently, vascular endothelial growth factor (VEGF), VEGF receptors, CD105 (endoglin), and αvβ3 integrins are being investigated as targets for direct molecular imaging of tumor angiogenesis with PET (5–7).
The αvβ3 integrin, an adhesion molecule involved in tumor angiogenesis and invasion, is a well-characterized molecular marker of activated endothelial cells (8–10). Several peptide PET tracers that contain the RGD (arginine, glycine, aspartate) binding motif have been developed for imaging αvβ3 expression in tumors, and some of them are undergoing clinical trials (11). Still, there is only a limited number of publications on the use of RGD tracers for monitoring antiangiogenic therapy (12), and to our knowledge no data are available on monitoring bevacizumab (Roche) therapy.
In this study, we monitored bevacizumab treatment of 2 squamous cell carcinoma xenografts using invasive histologic techniques and noninvasive molecular imaging with PET and 68Ga-NODAGA-c(RGDfK), to determine whether αvβ3 integrin imaging can be used to monitor tumor angiogenesis.
MATERIALS AND METHODS
Cell Lines
A-431 human epidermoid carcinoma, FaDu human hypopharyngeal squamous cell carcinoma (not expressing αvβ3), and U-87 MG human glioma (αvβ3 positive) cell lines were purchased from American Type Culture Collection. Huvec, primary human endothelial cells, were obtained from Lonza. Cells were maintained as recommended by the manufacturers (supplemental methods [available at http://jnm.snmjournals.org]). Expression of αvβ3 integrin in cell lines was confirmed using flow cytometry and Western blot analysis as well as 68Ga-NODAGA-c(RGDfK) uptake analysis (supplemental methods).
Radiolabeling Procedures
68Ga-NODAGA-c(RGDfK) labeling has been described previously (13). 68Ga-DOTA was prepared by incubating 25 μg of DOTA (Chematec) in 1 mL of ammonium acetate buffer (0.2 mol/L, pH 4.0) with purified 68Ga (300–400 MBq) for 5 min at 95°C. Quality control was performed by thin-layer chromatography (supplemental methods). The radiochemical purities of 68Ga-DOTA and 68Ga-NODAGA-c(RGDfK) were 96% and 99%, respectively.
Animal Models
Animal experiments were conducted according to the regulations of the University Medical Center of Freiburg. A total of 4 × 10⁶ A-431 cells or 5 × 10⁶ Fadu cells were injected subcutaneously into the right shoulder of female BALB/c nude mice (age, 6–8 wk; weight, 18–20 g) purchased from Janvier. When tumor size reached 100 mm3, mice were randomized to receive bevacizumab (20 mg/kg) or saline intravenously on days 1, 4, 11, and 18. PET/CT imaging was performed on days 0, 7, 14, and 21. Tumor sizes were measured using calipers. Tumor volume (mm3) was determined using the formula 0.5 × length × width2. All control animals had to be sacrificed before day 21 because tumors had reached the maximum size allowed by the study protocol.
PET/CT Imaging and Biodistribution Studies
At 1 h after injection of 3–12 MBq (0.6 nmol) of 68Ga-NODAGA-c(RGDfK), static PET scans were acquired using a microPET Focus 120 scanner (Siemens Preclinical Solutions) for 20 min, followed by a 2-min CT scan on Micro-CT-Tomoscope Synergy (CT Imaging GmbH). Animals were anesthetized with 1.5% isoflurane and kept warm with a temperature-controlled heating system during the entire imaging procedure. For 68Ga-DOTA, 20-min dynamic PET scans were acquired in list-mode starting with the intravenous injection of 4–12 MBq.
PET images were reconstructed using an ordered-subset expectation maximization algorithm provided by the manufacturer and calibrated to activity concentrations using standard techniques. Tumor radiotracer uptake was quantified by standardized uptake values as described in supplemental methods.
Biodistribution of 68Ga-NODAGA-c(RGDfK) was studied in control mice and bevacizumab-treated animals on day 7 at 1 h after injection of 3–12 MBq (0.6 nmol) of the tracer as described previously (13). The results were expressed in percentage injected activity per gram of tissue. For blocking, 600 nmol of cold c(RGDfK) was injected 5 min before the radiolabeled peptide.
Histology
Tumors from controls and from treated animals were excised and frozen on dry ice. Sections (7 μm) were cut using a Leica CM1950 cryomicrotom, fixed with acetone, and stored at (−20C). For conventional histologic examination, tissue sections were stained with hematoxylin and eosin. A necrotic index was calculated as the ratio of necrotic area to total tumor area (3–6 tumors per treatment group).
To determine MVD, tumor sections were stained with rat antibodies against mouse CD31 (BD Pharmingen). The areas with highest vascular density were selected, and vessels were counted in 4 high power fields (magnification, ×400; area, 0.19 mm2). Vessel diameters (μm) were measured using a measuring ocular (UIS 2; Olympus), at ×400 magnification in 10 fields.
The expression of human αvβ3 integrin was assessed with the mouse antibodies against human αvβ3 integrin (LM609; Millipore) using a M.O.M. immunodetection kit (Vector Laboratories) and AEC substrate kit for peroxidase (Vector Laboratories). The expression of mouse αvβ3 integrin on tumor blood vessels was assessed using rabbit antibodies reacting with mouse and human integrin β3 subunit (Abcam), followed by secondary antibodies conjugated to Alexa Fluor 568 (Molecular Probes). Total β3 integrin–positive area was quantified in 6 regions of the staining, using ZEN pro 2012 imaging analysis software (Zeiss) and automatic threshold definition (Otsu). The results are expressed as a percentage of total area. Hypoxia was evaluated using rabbit antibodies against human carbonic anhydrase 9 (Novus Biologicals), followed by secondary antibodies conjugated to Alexa Fluor 568. Blood vessels were visualized with rat anti–CD-31 antibodies, followed by secondary antibodies conjugated to Alexa Fluor 488 (Molecular Probes). Images were acquired with the epifluorescent microscope Axio Observer.D1 from Zeiss, which was equipped with AxioCam, MRm, and AxioCam ICc1 digital cameras.
Statistical Analysis
The data are presented as mean ± SD. Statistical analysis was performed using a 2-tailed unpaired Student t test. A P value of 0.05 or less was considered significant.
RESULTS
Characterization of Cell Lines
A-431 and FaDu cells showed no αvβ3 integrin expression in flow cytometry and Western blots and low uptake of 68Ga-NODAGA-c(RGDfK). In contrast, 68Ga-NODAGA-c(RGDfK) was specifically bound by HUVEC cells (Supplemental Fig. 1).
Inhibition of A-431 Tumor Growth, Reduction of MVD, and Normalization of Tumor Vasculature by Bevacizumab
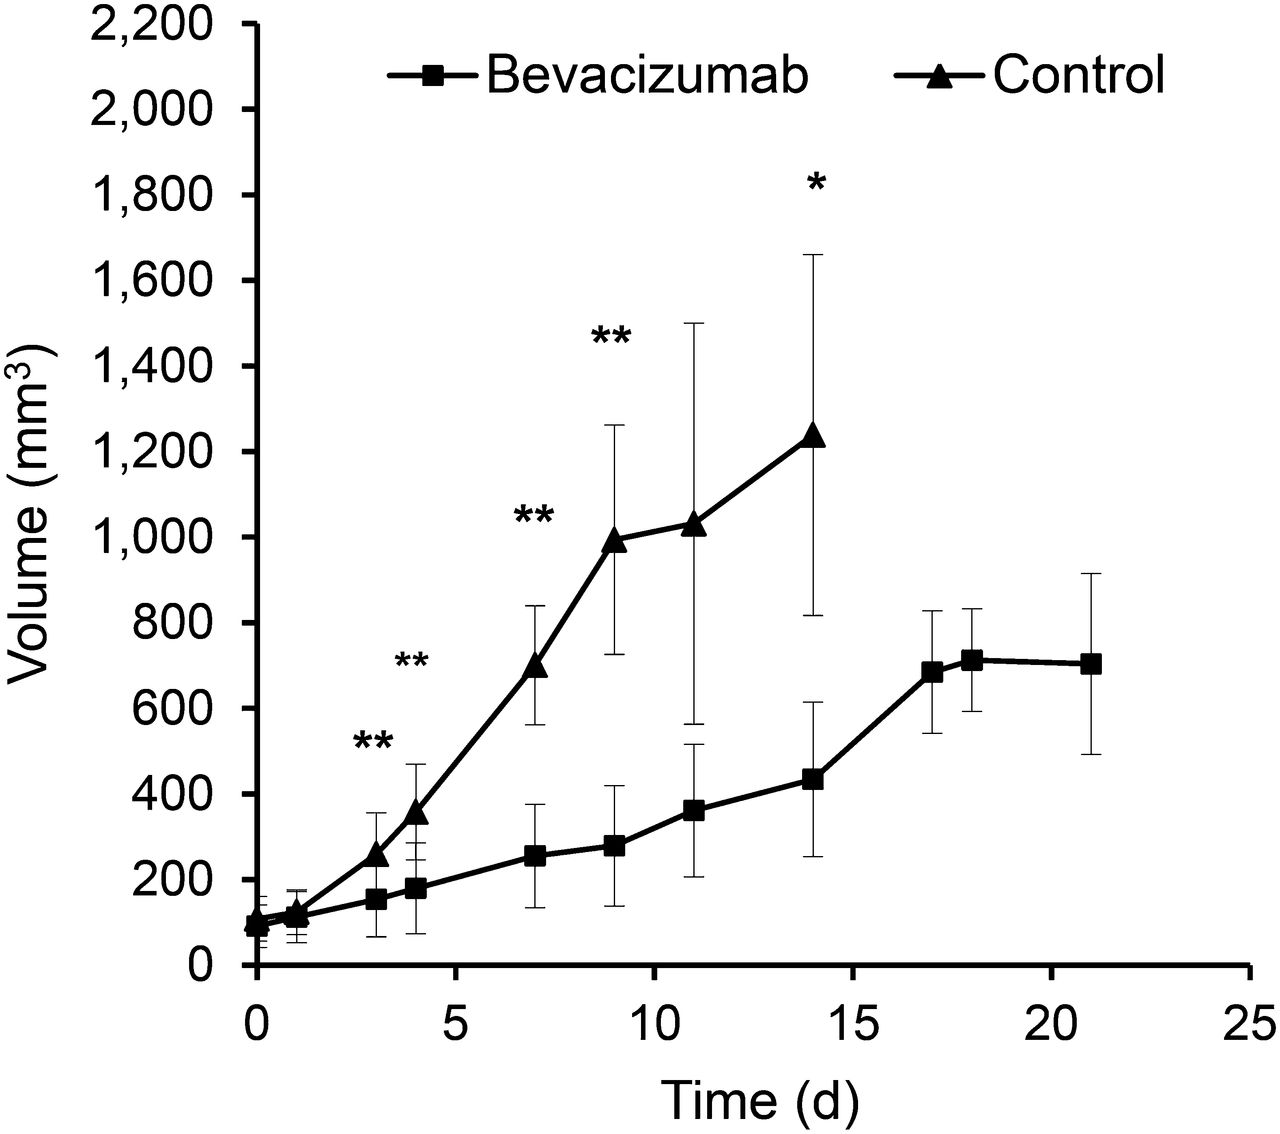
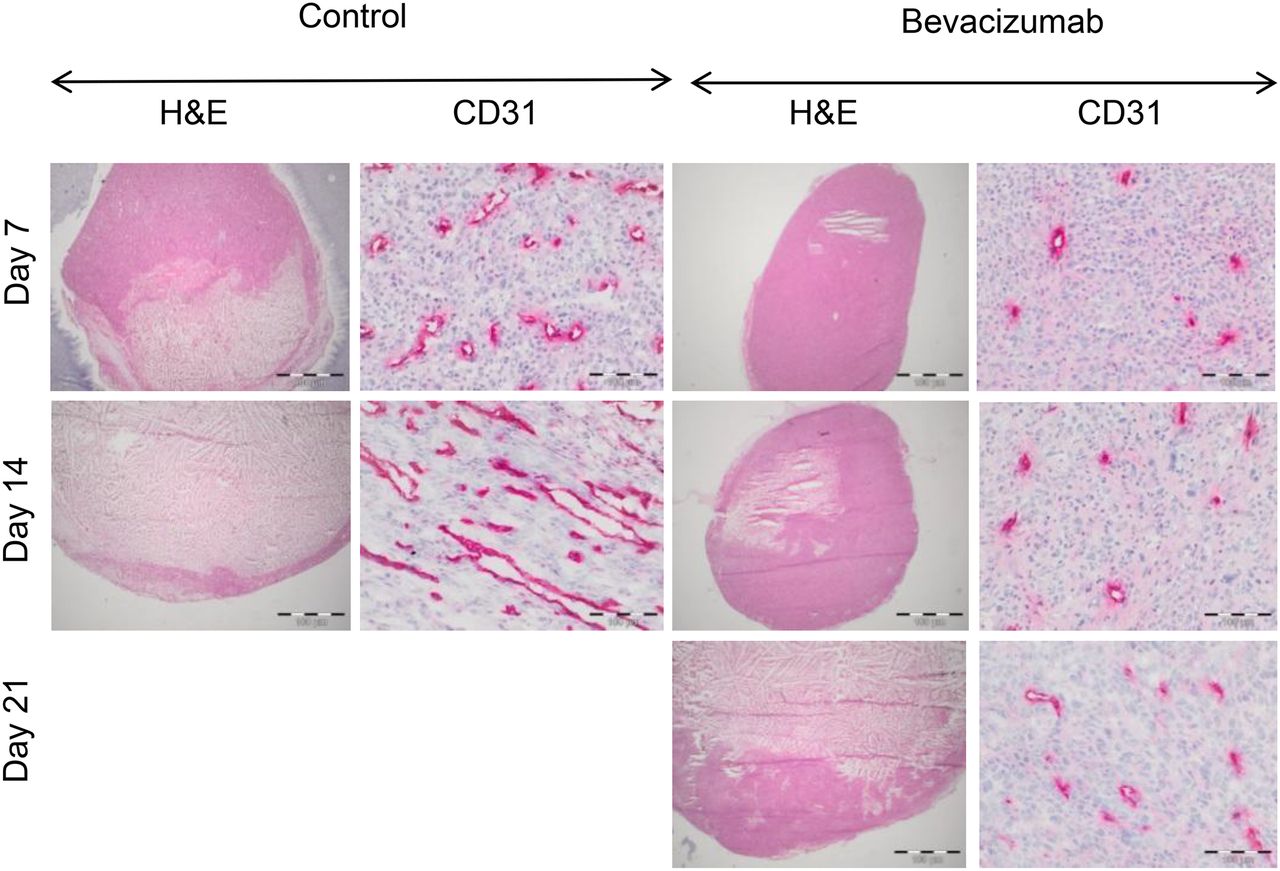
Bevacizumab significantly inhibited the growth of A-431 xenografts when compared with controls (P < 0.01 on days 7 and 14), but in week 3 bevacizumab-treated tumors started to regrow (Fig. 1). Macroscopically, bevacizumab-treated tumors were much paler than control tumors (Supplemental Fig. 2), suggesting decreased intratumoral blood volume. This observation was confirmed by histologic analysis, which demonstrated a significantly decreased MVD and vessel diameters on days 7 and 14 (Fig. 2; Table 1). Blood vessels in the treated tumors were more evenly distributed and regularly shaped, compared with more dilated and irregularly shaped blood vessels in control tumors (Fig. 2). However, on day 21, the vessel diameter was no longer significantly different from control tumors at day 14.

Bevacizumab treatment inhibits growth of A-431 tumors. Growth curves of control and bevacizumab-treated A-431 tumors during 3 wk of treatment. *P < 0.01 and **P < 0.05 for treated vs. control tumors.

Therapy with bevacizumab reduces MVD and normalizes tumor vessel morphology in A-431 tumors. Representative images of A-431 tumor sections from control and bevacizumab-treated animals on days 7, 14, and 21, stained with hematoxylin and eosin (H&E) and CD31 antibodies (magnification, ×200). Bevacizumab-treated tumors demonstrate marked decrease in microvessel density.
Quantitative Histologic Evaluation of A-431 Tumors During Bevacizumab Treatment
Bevacizumab Delays Onset of Necrosis and Modulates Hypoxia in A-431 Tumors
Hematoxylin and eosin staining showed that nearly half of the control tumor area was already necrotic on day 7, whereas tumors treated with bevacizumab were almost entirely viable (Fig. 2; Table 1). At the end of the second week, the necrotic area increased in treated and control tumors, but the necrotic index was still significantly smaller for bevacizumab-treated tumors than for controls (Table 1). On day 21, the necrotic index of bevacizumab-treated tumors was similar to the necrotic index of control tumors at day 14 (Table 1). On day 7, carbonic anhydrase 9 staining was similar in bevacizumab-treated and control tumors, despite decreased vessel density in treated tumors (Supplemental Fig. 3). Hypoxic area became more confluent in the bevacizumab-treated tumors on day 14, thereby contributing to increased central necrosis on day 21 (Supplemental Fig. 3; Fig. 2).
Functional Changes of Tumor Vasculature in Response to Bevacizumab
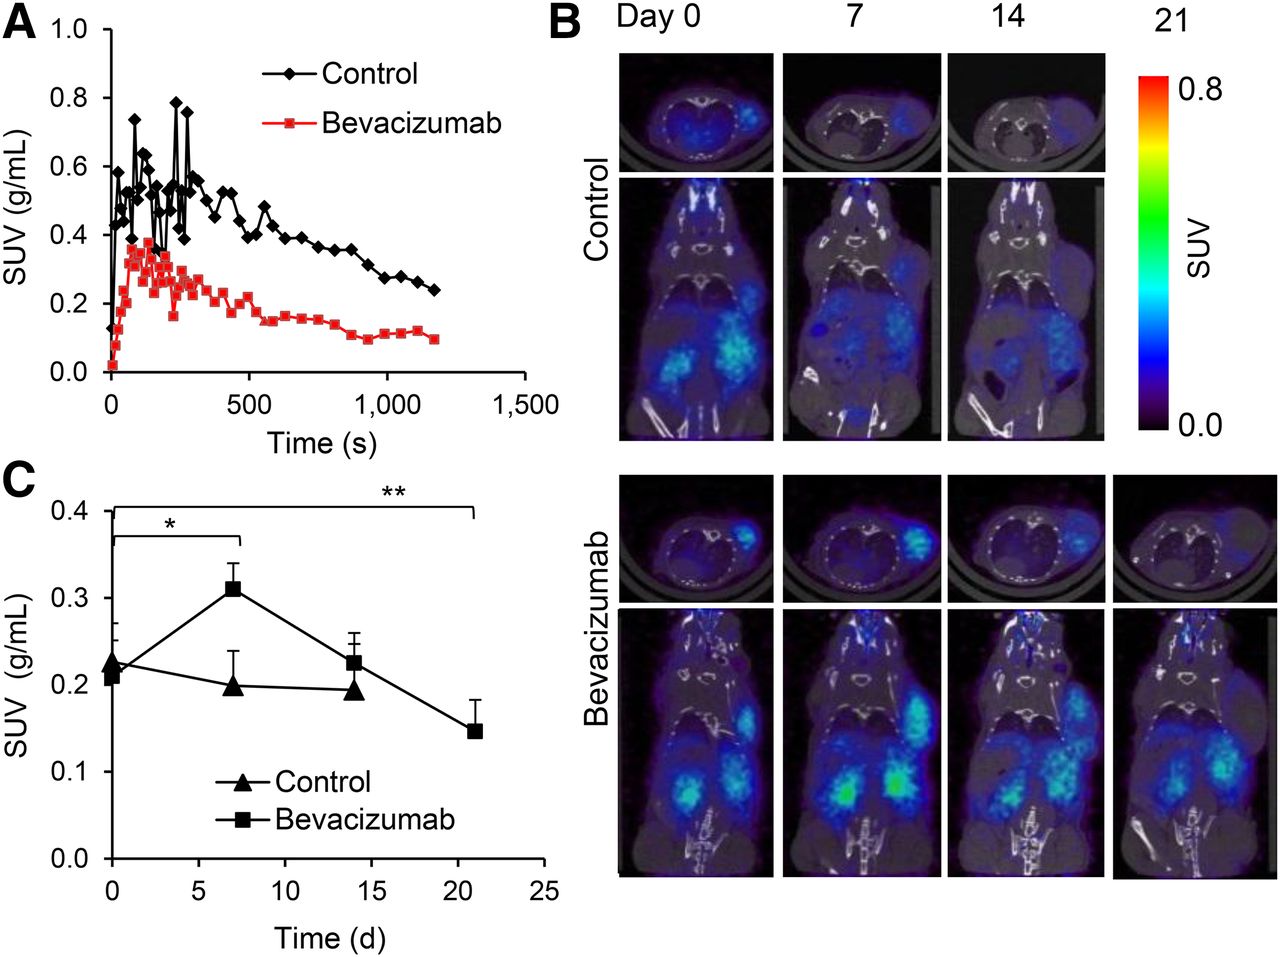
To study the functional changes in tumor vasculature, we imaged mice with the extravascular contrast agent 68Ga-DOTA. Time–activity curves demonstrate that peak uptake was lower for bevacizumab-treated tumors than for controls (Fig. 3A). The area under the time–activity curve was 1.68-fold lower for bevacizumab-treated tumors than control tumors (P < 0.05). These differences were not due to changes in the systemic distribution of the radiotracer because the blood time–activity concentration was not affected by bevacizumab therapy (Supplemental Fig. 4).

PET imaging revealed reduced permeability for 68Ga-DOTA and transient increase in 68Ga-NODAGA-c(RGDfK) uptake in bevacizumab-treated A-431 tumors. (A) Representative tumor time–activity curves (0–20 min) for 68Ga-DOTA in control and bevacizumab-treated A-431 tumors on day 7 after start of treatment. (B) Transversal (top) and coronal (bottom) small-animal PET/CT images of 68Ga-NODAGA-c(RGDfK) uptake acquired from same control and bevacizumab-treated animal on days 0, 7, 14, and 21. (C) 68Ga-NODAGA-c(RGDfK) tumor uptake in controls and bevacizumab-treated animals at various time points after start of therapy. Experiment was repeated twice with similar results. *P < 0.005. ** P < 0.05. SUV = standardized uptake value.
68Ga-NODAGA-c(RGDfK) Uptake in A-431 Xenografts During Treatment with Bevacizumab
Before treatment, tumors showed homogeneous binding of 68Ga-NODAGA-c(RGDfK) throughout, but on days 7 and 14 the tracer was binding only to the periphery of control tumors (Fig. 3B). In contrast, homogeneous tracer uptake was found in all bevacizumab-treated tumors on day 7 and in most tumors on day 14. On day 21 only, we observed decreased tracer uptake in the center of tumors.
Quantitative analysis (Fig. 3C) showed that mean uptake of 68Ga-NODAGA-c(RGDfK) before treatment was similar in control and treated tumors. In controls accumulation of 68Ga-NODAGA-c(RGDfK) showed no significant changes over time (Fig. 3C). In contrast, uptake of 68Ga-NODAGA-c(RGDfK) increased 1.5-fold in bevacizumab-treated animals on day 7 (P = 0.002). At this point, tumor uptake was 1.6-fold higher than in controls (P = 0.004). On day 14, tumor uptake of 68Ga-NODAGA-c(RGDfK) decreased to pretreatment levels, which was followed by a further decline on day 21 (P = 0.04 for comparison with baseline uptake).
Biodistribution studies confirmed that bevacizumab treatment induced a significant increase in tumor uptake of 68Ga-NODAGA-c(RGDfK) on day 7 (Supplemental Table 1).
More than 90% of this increase in 68Ga-NODAGA-c(RGDfK) was blocked by preinjection of an excess of unlabeled RDG peptide, proving that the increase was specific (Supplemental Table 1).
Effect of Bevacizumab on Tumor Growth, MVD, and 68Ga-NODAGA-c(RGDfK) Uptake in FaDu Tumors
The growth curves of FaDu tumors (Fig. 4A) demonstrate that bevacizumab treatment was not inhibiting tumor growth. There were no significant differences between bevacizumab-treated tumors and controls at any time point.

Bevacizumab treatment of FaDu tumors. (A) Growth curves of controls and bevacizumab-treated FaDu tumors. (B) Transversal (top) and coronal (bottom) small-animal PET/CT images of bevacizumab-treated and control animal at various time points. (C) Tumor uptake of 68Ga-NODAGA-c(RGDfK) uptake in control (n = 6) and bevacizumab-treated (n = 5) animals. *P < 0.05. SUV = standardized uptake value.
On histologic evaluation (Supplemental Fig. 5; Table 2), MVD in treated tumors was significantly reduced on days 7 and 14 (Table 2). However, vascular morphology was not normalized, and vessel diameters in bevacizumab-treated FaDu tumors were not significantly different from controls until day 14. In contrast to A-431 xenografts, bevacizumab treatment did not affect tumor necrosis (Table 2).
Quantitative Histologic Evaluation of FaDu Tumors During Bevacizumab Treatment
Before treatment, 68Ga-NODAGA-c(RGDfK) uptake in control and treated Fadu xenografts was similar (Figs. 4B and 4C). After 7 d of treatment, 68Ga-NODAGA-c(RGDfK) uptake was significantly decreased (P < 0.05) in both controls and treated tumors. After 2 wk of bevacizumab treatment, controls and treated FaDu tumors showed a slight increase in uptake, compared with baseline values (Fig. 4C). There was no significant difference between treated tumors and controls at any point in time studied.
Expression of αvβ3 Integrins by Tumor Blood Vessels in A-431 and FaDu Xenografts
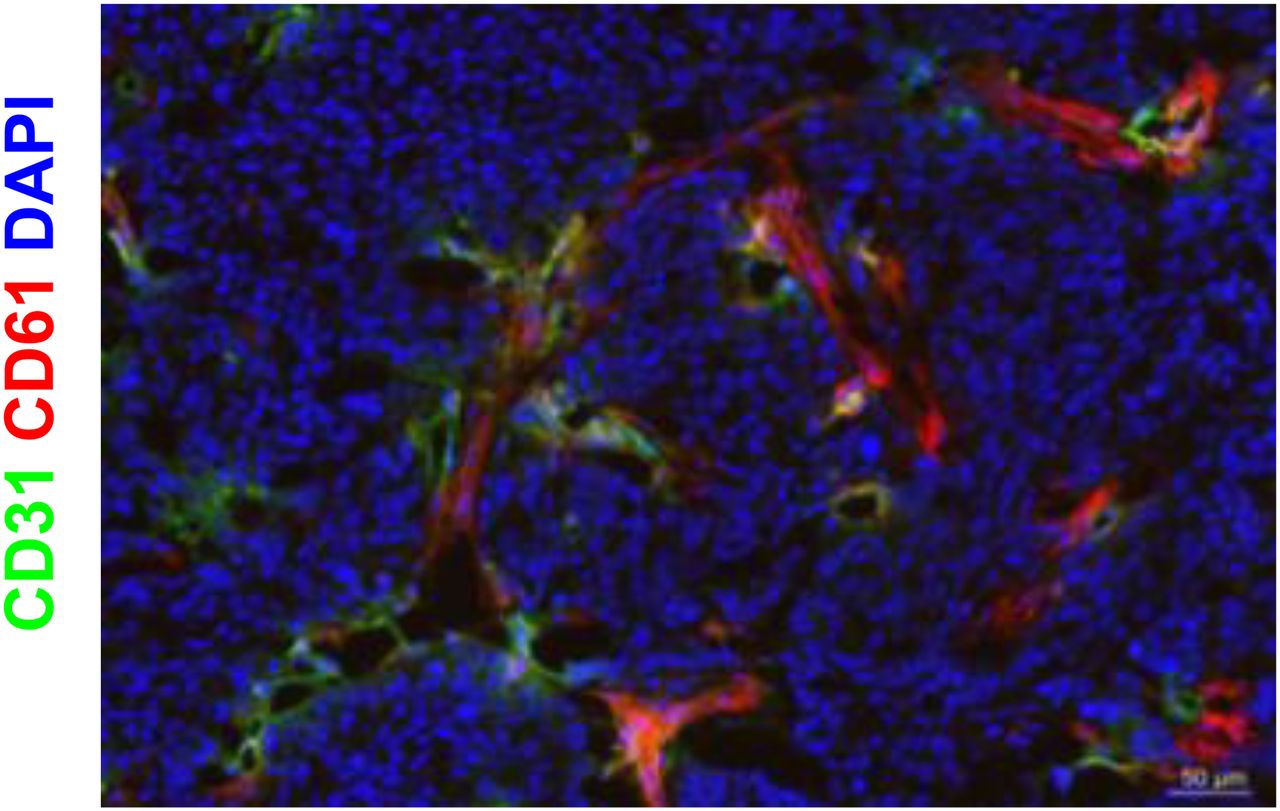
Supplemental Figure 6 shows that A-431 xenografts did not stain positive for human αvβ3 integrins before or after bevacizumab therapy. Because blood vessels in A-431 xenografts originate from mouse vasculature, an antibody recognizing the mouse and human integrin subunit β3 was used to visualize the expression of αvβ3 integrin on tumor blood vessels (we are not aware of antibody binding to the mouse αvβ3 integrin complex). Figure 5 shows that many of the CD31-positive blood vessels in A-431 xenografts were also positive for integrin β3, whereas the tumor cells were negative. Quantification of β3 integrin–positive area by immunofluorescence revealed significantly lower β3 integrin levels in treated tumors than in controls on days 7 and 14 (P < 0.005, Table 3).
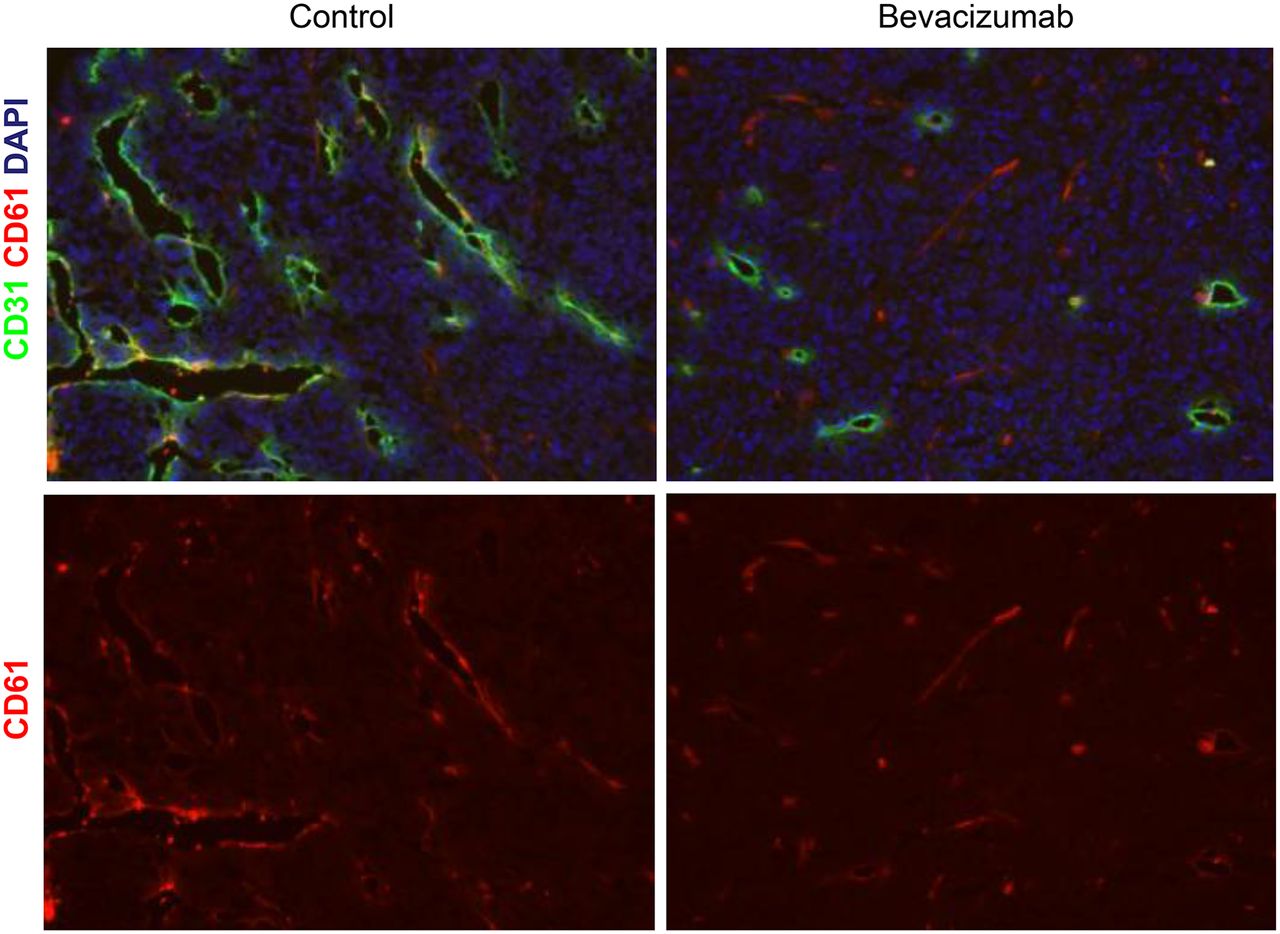
αvβ3 integrin expression on blood vessels of control and bevacizumab-treated A-431 tumors. Immunofluorescence staining of control and bevacizumab-treated A-431 tumors with anti-β3 (red) and anti-CD31 (green) antibodies. Nuclei were counterstained with 4′,6-diamidino-2-phenylindole (DAPI) (blue). Images were acquired at ×200 magnification. αvβ3 integrins are expressed by endothelial cells but not by tumor cells. Number of αvβ3-positive blood vessels is decreased with bevacizumab therapy.
Quantification of Integrin β3–Positive Areas in A-431 and FaDu Tumors
Fadu tumor cells were also negative for β3, whereas intratumoral blood vessels were positive for the mouse β3 integrin subunit (Fig. 6). Quantitative analysis revealed that the β3 integrin–positive areas on days 7 and 14 were not significantly different between treated tumors and controls (Table 3).

αvβ3 integrin expression in FaDu tumors. Immunofluorescence staining of control and bevacizumab-treated FaDu tumors with anti-β3 (red) and anti-CD31 (green) antibodies. Nuclei were counterstained with 4′,6-diamidino-2-phenylindole (DAPI) (blue). Images were acquired at ×200 magnification. αvβ3 integrins are expressed by endothelial cells but not by tumor cells.
DISCUSSION
This study aimed to explore the potential of αvβ3 integrin as a biomarker for noninvasive monitoring of antiangiogenic therapy with bevacizumab using PET. For our studies, we selected 2 squamous cell carcinoma cells lines (A-431 and FaDu) because preclinical (14) and clinical studies (15) have shown that squamous cell carcinomas only rarely express αvβ3 integrin on tumor cells, whereas the intratumoral blood vessels are αvβ3-positive. We realize that antiangiogenic therapy is more commonly used in other tumor types such as glioblastoma and breast cancer. However, in these malignancies αvβ3 integrins are frequently expressed on the surface of endothelial cells and related tumor cells (16,17). Therefore, it is challenging to monitor antiangiogenic therapies in these tumor types with RGD peptides. Bevacizumab therapy has recently been shown to improve survival of patients with metastatic squamous cell carcinoma of the cervix in randomized phase III trials (18). For head and neck squamous cell carcinoma, phase II studies have shown promising data for the addition of bevacizumab to chemotherapy and chemoradiotherapy (19,20). Hence, the use of bevacizumab for therapy of squamous cell carcinomas is likely to increase in the future.
In A-431 xenografts, bevacizumab inhibited tumor growth and angiogenesis as demonstrated by a decrease of vascular permeability and MVD. There was also a decrease in the density of αvβ3-positive blood vessels as early as 7 d after start of the treatment. Unexpectedly, however, 68Ga-NODAGA-c(RGDfK) tumor uptake did not show changes similar to MVD and αvβ3 expression. In fact, tumor uptake of 68Ga-NODAGA-c(RGDfK) was even increased on day 7 of therapy and did not decrease until day 21. This temporary increase in tumor uptake of 68Ga-NODAGA-c(RGDfK) was confirmed by biodistribution studies and was specific because more than 90% of it was blocked by the preinjection of unlabeled RGD peptide.
There are 2 potential mechanisms that could explain this paradoxical increase in uptake of labeled RGD peptide. First, the ligand binding affinity of αvβ3 integrins is not constant but modulated by a process called inside-out signaling. Integrins can be in 2 states: a low-affinity, nonactivated state and a high-affinity, activated state (21). This phenomenon is one of the underlying mechanisms for the adhesion of platelets and leukocytes after activation by factors released from injured tissue. Thus, uptake of RGD peptides is not necessarily correlated with the expression levels of αvβ3 integrins. For example, a previous study has shown that treatment with dasatinib can almost completely inhibit binding of RGD peptides without affecting the expression of αvβ3 integrins (22). So the increased uptake of RGD peptides may reflect increased activation and higher ligand binding affinity during bevacizumab therapy.
Second, vascular normalization induced by VEGF-directed therapies decreases MVD and extravasation of contrast agents but at the same time increases perfusion and delivery of chemotherapeutic agents and imaging probes. This phenomenon is believed to be a consequence of a less chaotic blood flow and a decrease of interstitial pressure in treated tumors (23). Specifically, Chatterjee et al. (24) have recently shown that treatment with 2 different VEGF receptor–targeting therapies steadily increases the perfusion of tumor xenografts (assessed by 15O water PET) until day 8 of therapy. On day 8, tumor perfusion was 34% higher than at baseline. At the same time, extravasation of a fluorescent contrast agent was decreased by more than 80%, and there was marked reduction of CD31-positive microvessels. On day 8, there was also an increase in tumor uptake of 18F-fluorothymidine despite the fact that the treated tumors were not proliferating faster than the control tumors. Thus, the temporary increase in uptake of RGD peptides observed in our study could be caused by better delivery of the radiotracer. Importantly, uptake of 68Ga-DOTA is influenced by perfusion, vascular permeability, and extracellular volume. Therefore, the modest decrease in 68Ga-DOTA uptake should not be interpreted to indicate a decrease in tumor perfusion.
Consistent with the hypothesis of vascular normalization, central necrosis in bevacizumab-treated A-431 tumors was delayed. However, normalization was a transient event as described previously (23,24). Continued bevacizumab therapy led to increased tumor necrosis after 3 wk of treatment, which likely explains the decrease in RGD peptide uptake from day 7 to 21.
In the FaDu tumor model, bevacizumab had no significant effect on tumor growth. Also, no significant difference in the density of αvβ3-positive blood vessels between bevacizumab-treated animals and controls was observed. Consistent with this limited efficacy of bevacizumab in the FaDu model, there were no significant differences between controls and bevacizumab-treated tumors with respect to uptake of RGD peptides. The mild, temporary decrease in tumor uptake of 68Ga-NODAGA-c(RGDfK) in controls and treated animals is probably caused by spontaneous tumor necrosis because we observed a high rate of spontaneous necrosis (necrotic fraction of more than 50% in untreated tumors). Unlike in the A431 model, bevacizumab did not delay tumor necrosis in the FaDu model, suggesting that bevacizumab did not cause functional normalization of the tumor vasculature. All these observations point to a limited effect of bevacizumab on FaDu xenografts.
Although the unexpected temporary increase in RGD peptide uptake during bevacizumab therapy may complicate early assessment of tumor response by PET, RGD peptide uptake decreased later in the course of therapy. Thus, PET with RGD peptides may nevertheless be useful for monitoring bevacizumab therapy in the clinic.
To our knowledge, this study is the first to describe changes in accumulation of αvβ3 integrin–specific PET tracer during treatment with bevacizumab. Some publications have reported use of αvβ3 integrin PET imaging to follow up on antiangiogenesis therapies with tyrosine kinase inhibitors. In 1 study, αvβ3-positive MDA-MB-435 xenografts were treated with multikinase inhibitor ZD4190, and the decrease in 18F-FPPRGD2 (dimeric RGD tracer) uptake was observed after 1 and 3 d of treatment. However MVD was not determined in this study (25). Another group imaged αvβ3-positive U-87 MG xenografts with 18F-fluciclatide RGD-based tracer and found that treatment with sunitinib reduced tumor accumulation of 18F-fluciclatide between days 2 and 14 (12). However, MVD was not determined until the end of the treatment, which did not allow the authors to make correlations between MVD and tracer uptake at different time points. The normalization of tumor blood vessels, which can occur at different times when angiogenesis is inhibited by bevacizumab versus multikinase inhibitors, was not assessed in any of the studies. Furthermore, U-87 MG tumor cells strongly express αvβ3 integrin at the cell surface. Therefore, it is not clear whether the change observed in the PET signals is due to a decreased expression by the tumor cells or the tumor vasculature.
CONCLUSION
Our findings indicate that several factors such as vascular normalization and tumor necrosis can modulate uptake of RGD peptides during treatment with bevacizumab. Consequently, tumor uptake of RGD peptides does not necessarily reflect changes of αvβ3 expression by intratumoral blood vessels early in the course of therapy. Systematic clinical studies are required to determine a suitable time point for assessment of tumor response with radiolabeled RGD peptides.
DISCLOSURE
The costs of publication of this article were defrayed in part by the payment of page charges. Therefore, and solely to indicate this fact, this article is hereby marked “advertisement” in accordance with 18 USC section 1734. This work was supported by the German Research Foundation (DFG), German Cancer Consortium (DKTK) and grants SFB850 (project Z1) and SFB850 (project Z2). No other potential conflict of interest relevant to this article was reported.
Acknowledgments
We thank Roswitha Toennesmann, Yvonne Kiefer, and Nicola Bittermann for excellent technical assistance, Dr. Ingrid Bartsh for flow cytometry measurments, and Dr. Mark Daniel Bartholomä for optimization of 68Ga-DOTA labeling.
Footnotes
Published online Oct. 2, 2014.
- © 2014 by the Society of Nuclear Medicine and Molecular Imaging, Inc.
REFERENCES
- Received for publication January 22, 2014.
- Accepted for publication July 31, 2014.


Jump to section
Related Articles
Cited By...
- 68Ga-DOTA-E[c(RGDfK)]2 PET Imaging of SHARPIN-Regulated Integrin Activity in Mice
- Response Assessment of 68Ga-DOTA-E-[c(RGDfK)]2 PET/CT in Lung Adenocarcinoma Patients Treated with Nintedanib Plus Docetaxel
- Approaches to Improve the Pharmacokinetics of Radiolabeled Glucagon-Like Peptide-1 Receptor Ligands Using Antagonistic Tracers
- RGD PET: From Lesion Detection to Therapy Response Monitoring