


Abstract
Motor symptoms in Parkinson disease (PD) are caused by a loss of dopamine input from the substantia nigra to the striatum. Blockade of adenosine 2A (A2A) receptors facilitates dopamine D2 receptor function. In phase 2 clinical trials, A2A antagonists (istradefylline, preladenant, and tozadenant) improved motor function in PD. We developed a new A2A PET radiotracer, 18F-MNI-444, and used it to investigate the relationship between plasma levels and A2A occupancy by preladenant and tozadenant in nonhuman primates (NHP). Methods: A series of 20 PET experiments was conducted in 5 adult rhesus macaques. PET data were analyzed with both plasma-input (Logan graphical analysis) and reference-region–based (simplified reference tissue model and noninvasive Logan graphical analysis) methods. Whole-body PET images were acquired for radiation dosimetry estimates. Human pharmacokinetic parameters for tozadenant and preladenant were used to predict A2A occupancy in humans, based on median effective concentration (EC50) values estimated from the NHP PET measurements. Results: 18F-MNI-444 regional uptake was consistent with A2A receptor distribution in the brain. Selectivity was demonstrated by dose-dependent blocking by tozadenant and preladenant. The specific-to-nonspecific ratio was superior to that of other A2A PET radiotracers. Pharmacokinetic modeling predicted that tozadenant and preladenant may have different profiles of A2A receptor occupancy in humans. Conclusion: 18F-MNI-444 appears to be a better PET radiotracer for A2A imaging than currently available radiotracers. Assuming that EC50 in humans is similar to that in NHP, it appears that tozadenant will provide a more sustained A2A receptor occupancy than preladenant in humans at clinically tested doses.
Parkinson disease (PD) has a prevalence of 1.6% in individuals over the age of 65 y (1) and a lifetime risk of 6.7% from age 45 to 100 y (2). Motor symptoms, which include tremor, bradykinesia, and rigidity, emerge when there is a loss of more than 50% of dopamine neurons in the substantia nigra (SN) (3,4). Loss of these neurons reduces dopamine input to the striatum, where dopamine binds to both D1 and D2 receptors. Most striatal D1 receptors are localized in the so-called direct pathway, whereas most striatal D2 receptors are localized in medium spiny neurons that project to the globus pallidus pars externa (indirect pathway). Adenosine signals via 4 different G-protein–coupled receptors: A1, A2A, A2B, and A3 (5). A2A receptors are predominantly expressed in striatum, with lower levels present in cortex and thalamus and even lower in cerebellum (5–9). A2A receptors may play a role in inflammation (10) and could therefore be important in a variety of neurologic diseases, including multiple sclerosis, in which A2A receptor density is increased (11). In PD, A2A receptors may be important because they form heterodimers with D2 receptors in the striatum (5,12), and agonists of A2A (e.g., adenosine) reduce the affinity of D2 for dopamine (13). Therefore, antagonism of A2A receptors will facilitate D2 transmission, which should be beneficial in PD. Three A2A antagonists have been tested in PD: istradefylline, preladenant, and tozadenant. All 3 showed efficacy on motor symptoms in phase II trials (14–16); however, istradefylline was not approved in Europe or the United States because of mixed results in phase III trials. Recently, approval was granted in Japan (17). More recently, preladenant failed to demonstrate efficacy in phase III trials.
One important use of PET imaging is to quantify receptor occupancy (RO) by a drug. Several PET radiotracers for A2A have been developed and tested (5,6,8,18–20). The best characterized radiotracer, 11C-SCH442416, has a good maximum striatum-to-cerebellum ratio in rodents (∼5.0), but this ratio is lower in primates (∼2.2) (5), thus limiting the dynamic range of the tracer for RO studies. We recently developed a new A2A radiotracer for SPECT imaging for which striatum-to-cerebellum ratios of about 3.0–3.5 were measured in monkey and baboon brain (21). Subsequently, we labeled this molecule with 18F for use as a PET tracer. The objective of this study was to characterize this new A2A PET radiotracer, 18F-MNI-444, in vivo in nonhuman primates, including test–retest, dosimetry, and blocking studies with tozadenant and preladenant. In addition, we decided to perform pharmacokinetic modeling to try to understand whether suboptimal occupancy in humans might explain the lack of efficacy of preladenant in phase III trials.
MATERIALS AND METHODS
Radiochemistry
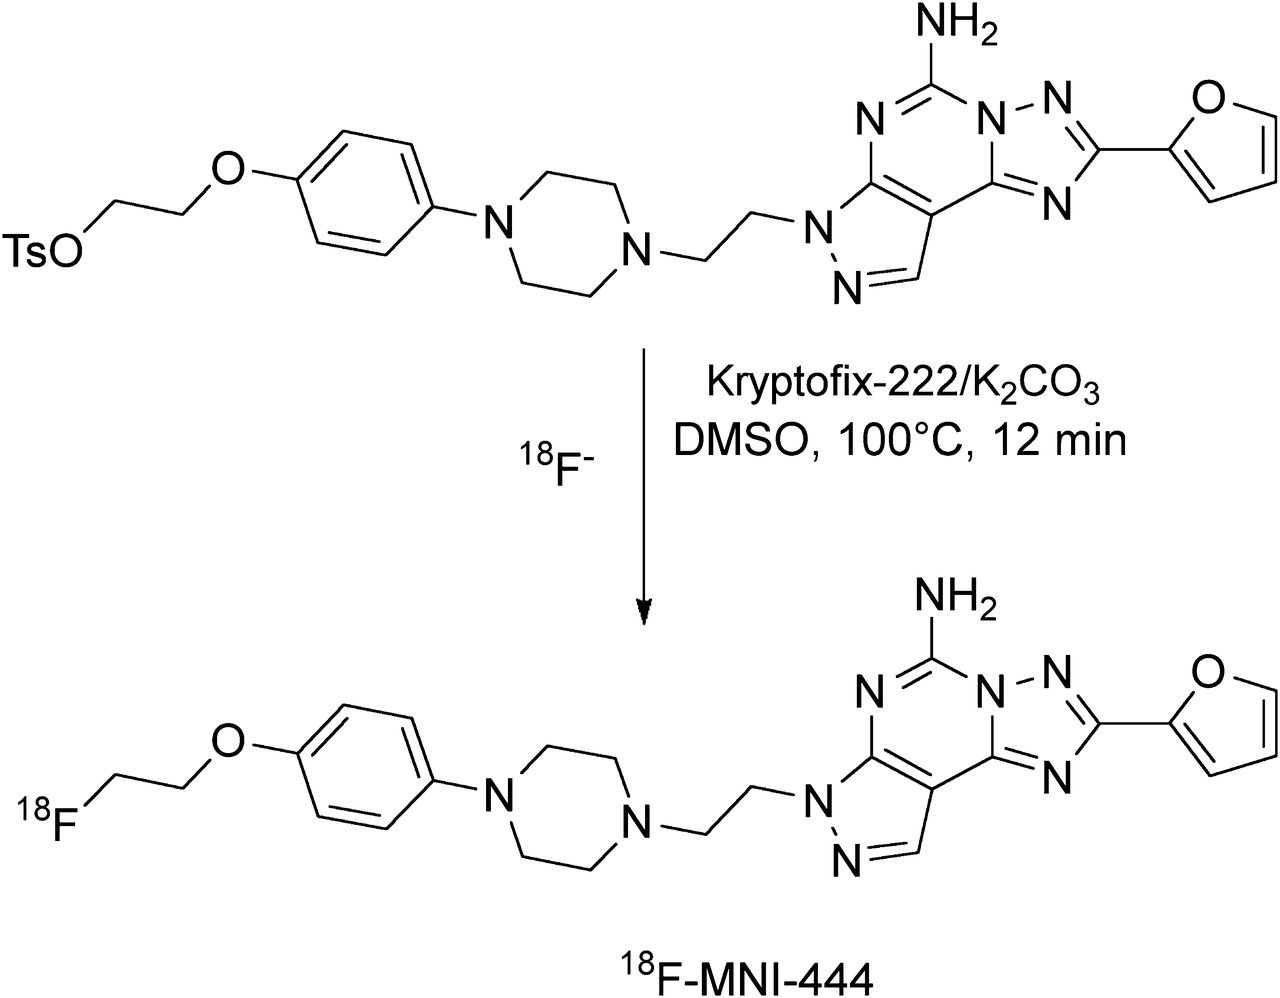
18F-MNI-444 was prepared by reaction of the corresponding tosyl precursor, 2-(4-(4-(2-(5-amino-2-(furan-2-yl)-7H-pyrazolo[4,3-e][1,2,4]triazolo[1,5-c]pyrimidin-7-yl)ethyl)piperazin-1-yl)phenoxy)ethyl-4-methylbenzenesulfonate, with 18F− in anhydrous dimethylsulfoxide in the presence of potassium carbonate and Kryptofix 222 (Merck) at 100°C for 12 min using a commercial synthesizer, TRACERlab FX-FN (GE Healthcare) (Fig. 1). The resulting radiolabeled product was purified by semipreparative high-performance liquid chromatography with an Eclipse XDB C-18 column (5 μm, 10 × 250 mm; Agilent), eluted with a mobile phase of acetonitrile/water/triethylamine (35:65:0.2 v/v/v) at a flow rate of 4 mL/min, and formulated in a physiologic solution containing ethanol, ascorbic acid, and polysorbate-80 in normal saline. Quality control showed radiochemical purity above 99% and a specific activity exceeding 370 GBq/μmol for all the productions (the supplemental data provide details, available at http://jnm.snmjournals.org). The average decay-corrected radiochemical yield was 24.5% ± 5.0% (n = 39) in 60 min.

Radiosynthesis of 18F-MNI-444 from its tosylate precursor. DMSO = dimethyl sulfoxide.
Blocking Agent Preparation
Tozadenant and preladenant are potent, selective, and structurally unrelated A2A antagonists. In vitro, tozadenant has a Ki of 11.5 nM on human A2A and 6 nM on rhesus A2A whereas preladenant has an inhibition constant (Ki) of 1.1 nM on human A2A. Tozadenant was provided by Biotie Therapies Corp. and dissolved in sterile water with 20% Captisol (β-cyclodextrin sulfobutylether sodium; CyDex Pharmaceuticals). Preladenant was synthesized at Molecular NeuroImaging, LLC, and dissolved in normal saline at pH 3.0 with 20% hydroxypropyl-β-cyclodextrin. RO experiments were performed with 6 doses of tozadenant (0.5, 1.3, 1.5, 5.0, 7.5, and 10.5 mg/kg) and 8 doses of preladenant (0.004 in duplicate, 0.010, 0.015 in duplicate, 0.04, 0.2, and 1.0 mg/kg) administered intravenously over 10 min, through the same canula used for the radiotracer administration occurring 20 min later. Plasma samples were taken at several time points during each PET scan to estimate the relationship between RO and plasma exposure.
18F-MNI-444 Brain PET Studies
PET scans (n = 20) were obtained on a Focus 220 microPET camera (Siemens Healthcare Molecular Imaging) in adult rhesus macaques (Macaca mulatta, 2 female and 3 male, 7.8 ± 2.9 kg): 6 baseline studies (2 test–retest studies), 6 preblocking studies with tozadenant, and 8 preblocking studies with preladenant. PET images were acquired during 3 h after intravenous administration of 179.8 ± 9.9 MBq (0.6 ± 0.4 μg) of 18F-MNI-444 over 3 min with an infusion pump. A transmission scan with an external 68Ge source was performed before the emission scans. Images were reconstructed using filtered backprojection with standard corrections for randoms, scatter, and attenuation.
After tracer administration, radial artery blood samples were collected over 3 h. Radioactivity in whole blood and plasma was measured in all samples, and radiometabolites were measured in a subset. Plasma protein binding free fraction (fp) was measured by ultrafiltration. The arterial plasma input function corrected for radiometabolites was used for the PET data analysis (supplemental data).
PET images were analyzed in PMOD, version 3.4 (PMOD Technologies). Initial flowlike PET images (15 min) were averaged and aligned onto the rhesus T1-weighted MR images and the transformation applied to the whole PET series. Volumes of interest, including the caudate, putamen, globus pallidus, nucleus accumbens, cortical regions, and cerebellum, were applied to the PET series to extract the time–activity curves. Curves were expressed in standardized uptake value by normalizing by the injected dose and animal body weight.
Time–activity curves were analyzed with Logan graphical analysis (LGA) (22) with t* set to 60 min to derive the volume of distribution in each region. The nondisplaceable binding potential (BPND) was estimated using the cerebellum as the reference region: BPND = VT/VND – 1, VT and VND being the distribution volumes in the target region and reference region (nondisplaceable uptake), respectively (23). In addition, BPND was directly derived from both the simplified reference tissue model (SRTM) (24) and the noninvasive LGA (NI-LGA) (22) with t* set to 60 min and k2′ set to 0.35 min−1. In vitro autoradiography experiments have shown that the cerebellum has low to negligible A2A receptor density (9), and previous studies with other A2A radiotracers have used the cerebellum for estimation of tissue ratios and BPND (5,8). VT and BPND were obtained using either 180 or 120 min of data. Test–retest reproducibility for VT and BPND was estimated in 2 animals as absolute value(test − retest)/average(test + retest).
The A2A RO produced by tozadenant or preladenant was determined as the percentage change of BPND: Eq. 1The dose-occupancy curves for the striatum (putamen and caudate) were fitted in Prism, version 6.01 (GraphPad Software), with a single specific binding site model:
 Eq. 2where Omax is the maximum occupancy, ED50 the drug dose for 50% occupancy, and D the drug dose. A similar fit was done against the plasma levels to determine the median effective concentration (EC50).
Human Pharmacokinetic Modeling and RO Estimates
Pharmacokinetic data for tozadenant from phase I and II studies were incorporated into a population pharmacokinetic model to predict the median and fifth and 95th percentiles of tozadenant plasma levels achieved with 180 mg twice a day (BID) in humans. For preladenant, pharmacokinetic parameters from a published phase I study (25) were used to predict steady-state plasma levels achieved with 10 mg BID in humans. Differences in plasma free fraction between nonhuman primates (NHPs) and humans were accounted for to estimate the EC50 in humans: Eq. 3The fp of preladenant is 0.03 and 0.01 in NHPs and humans, respectively (UCB Pharma data) (25). The fp of tozadenant is 0.5 and 0.3 in NHPs and humans, respectively (UCB Pharma data). The free-fraction–corrected EC50 in humans was combined with the human pharmacokinetic model to estimate the A2A occupancy achieved with 180 mg BID of tozadenant and 10 mg BID of preladenant.
18F-MNI-444 Whole-Body PET Studies
Two adult rhesus monkeys, 1 male and 1 female, were used for whole-body PET imaging to determine the biodistribution and estimate the absorbed radiation doses of 18F-MNI-444. The supplemental data provide details on the dosimetry methods.
RESULTS
Plasma Analysis
High-performance liquid chromatography analysis of arterial plasma revealed one major radiometabolite that was more polar than the parent compound and a second metabolite eluting just after the first one but whose contribution was less than 3% at any measured time point. Because of the polar nature of both of these metabolites, it is unlikely that either would readily enter the brain.18F-MNI-444 was moderately metabolized, with about 45% and 10%–15% of intact parent remaining at 30 min and 120 min after injection, respectively (Supplemental Fig. 1). Plasma parent fp measured by ultrafiltration was 1.2% ± 0.5% (n = 20).
Brain PET Studies
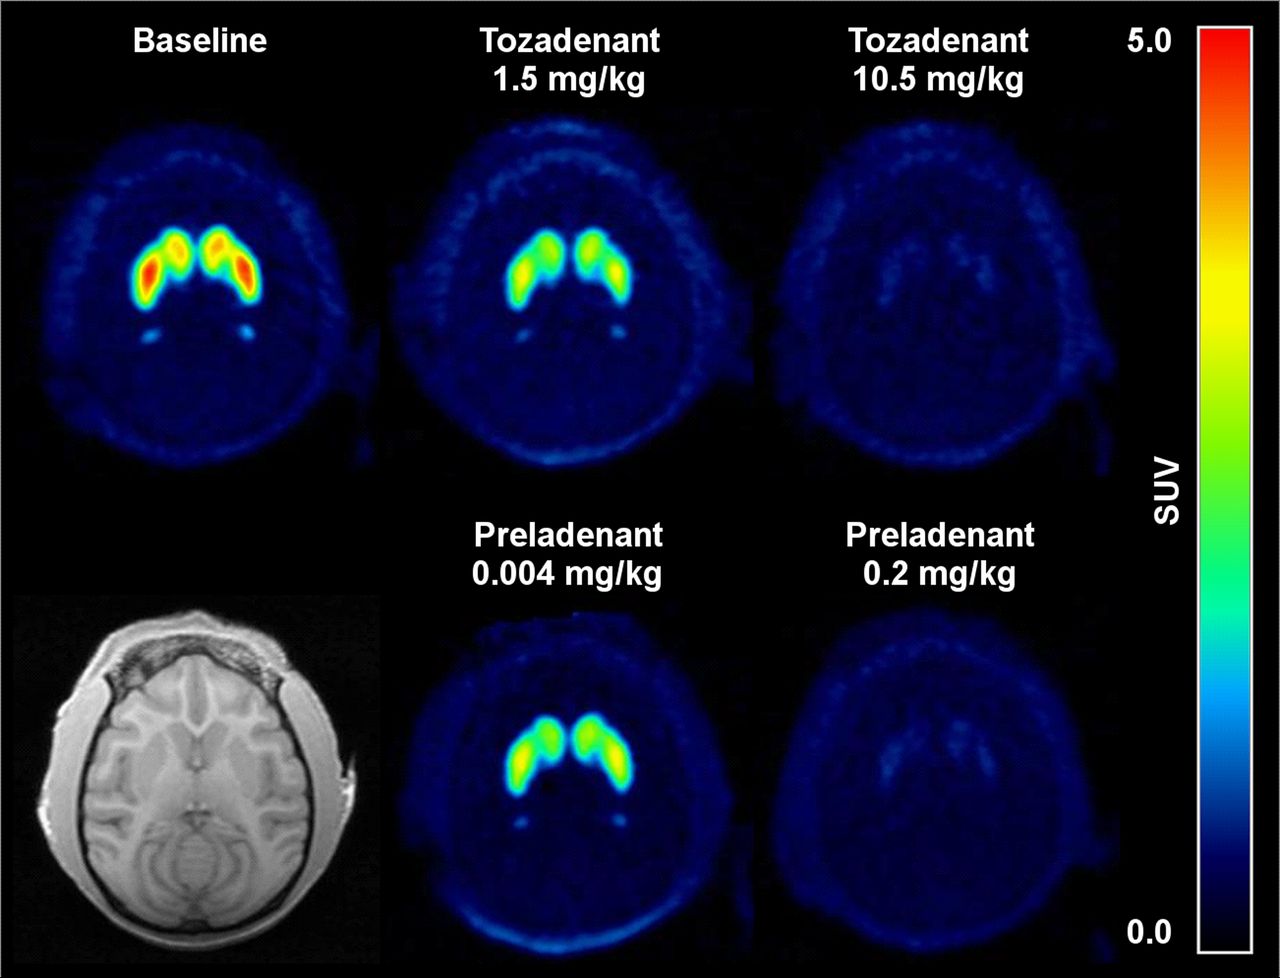
Representative average 18F-MNI-444 PET images showed high uptake in the striatum, consistent with A2A receptor density (Fig. 2) (5,7). 18F-MNI-444 readily entered the brain, with a high peak standardized uptake value (30–60 min after injection) in the putamen, caudate, nucleus accumbens, and globus pallidus (Fig. 3A). In all other brain regions the uptake was lower and had a much faster washout, in particular for the cerebellum, with a peak uptake within 5 min of injection, consistent with much lower A2A receptor density in these regions (5,7). No skull update was observed, suggesting no defluorination of this radiotracer.

Average 18F-MNI-444 PET images over 180 min for rhesus macaque in transverse plane at baseline and after dosing with tozadenant at 1.5 and 10.5 mg/kg (occupancy of 47% and 95%, respectively) or with preladenant at 0.004 and 0.2 mg/kg (occupancy of 32% and 90%, respectively). Monkey individual MR image is also shown. SUV = standardized uptake value.

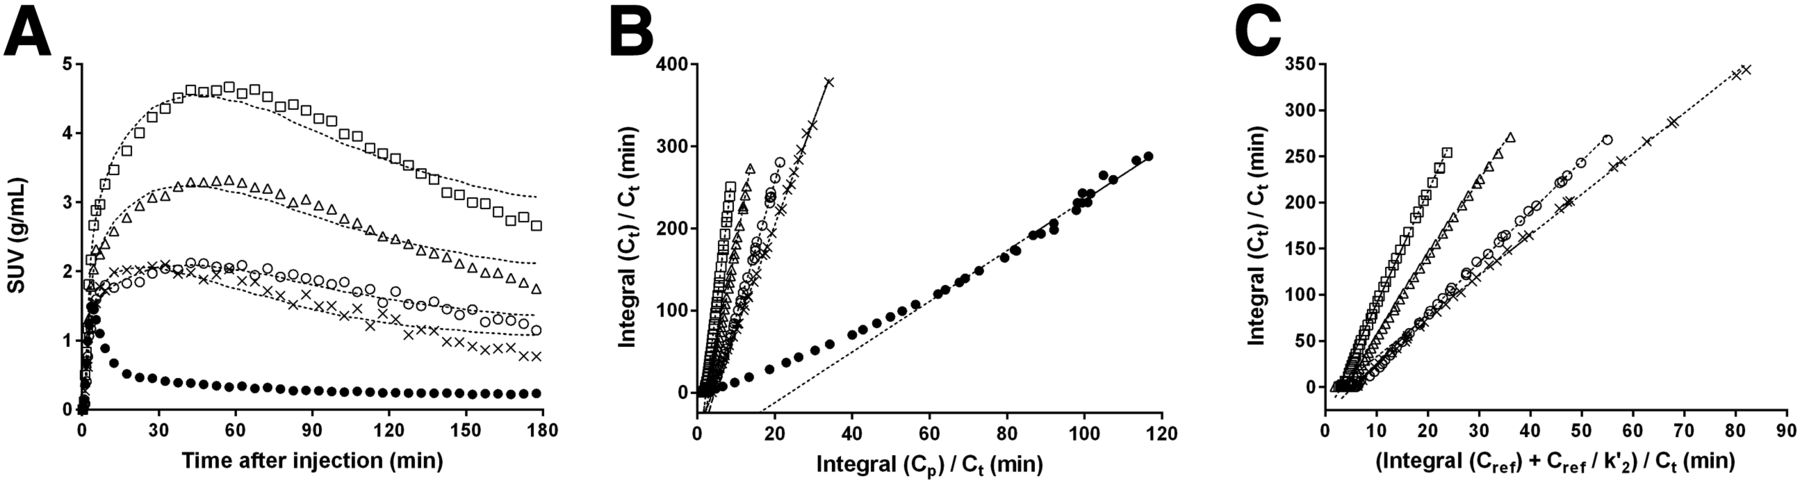
(A) Representative time–activity curves at baseline for rhesus macaque in some brain regions after bolus injection of 18F-MNI-444. Dashed lines represent SRTM fit. (B) LGA with plasma input function. Dashed lines represent linear regression with t* set to 60 min. (C) NI-LGA with reference region input function. Dashed lines represent linear regression with t* set to 60 min and k′2 set to 0.35 min−1. △ = caudate; □ = putamen; ○ = globus pallidus; × = nucleus accumbens; ● = cerebellum.
Logan plots (t* = 60 min, LGA and NI-LGA) and SRTM fits are provided in Figures 3A–3C for a representative baseline scan. SRTM determined k′2 to be 0.37 ± 0.15 min−1 and 0.34 ± 0.13 min−1 for 180- and 120-min acquisitions, respectively, with improved fits for shorter acquisitions. For NI-LGA, k′2 was set to 0.35 min−1. For baseline scans (n = 6), LGA VT (180 min) estimates ranged from 3.47 ± 0.65 in the cerebellum to 30.25 ± 5.82 in the putamen, with the rank order being putamen > caudate > globus pallidus > nucleus accumbens > > cortices > cerebellum (Table 1). The BPND in the putamen was estimated to be 8.03 ± 2.66 with LGA, 9.64 ± 1.94 with SRTM, and 9.09 ± 2.04 with NI-LGA.
18F-MNI-444 VT and BPND at Baseline for Acquisitions of 180 Minutes
Correlations for VT and BPND between acquisition durations and between methods were investigated. For LGA, VT (120 min) correlated strongly with VT (180 min) (y = 0.99x −0.46, r2 = 0.99), whereas BPND (120 min) had a good correlation with BPND (180 min) but with a higher slope (y = 1.17x + 0.02, r2 = 0.99) because of the VT offset (y intercept of −0.46). Both SRTM BPND (120 min) and NI-LGA BPND (120 min) were in good agreement with 180-min estimates, with a slope of less than 1.09 (y = 1.07x + 0.00, r2 = 0.99, for SRTM and y = 1.09x+0.01, r2 = 0.99, for NI-LGA). There was virtually no y intercept for BPND (<0.02) for the 3 methods. BPND values derived from SRTM or NI-LGA were in good agreement and furthermore agreed with those obtained with the plasma-based LGA method (Fig. 4), in particular for 120 min, with a slope close to 1.0. Test–retest reproducibility for VT and BPND is summarized in Supplemental Table 1. Variability of VT estimated with LGA was below 13% and was particularly good in the cerebellum (∼6%), and variability of BPND was below 10% for all methods used. Variability was similar between 180- and 120-min acquisitions for both VT and BPND.

Correlation of SRTM and NI-LGA BPND with LGA BPND for acquisitions of 120 min (A) or 180 min (B). ○ = SRTM; △ = NI-LGA; solid line = line of identity; dashed line = SRTM linear regression fit; dotted line = NI-LGA linear regression fit.
For the occupancy studies, preblocking with tozadenant or preladenant increased the washout in high-uptake regions in a dose-dependent fashion (Figs. 2 and 5) and reduced uptake to levels similar to those in the cerebellum at the highest doses tested, confirming the selectivity of 18F-MNI-444. All analysis methods produced consistent occupancy measurements (Table 2), with excellent agreement between occupancies derived using 180 and 120 min of data, further supporting the reduction of the scanning time to 120 min.
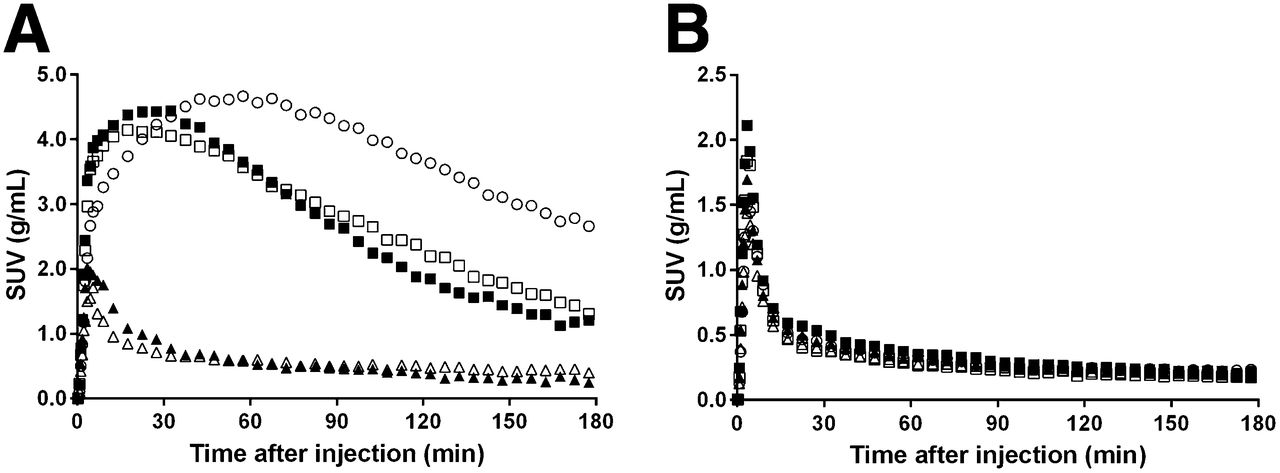
Time–activity curves for rhesus macaque in putamen (A) and cerebellum (B) after bolus injection of 18F-MNI-444 at baseline and after dosing with tozadenant or preladenant. ○ = baseline scan; ■ = tozadenant, 1.5 mg/kg; □ = preladenant, 0.004 mg/kg; ▲ = tozadenant, 10.5 mg/kg; △ = preladenant, 0.2 mg/kg.
Preladenant and Tozadenant A2A RO
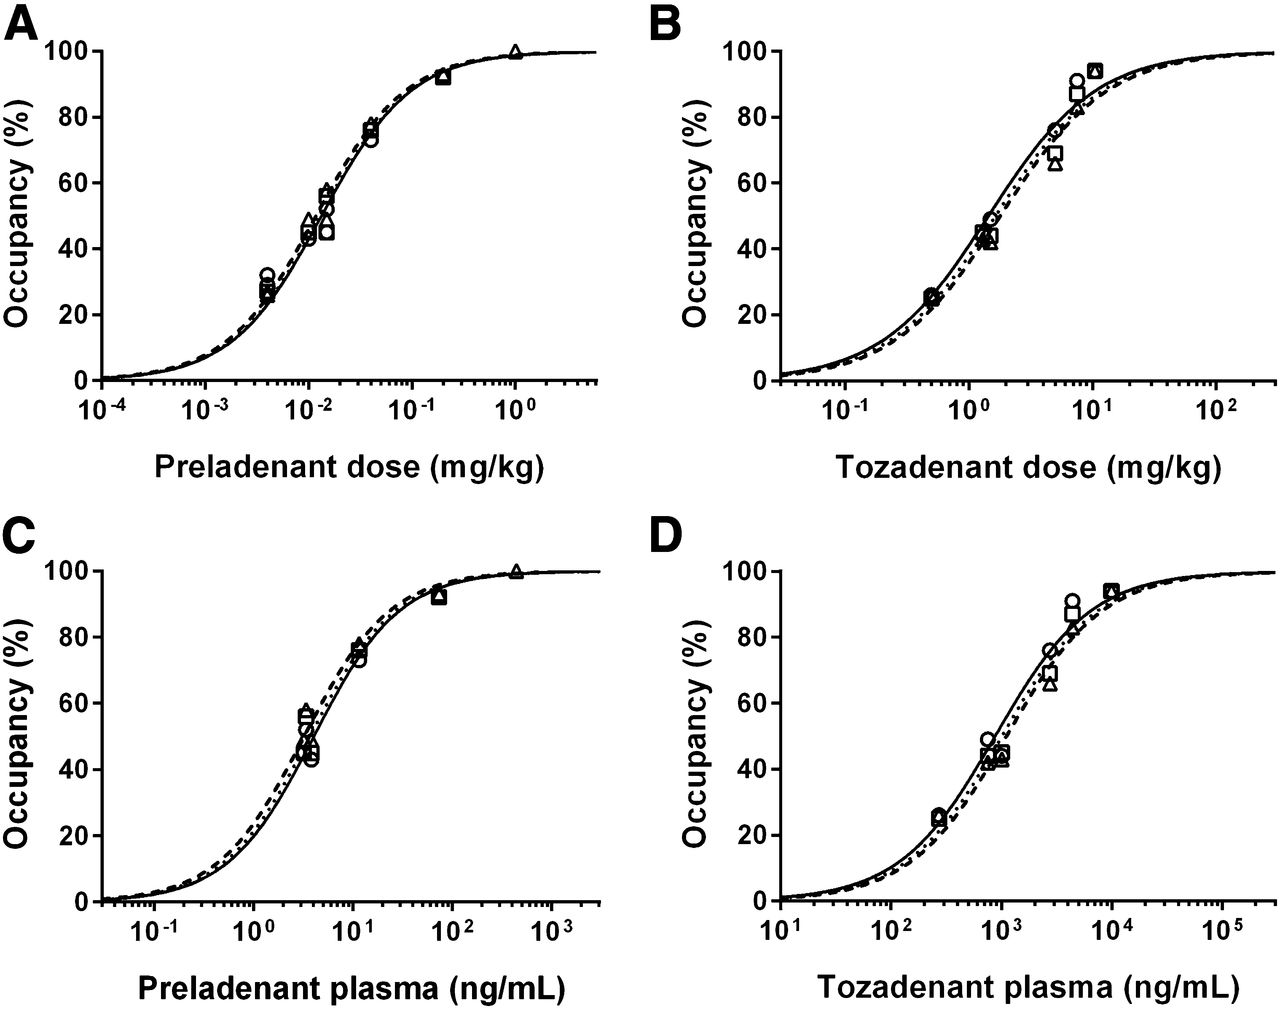
The relationships between the dose of tozadenant or preladenant and A2A RO estimated from 120 min of data are presented in Figure 6. Preladenant ED50 was estimated to be 0.013 ± 0.001, 0.012 ± 0.001, and 0.013 ± 0.001 mg/kg with LGA, SRTM, or NI-LGA, respectively, and tozadenant ED50 was estimated to be 1.44 ± 0.14, 1.79 ± 0.22, and 1.64 ± 0.18 mg/kg with LGA, SRTM, or NI-LGA, respectively. For 180-min acquisitions, compared with the respective 120-min ED50 estimates, preladenant ED50 was within 20% for LGA and within 10% for SRTM and NI-LGA, and tozadenant ED50 was within 5% for all 3 methods.

Striatal A2A RO against preladenant (A) or tozadenant (B) administered doses, and against preladenant (C) or tozadenant (D) plasma levels at beginning of scan. Symbols represent occupancy estimates using LGA (○), SRTM (△), or NI-LGA (□) for 120 min of data. Lines represent model fits using LGA (solid line), SRTM (dashed line), or NI-LGA (dotted lines) occupancy estimates.
The EC50 was estimated from the relationship of the A2A RO against the plasma level of tozadenant and preladenant. Estimates were similar for all 3 methods. Using plasma concentrations at the beginning of the scan, LGA EC50 was 877 ± 109 ng/mL for tozadenant and 4.0 ± 0.4 ng/mL for preladenant, and using average plasma concentrations during the scan, EC50 was 499 ± 57 mg/mL for tozadenant and 2.1 ± 0.3 ng/mL for preladenant. The average of these 2 EC50 values for each drug was used for the pharmacokinetic modeling described below: EC50 = 688 ng/mL for tozadenant and EC50 = 3.1 ng/mL for preladenant.
Estimated RO in Humans
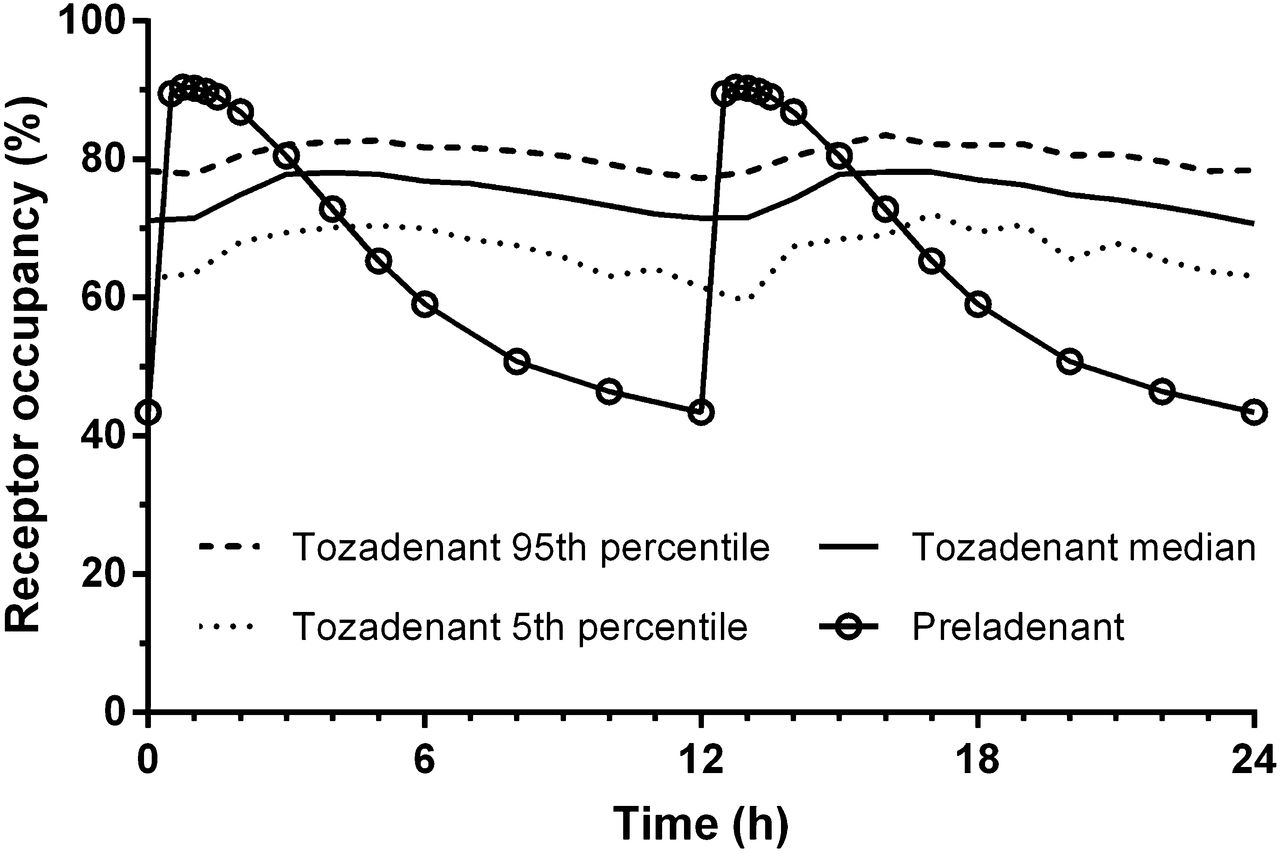
In humans, the mean steady-state plasma half-life of tozadenant is 13–15 h, whereas the half-life of preladenant is less than 3 h for doses of 10 mg and lower (25). The EC50 values in the previous paragraph (3.1 ng/mL for preladenant and 688 ng/mL for tozadenant) were adjusted for differences in free fraction to estimate the EC50 in humans. The free-fraction–adjusted EC50 was 1,147 ng/mL for tozadenant and 9.2 ng/mL for preladenant. A2A RO over 24 h was predicted assuming a similar relationship in humans and NHPs between A2A RO and free plasma concentrations of tozadenant and preladenant. Occupancy by tozadenant was predicted to be better sustained than that by preladenant (Fig. 7). Preladenant, 10 mg BID, is predicted to achieve approximately 90% occupancy at Cmax and to drop below 60% after 6 h. For 180 mg BID of tozadenant, the predicted occupancy at Cmax is approximately 78% and remains above 70% until the next dose (12 h).

Pharmacokinetic modeling of tozadenant and preladenant plasma concentrations in humans was used to predict A2A RO after repeated dosing (180 mg BID of tozadenant and 10 mg BID of preladenant).
18F-MNI-444 Dosimetry
18F-MNI-444 whole-body images are shown in Supplemental Figure 1, and the calculated absorbed doses and whole-body effective doses are presented in Supplemental Table 3. The estimated radiation exposure (0.022–0.028 mSv/MBq) is in line with other 18F-labeled tracers (e.g., 0.019 mSv/MBq for 18F-FDG) and would allow several scans to be performed on the same subject with a 180-MBq dose.
DISCUSSION
The primary aim of this study was to evaluate a new PET radiotracer for in vivo imaging of brain A2A receptors. The secondary aim was to use pharmacokinetic information from human studies to predict A2A RO by tozadenant and preladenant.
Routine production of 18F-MNI-444 was accomplished using an automated synthesis module. The 18F-MNI-444 product was purified by reverse-phase high-performance liquid chromatography, formulated into a physiologic solution, and filtered into a sterile final product vial in a total production time of less than 60 min with an average decay-corrected yield of around 25%, a radiochemical purity greater than 99%, and a specific activity in excess of 370 GBq/μmol.
18F-MNI-444 demonstrated high brain uptake in rhesus monkeys and a distribution in agreement with the known distribution of A2A receptor. 18F-MNI-444 had a moderate metabolism rate, unaffected by preinjection of the 2 selective A2A antagonists tozadenant and preladenant.
Time–activity curves were also analyzed using standard 1- and 2-tissue-compartment models (data not shown) (26). The 1-tissue-compartment model did not provide good fits visually in any regions and gave higher Akaike criteria than the 2-tissue-compartment model. On the other hand, the 2-tissue-compartment model adequately described curves in high-uptake regions but had convergence issues in cortical regions and in the cerebellum, with a close-to-zero k4 rate constant (23). Therefore 1- and 2-tissue-compartment models were not investigated further.
The relationship between VT (120 min) and VT (180 min) was close to the line of identity for LGA, with a small offset. In high-uptake regions, a 120-min acquisition resulted in a slightly smaller (<5%) VT, whereas in the cerebellum the difference was larger (−17%). For BPND, a similar effect was observed, with an acceptable difference of less than 10% for the reference region–based methods and a good correlation of BPND among all 3 methods. For SRTM, the improvement in the fits for shorter acquisitions could be due to a more 1-tissue-compartment model–like signal or to a reduction of the effects of an unlikely but potentially slowly penetrating radiometabolite. For the occupancy estimates, there was excellent agreement for all methods and acquisition durations, with the test–retest reproducibility remaining excellent for acquisitions of 2 h.
Pharmacokinetic modeling of human plasma levels of tozadenant and preladenant combined with corrected NHP EC50 estimates suggested that the median A2A RO of 180-mg-BID tozadenant will be sustained, whereas the RO of 10-mg-BID preladenant will drop below 60% after 6 h. Importantly, these predictions assume that the EC50 is the same in rhesus monkeys and humans and could be substantially different from those estimated here should that not be so. The potential clinical relevance of this difference in RO remains to be determined.
A dose-independent reduction of VT in the cerebellum of less than 15% was observed for all preblocking studies compared with baseline. The cerebellum has low to negligible A2A receptor density (9), and this region was used as a reference in previous studies with other A2A radiotracers (5,8). It is therefore unclear whether this reduction is due to blocking of specific binding in the cerebellum (unlikely because of the dose independence) or other factors such as small changes in the plasma protein binding that would be difficult to detect given the low free fraction (∼1%). However, if one conservatively assumes a specific signal in the cerebellum of 20% of the total signal, occupancy measurement error (maximum, ∼50% occupancy) would be less than 5% (27,28). The excellent agreement in the occupancy estimates between the plasma-based and reference region–based methods suggests that A2A occupancy can be quantitatively assessed in rhesus monkeys using SRTM or NI-LGA without the need for arterial sampling.
With a maximum striatum-to-cerebellum ratio of about 12.0 at 60–70 min, 18F-MNI-444 appears superior to other A2A PET tracers such as 11C-TMSX and 11C-SCH442416, with a ratio of about 1.5 at 60 min being measured for 11C-TMSX (previously denoted 11C-KF18446) in rhesus monkeys (8) and a ratio of about 2.2 at 15 min being measured for 11C-SCH442416 in Macaca nemestrina (5).
CONCLUSION
We report here the evaluation of 18F-MNI-444 in nonhuman primates. 18F-MNI-444 had regional uptake consistent with A2A receptor distribution and with much improved binding ratios compared with currently available A2A PET radiotracers. The selectivity of 18F-MNI-444 for A2A was demonstrated against 2 A2A antagonists. Noninvasive quantification of 18F-MNI-444 with SRTM or LGA using the cerebellum as a reference is possible for 120-min acquisitions, in particular for occupancy studies. 18F-MNI-444 dosimetry is favorable, with an effective dose consistent with values reported for other PET radiotracers used in humans. Therefore, 18F-MNI-444 has great potential as a PET radiotracer for A2A receptor imaging in humans. Lastly, because of differences in pharmacokinetics in humans, A2A RO by tozadenant is predicted to be more sustained than A2A RO by preladenant at clinical doses.
DISCLOSURE
The costs of publication of this article were defrayed in part by the payment of page charges. Therefore, and solely to indicate this fact, this article is hereby marked “advertisement” in accordance with 18 USC section 1734. This study was financed by UCB Biopharma SPRL. No other potential conflict of interest relevant to this article was reported.
Footnotes
Published online Jul. 31, 2014.
- © 2014 by the Society of Nuclear Medicine and Molecular Imaging, Inc.
REFERENCES
- Received for publication April 22, 2014.
- Accepted for publication June 27, 2014.


Jump to section
Related Articles
Cited By...
- In Vivo Evaluation of 11C-Preladenant for PET Imaging of Adenosine A2A Receptors in the Conscious Monkey
- Preclinical Evaluation and Quantification of 18F-Fluoroethyl and 18F-Fluoropropyl Analogs of SCH442416 as Radioligands for PET Imaging of the Adenosine A2A Receptor in Rat Brain
- Characterization in Humans of 18F-MNI-444, a PET Radiotracer for Brain Adenosine 2A Receptors