


Abstract
Tumor hypoxia hampers the efficacy of radiotherapy because of its increased resistance to ionizing radiation. The aim of the present study was to estimate the potential added clinical value of the specific hypoxia tracer 18F-fluoroazomycin arabinoside (18F-FAZA) over commonly used 18F-FDG in the treatment of advanced-stage non–small cell lung cancer (NSCLC). Methods: Eleven patients with stage III or stage IV NSCLC underwent 18F-FDG and 18F-FAZA PET before chemoradiotherapy. The maximum standardized uptake value (SUVmax) was used to depict 18F-FDG uptake, and the tumor-to-background (T/B) ratio and tumor fractional hypoxic volume (FHV) were used to quantify hypoxia. The spatial correlation between 18F-FDG and 18F-FAZA uptake values was investigated using voxel-based analysis. Partial-volume correction was applied. Results: All 11 patients showed clear uptake of 18F-FAZA in the primary tumor. However, different patterns of 18F-FDG and 18F-FAZA uptake distributions were observed and varied widely among different tumors. No significant correlation was observed between 18F-FDG SUVmax and 18F-FAZA T/B ratio (P = 0.055). The median FHV of 1.4 was 48.4% (range, 5.0–91.5). A significant positive correlation was found between the 18F-FAZA T/B ratio and FHV of 1.4 (P < 0.001). There was no correlation between the lesion size and FHV or between the 18F-FDG SUVmax and FHV. The pattern of tumoral 18F-FDG uptake was rather homogeneous, whereas 18F-FAZA uptake was more heterogeneous, suggesting that 18F-FAZA identifies hypoxic areas within metabolically active areas of tumor. A significant correlation between 18F-FDG SUVmax and lesion size (P = 0.002) was observed. Conclusion: 18F-FAZA PET imaging is able to detect heterogeneous distributions of hypoxic subvolumes out of homogeneous 18F-FDG background in a clinical setting. Therefore, 18F-FAZA might be considered a tool for guiding dose escalation to the hypoxic fraction of the tumor.
Lung cancer is the leading cause of worldwide cancer mortality, and non–small cell lung cancer (NSCLC) accounts for 85% of all cases. At presentation, approximately 30% of patients with NSCLC have locally advanced stage III disease (1). The median overall survival for (pathologically) stage IIIA and IIIB disease is 22 and 13 mo, respectively, with corresponding 5-y overall survival rates of 24% and 9%, respectively (2). For patients with stage IV clinical disease, median overall survival is only 6 mo, and the estimated 5-y overall survival a poor 2% (2).
The treatment of stage III and IV patients currently consists of either chemotherapy or combined chemoradiotherapy. Unfortunately, the efficacy of these therapies is limited because of chemoradioresistance, which can be attributed to a large extent to the presence of hypoxia (3). The hallmark of tumor hypoxia is upregulation of hypoxia-inducible factor, leading to an increased expression of hypoxia-responsive elements such as the vascular endothelial growth factor, which induces angiogenesis for growth and differentiation of cancer cells; glycolytic enzymes, which stimulate anaerobic metabolism to meet demands at the cost of an acidic tumor environment and that are prone to metastases; erythropoietin (EPO) release-stimulating erythropoiesis, proliferation, and survival; and BNIP3 (Bcl-2 and 19-kDa interacting protein-3), which leads to genomic instability by evading apoptosis. All these factors contribute to multifactorial treatment resistance (4–7).
The gold standard to measure tumor hypoxia is Eppendorf polarographic electrodes. However, the oxygen electrode method has only been applied in a research setting, because the methodology is technically demanding and invasive and therefore not attractive in a clinical setting. Moreover, the method can only be applied in well-accessible superficial tumors. These limitations have made researchers concentrate on noninvasive techniques such as PET using hypoxia tracers.
Among the hypoxia PET tracers available, nitroimidazole derivatives are most frequently used. These compounds undergo reductive metabolism under hypoxic cell conditions, resulting in reactive tumor metabolite markers that selectively bind to macromolecular cell components and thus are trapped in the cell but wash out from normoxic cells (8). Among nitroimidazole derivatives, 18F-fluoromisonidazole was the first-generation compound that has been studied extensively in humans and animals (9,10). More recently, 18F-fluoroazomycin arabinoside (18F-FAZA) has been developed as a hypoxia tracer, because it exhibits more favorable tumor-to-background (T/B) ratios in most anatomic regions than 18F-fluoromisonidazole (11). In addition, 18F-FAZA exhibits in vivo stability against enzymatic activity, rendering it a promising tracer for tumor hypoxia in clinical studies (12).
It has been suggested that 18F-FDG uptake in tumors also reflects hypoxia, because the uptake depends on the presence of glycolytic enzymes and glucose transporters (GLUT-1) (13). The expression of GLUT-1 is stimulated by hypoxia-inducible factor 1α activity, which is upregulated in a hypoxic environment (14). Hence, it has been assumed that 18F-FDG uptake of tumors is affected by tumor hypoxia (15). Previous studies have reported significant discrepancies between 18F-fluoromisonidazole and 18F-FDG uptake, indicating that tumor hypoxia and glucose metabolism do not always correlate (16,17). However, to our knowledge, the relationship between tumor hypoxia determined by 18F-FAZA PET and glucose metabolism determined by 18F-FDG PET has not been established yet in a clinical setting.
The aim of the present study was, therefore, to estimate the potential added clinical value of the specific hypoxia tracer 18F-FAZA over the commonly used 18F-FDG in the treatment of advanced-stage NSCLC. Voxel-by-voxel analysis was performed to determine the spatial correlation between 18F-FDG and 18F-FAZA uptake assessed in the same patients at close time points.
MATERIALS AND METHODS
Patients
Patients with stage III or IV NSCLC treated with primary chemotherapy or concurrent chemoradiotherapy according to our institutional protocol were selected for inclusion. The patient work-up minimally included bronchoscopy with biopsy, contrast-enhanced staging CT and 18F-FDG PET/CT of the thorax and abdomen, and lung-function testing including a flow-volume curve at baseline. Eleven patients (5 men, 6 women) with a median age of 57 y (age range, 44–72 y) were included into the study. The patient characteristics and imaging data are shown in Table 1. The study was approved by the Institutional Ethics Review Board, and written informed consent was obtained from all patients.
Patient Characteristics and Imaging Data
18F-FDG PET/CT
18F-FDG PET scans were obtained at the Department of Nuclear Medicine and Molecular imaging of the University Medical Center Groningen on a Siemens mCT machine according to guidelines of the European Association of Nuclear Medicine (18). Blood samples were taken before tracer injection to confirm an acceptable blood sugar level (<11 mmol/L) after an overnight fast minimum of 5–6 h. Patients were injected with 3 MBq/kg of bodyweight intravenously. After a waiting period of 60 min, a scan was obtained from the mid thigh to the brain. The maximum standardized uptake value (SUVmax) was obtained by delineating the volume of interest (VOI) comprising the entire tumor volume using the Imalytics system (Philips), a computer-based workstation for visualization, quantification, and analysis of PET images. The data were reconstructed with time-of-flight, high-definition, ordered-subsets expectation maximization using 3 iterations, 21 subsets, and a 8-mm gaussian postprocessing filter (NEDPASS Protocol) and had a spatial resolution of 2.04 × 2.04 × 2 mm3.
Production of 18F-FAZA
Procedures for good-manufacturing-practice production of the hypoxia tracer 18F-FAZA have been developed previously. The synthesis of 18F-FAZA was optimized using a Micro Fluid Chemistry Module (Advion). The routine production was performed using a robot system (Zymark). Briefly, the precursor (2 nitro imidazole) for labeling 18F-FAZA was reacted with dried 18F/K222 complex in dimethyl sulfoxide and thereafter deprotected with 0.1 M NaOH. After high-performance liquid chromatography purification of the reaction mixture, 18F-FAZA was formulated using an Oasis HLB plus cartridge. The final sterile solution was analyzed using high-performance liquid chromatography and released for administration to the patient.
18F-FAZA PET/CT
18F-FAZA PET scans were acquired on the same mCT machine as the 18F-FDG images according to local standard operating procedures for 18F-FAZA PET scans. Patients were injected with 370 MBq intravenously. After a waiting period of 120 min, a scan was obtained from the mid thigh to the brain and analyzed using the above-mentioned research workstation. 18F-FAZA SUVmax was estimated in the same way as 18F-FDG SUVmax, including correction for the partial-volume effect. The median time interval between 18F-FDG PET and 18F-FAZA PET was 7 d. The data were reconstructed with time-of-flight, high-definition, ordered-subsets expectation maximization using 3 iterations, 21 subsets, and a 5-mm gaussian postprocessing filter and had a spatial resolution of 2.04 × 2.04 × 2 mm3.
Calculation of Voxel-Based Spatial Correlation Between 18F-FDG and 18F-FAZA PET/CT
18F-FDG whole-body PET and 18F-FAZA thorax PET were registered in a 2-step procedure using the (low-dose) CT part of both PET/CT examinations. In a first step, the whole-body CT of the 18F-FDG PET/CT was registered to the CT of the thorax 18F-FAZA PET/CT using rigid registration. In a second step, CT–CT registration was locally adjusted for motion with a constrained, intensity-based, free-form deformable image registration (DIR) algorithm using an Advanced Work station MIM Vista (version 5.6; MIM Vista Corp.). The quality of the deformation results was assessed visually based on the CT data. The algorithm used for this study has been previously validated (19,20). Next, the rigid transformation and nonrigid deformation field obtained from aligning the CT data were used to align the 18F-FDG and 18F-FAZA PET data. A 3-dimensional VOI was defined on the 18F-FDG data comprising the metabolically most active part of the tumor by thresholding the lesion using 34% of maximum 18F-FDG uptake (21). This VOI was then projected onto the aligned 18F-FAZA PET data, yielding a spatial correspondence between 18F-FAZA and 18F-FDG uptake for all tumor voxels (Fig. 1). In this way, a 2-dimensional histogram was generated representing the joint distribution of corresponding 18F-FDG and 18F-FAZA standardized uptake value (SUV) for the tumor lesion.
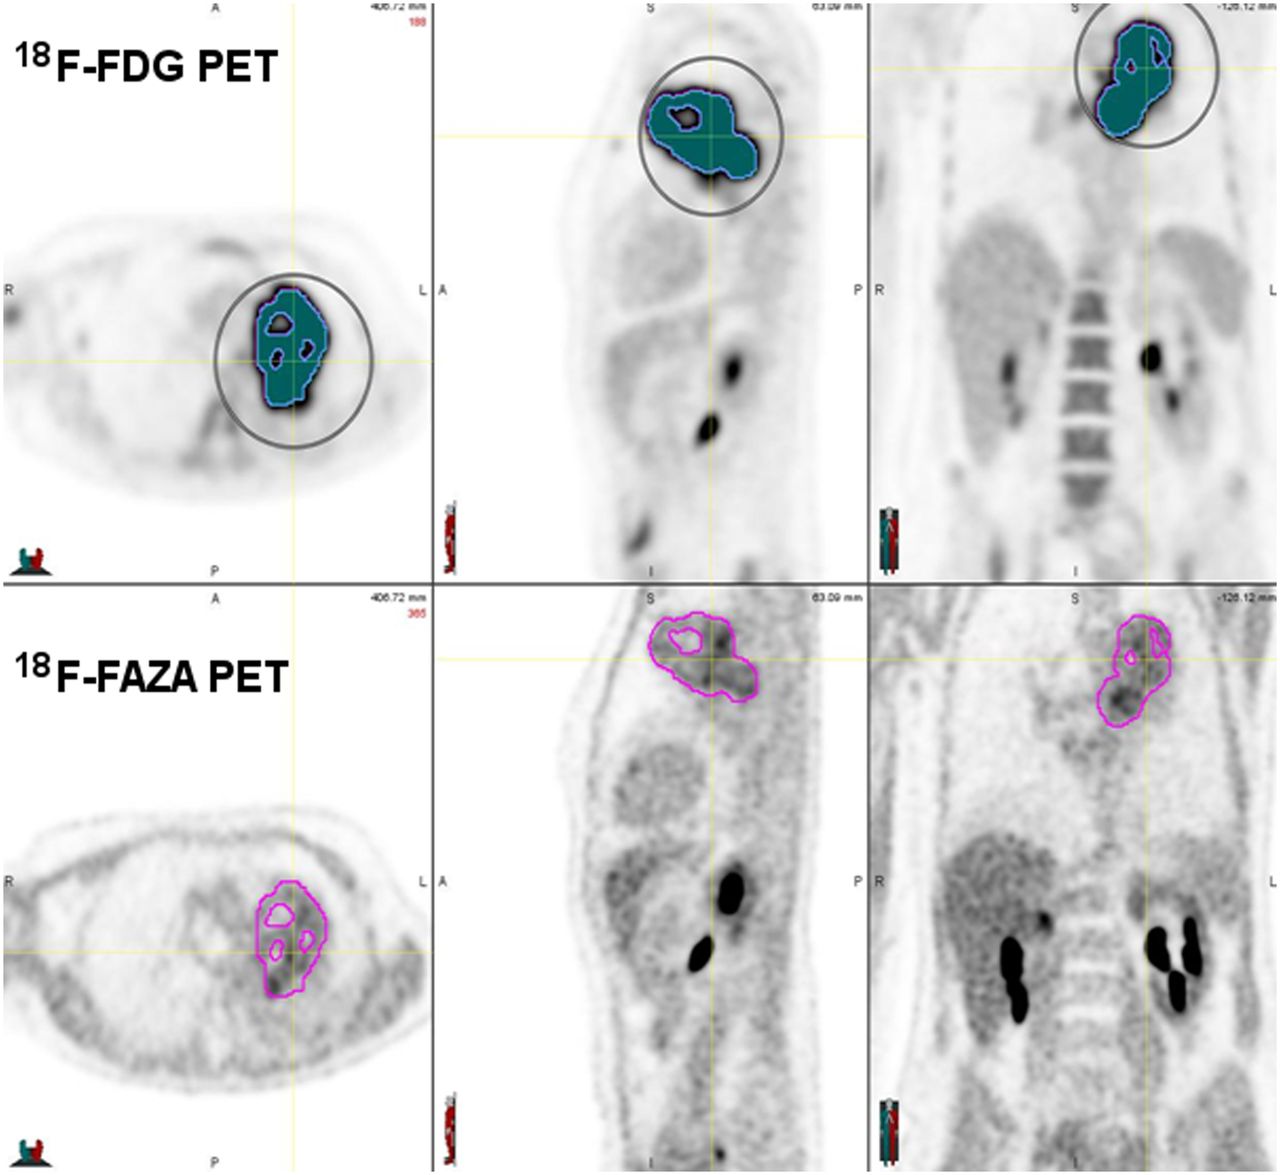
Thirty-four percent of 18F-FDG SUVmax VOI defined on 18F-FDG PET image and then projected onto aligned 18F-FAZA PET image.
Calculation of Fractional Hypoxic Volume (FHV)
The FHV was defined as the volume within the tumor exhibiting a T/B ratio ≥ 1.2 or ≥1.4 on the 18F-FAZA scans (10,22). The FHV of the tumor was determined along the following steps. First, the VOI representing the gross tumor volume on CT was created, and the SUVs within the VOI were expressed per voxel. Next, a tumor-free area in the mediastinum of at least 30-mm diameter was chosen as a reference background. The mean SUV of this background area was calculated. Finally, the 18F-FAZA T/B ratio was assessed by calculating the ratio between SUVmax within the tumor and mean SUV background.
Statistical Analysis
The data were analyzed with SPSS software (version 18.0; SPSS Inc.) for Windows (Microsoft). The 18F-FDG PET SUVmax, 18F-FAZA PET T/B ratio, FHV ≥ 1.2, FHV ≥ 1.4, and lesion size were considered as variables and reported as median values. Correlations between variables were calculated with the Spearman correlation coefficient. Because this analysis involved multiple comparisons, Bonferroni adjustment was applied, and the significance level was set at α = 0.05/9 = 0.0055.
RESULTS
Relationship Between 18F-FDG SUVmax and 18F-FAZA T/B Ratio in Tumor
All 11 patients showed clear uptake of 18F-FAZA in the primary tumor, although the accompanying CT scan was indispensable to establish the uptake of 18F-FAZA more accurately with respect to anatomic reference. The 18F-FDG uptake was also clearly visible in all tumors studied with reduced or absent uptake in necrotic areas of the tumor. The median 18F-FAZA T/B ratio was 2.8 (range, 1.8–4.6), and the median 18F-FDG SUVmax of the tumors was 7.9 (range, 4.4–29.0). The correlation between tumor hypoxia and glucose metabolism was not significant (r = 0.59; P = 0.055). Visual analysis showed that the pattern of tumoral 18F-FDG uptake was rather homogeneous, whereas 18F-FAZA uptake was more heterogeneous (Fig. 2).
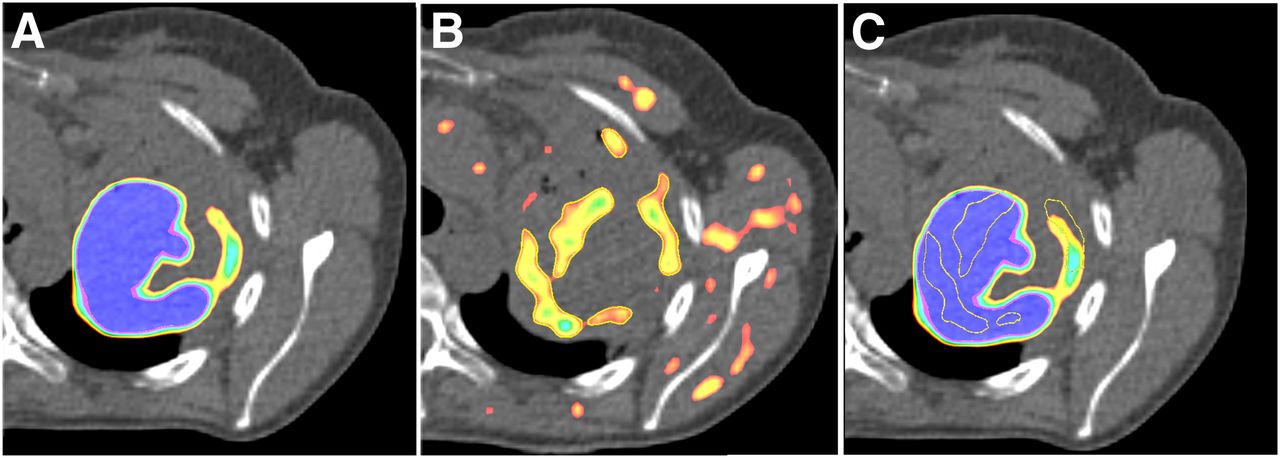
Representative transaxial 18F-FDG and 18F-FAZA PET/CT images of patient 4. (A) Thirty-four percent of maximum 18F-FDG accumulation is shown on corresponding CT image. (B) 18F-FAZA accumulation is shown on corresponding CT image. (C) Transposition of areas with 18F-FAZA accumulation onto areas with 18F-FDG accumulation.
Spatial Correlation Between 18F-FDG SUVmax and FAZA T/B Ratio in Tumor
A detailed voxel-by-voxel analysis revealed different patterns of 18F-FDG and 18F-FAZA uptake and varied widely among different tumors. In Figure 3, patients 1, 7, 8, 9, and 11 showed a moderate to good spatial correlation between 18F-FDG and 18F-FAZA uptake. A good correlation between the 2 tracers suggests well-demarcated hypoxic areas colocalized in metabolically active tumor volume. In contrast, the scatter pattern of 18F-FDG and 18F-FAZA voxels in the other patients was irregular, and no clear correlation was observed between the uptake of either tracer in identical voxels. These findings support the notion that 18F-FDG and 18F-FAZA signals indeed reflect different biologic functions if measured in the same tumor. Consequently, a poor correlation between these 2 tracers suggests a highly heterogeneous tumor microenvironment.

18F-FDG and 18F-FAZA scatterplots for all patients.
Relationship Between 18F-FDG SUVmax or 18F-FAZA T/B Ratio and Lesion Size
The median lesion size was 26 mm (range, 13–63 mm). Lesion size significantly correlated with the 18F-FDG SUVmax (r = 0.82; P = 0.002), but the correlation between lesion size and 18F-FAZA T/B ratio was not significant (r = 0.55; P = 0.07). This suggests that larger tumors are not necessarily more hypoxic than smaller tumors but do exhibit higher metabolic activity.
Relationship Between FHV of Tumor and 18F-FAZA T/B Ratio, 18F-FDG SUVmax, or Lesion Size
The median FHV was 69% (range, 17.0%–97.0%) and 48% (range, 5.0%–91.0%) when a cutoff of ≥1.2 and ≥1.4, respectively, was applied. We observed a strong and significant positive correlation between the 18F-FAZA T/B ratio and FHV cutoff of 1.4 (r = 0.88; P < 0.001); however, no significant correlation was found between the 18F-FAZA T/B ratio and FHV cutoff of 1.2 (r = 0.74; P = 0.009), suggesting that an increase of the 18F-FAZA T/B ratio is due to heterogeneously distributed high-uptake regions rather than to homogeneous uptake. Also, no correlation was found between lesion size and an FHV cutoff of ≥1.2 (r = 0.15; P = 0.65) or ≥1.4 (r = 0.40; P = 0.21) or between an 18F-FDG SUVmax and an FHV cutoff of ≥1.2 (r = 0.38; P = 0.24) or ≥1.4. (r = 0.56; P = 0.07).
DISCUSSION
The results of our study show that the pattern of tumoral uptake of 18F-FAZA varies among tumors and is more heterogeneous than 18F-FDG, signifying the importance of spatial distribution of tumor hypoxia or FHV. This distribution may arise as the result of transitory functional changes in a tumor microenvironment such as variation in tumor physiology and adaptation of blood supply in response to tumor growth. Koh et al. (23) and Rasey et al. (10) were first to publish data about the use of bioreductive molecules to visualize hypoxic subvolumes. On the basis of experimental and clinical data (10,23), they proposed the following definition for hypoxic regions: voxels exhibiting an 18F-fluoromisonidazole T/B ratio ≥ 1.4. Alternatively, Busk et al. proposed a 18F-FAZA T/B ratio of ≥ 1.2 to distinguish hypoxia (22). In our study, we decided to test both of these T/B ratio cutoff levels to determine the FHV and its relationship to lesion size, 18F-FDG SUVmax, and 18F-FAZA SUVmax. We observed no correlation between the FHV and tumor size or 18F-FDG SUVmax. Our data are similar to those reported by Rasey et al. (10) and Koh et al. (23), who also did not find a correlation between FHV measured by 18F-fluoromisonidazole and lesion size in NSCLC. Similarly, Rajendran et al. (24) and Stadler et al. (25) did not observe a correlation between FHV and tumor size in head and neck cancer patients. The fact that the hypoxic fraction of the tumor holds no relation to tumor size and 18F-FDG SUVmax is in agreement with the visual appearance of 18F-FDG and 18F-FAZA images of single tumors, where greater heterogeneity is seen on 18F-FAZA scans than on 18F-FDG scans (26,27).
It has been suggested that tumor 18F-FDG uptake is dependent on hypoxic environment (15,27,28). Hence, 18F-FDG uptake might serve as surrogate marker for hypoxia, rendering 18F-FAZA scanning redundant. The degree of 18F-FDG accumulation primarily depends on GLUT-1 expression. Upregulation of GLUTs, due to hyperglycolysis driven by hypoxia-inducible factor 1α, is observed in hypoxic regions (14). In our study, a detailed voxel-by-voxel analysis of 18F-FDG and 18F-FAZA scatterplots manifested large inter- and intratumor variability distribution patterns. In short, all possible combinations of hypoxia and glucose metabolism parameters were found: active metabolic areas, which are severely hypoxic; inactive metabolic areas, which are also hypoxic; metabolically active tumor areas, which are nonhypoxic; and finally, tumor areas that were metabolically inactive and nonhypoxic. As a result of our observations, it appears that hypoxia is heterogeneously distributed within a tumor and can occur in both metabolically active and inactive zones. Similar results were reported by Thorwarth et al. (29), underlying the need for a specific PET hypoxia tracer. The question arises as to whether these different patterns of uptake reflect different biologic mechanisms and, in addition, different clinical behavior and outcome. High 18F-FDG and 18F-FAZA uptake levels may correspond to active metabolic cells with high expression of GLUT, characterizing diffusion-limited hypoxia, whereas low 18F-FDG and 18F-FAZA uptake may characterize perfusion-limited hypoxia. High 18F-FDG uptake and no trapping of 18F-FAZA may indicate well-perfused nonhypoxic areas. Low 18F-FDG uptake and 18F-FAZA trapping might signal tumor cells that are deprived of oxygen and glucose due to perfusion insufficiency (e.g., remote blood vessel).
Recent studies have shown that hypoxia imaging during treatment could be a promising way to stratify patients who may benefit from hypoxia modification or dose escalation strategies (30,31). Future studies should evaluate the degree of spatial heterogeneity of hypoxia, retention of 18F-FAZA uptake using blood flow measurements, and spatial correlation between 18F-FDG and 18F-FAZA uptake within a single tumor during curative radiotherapy or chemoradiotherapy. In patients with a diffuse distribution of hypoxia, this pattern indicates a higher degree of spatial heterogeneity with poor prognosis; these patients might benefit from a more systemic approach, such as chemotherapy with an addition of a hypoxia-targeting drug (e.g., tirapazamine) (32). On the other hand, a well-demarcated hypoxic area with lesser degree of spatial heterogeneity can be treated with focal radiation dose escalation (33). In the past few years, highly sophisticated radiotherapy technologies have been introduced in the field of radiation oncology, such as intensity-modulated radiotherapy, which allows for dose painting—that is, the delivery of a higher dose to specific tumor areas and subvolumes. This approach is only effective in the case of static hypoxia because the boost dose is delivered to the same region every day. In the case of dynamic hypoxia, a single high-dose fraction using stereotactic body radiotherapy delivered to the hypoxic region on the same day of the 18F-FAZA PET/CT may be more appropriate.
There are some limitations in this study. First, our study lacks an innovative scanning technique such as dynamic PET scanning capable of quantifying differences between tumor oxygen perfusion and hypoxia tracer permeability within the same tumor to understand tumor heterogeneity. Future studies should focus on the spatiotemporal distribution of tumor hypoxia over time to select the most optimal treatment technique. Second, although we tried to keep the time interval between 18F-FDG and 18F-FAZA PET/CT scans as short as possible, this was not always feasible because of patient logistics and the fact that 2 tracers were used. It should be stressed that in our study patients did not receive any treatment between the 2 scans. Although we do not expect significant changes in tumor oxygenation levels, it cannot be ruled out that this may have occurred.
Another technical issue with lung cancer treatment is tumor movement during respiration. The same problem pertains to the voxel-based analysis (Fig. 3). Hence, the accurate delineation of tumor volume, taking into account respiratory motion, is essential for radiotherapy planning. To overcome this problem, optimal gating techniques or 4-dimensional PET would be an attractive option (34). However, further research needs to be done to determine the practical feasibility. Lung lesions that were included in this study, compared with the locations close to the diaphragm, were situated mostly in the upper lobes of the lungs, where respiratory movement is less pronounced (35).
DIR is a field of extreme complexity, and it is hard to evaluate its results. In this study, we expected that the influence of possible DIR inaccuracies on the PET registration was limited, because the registered volumes did not show dramatic deformations. The latter was explained by little changes in tumor size and by the short time interval between the scans (1 wk). Furthermore, no treatment had taken place in the time interval, so no dramatic deformations were expected. We considered visual inspection of the results of the DIR adequate for the application of DIR in this study.
CONCLUSION
18F-FAZA PET imaging is able to detect heterogeneous distributions of hypoxic subvolumes even within homogeneous 18F-FDG background. Therefore, 18F-FAZA when added to 18F-FDG provides information on tumor hypoxia and might be developed into a tool for guiding individualization of treatment of advanced NSCLC.
DISCLOSURE
The costs of publication of this article were defrayed in part by the payment of page charges. Therefore, and solely to indicate this fact, this article is hereby marked “advertisement” in accordance with 18 USC section 1734. This project was performed within the framework of CTMM, the Center for Translational Molecular Medicine (www.ctmm.nl), project AIRFORCE no. 030-103. No other potential conflict of interest relevant to this article was reported.
Footnotes
Published online Jun. 10, 2013
- © 2013 by the Society of Nuclear Medicine and Molecular Imaging, Inc.
REFERENCES
- Received for publication October 1, 2012.
- Accepted for publication February 4, 2013.


Jump to section
Related Articles
Cited By...
- Concomitant [18F]F-FAZA and [18F]F-FDG Imaging of Gynecological Cancer Xenografts: Insight into Tumor Hypoxia
- First Evaluation of PET-Based Human Biodistribution and Dosimetry of 18F-FAZA, a Tracer for Imaging Tumor Hypoxia
- Multiparametric Analysis of the Relationship Between Tumor Hypoxia and Perfusion with 18F-Fluoroazomycin Arabinoside and 15O-H2O PET
- Preclinical Assessment of Efficacy of Radiation Dose Painting Based on Intratumoral FDG-PET Uptake
- In Vivo Quantification of Hypoxic and Metabolic Status of NSCLC Tumors Using [18F]HX4 and [18F]FDG-PET/CT Imaging
- Parametric Methods for Quantification of 18F-FAZA Kinetics in Non-Small Cell Lung Cancer Patients