


Abstract
Rheumatoid arthritis (RA) is a chronic autoimmune disease occurring in approximately 1% of the worldwide population. The disease primarily affects the joints, where inflammatory cells, such as macrophages, invade the synovium and cause cartilage and bone destruction. Currently, it is difficult to efficiently diagnose and monitor early-stage RA. In this study, we investigated whether SPECT/micro-CT imaging with 99mTc-labeled Nanobodies directed against the macrophage mannose receptor (MMR) is a useful tool for monitoring and quantifying joint inflammation in collagen-induced arthritis (CIA), a mouse model for RA. The expression of MMR was analyzed on macrophages and osteoclasts generated in vitro and in cells obtained from various organs from mice with CIA. Methods: CIA was induced in DBA/1 mice by injection of collagen type II in complete Freund adjuvant, and cell suspensions from the inflamed joints and other organs were obtained. Macrophages and osteoclasts were generated in vitro from bone marrow cells. Expression of MMR was quantified by quantitative polymerase chain reaction and flow cytometry with specific Nanobodies and conventional antibodies. SPECT/micro-CT imaging was performed with 99mTc-labeled MMR and control Nanobodies. Results: MMR was highly expressed on macrophages and to a lesser extent on osteoclasts generated in vitro. In mice with CIA, MMR expression was detected on cells from the bone marrow, lymph nodes, and spleen. In synovial fluid of arthritic joints, MMR was expressed on CD11b+F4/80+ macrophages. On in vivo SPECT/micro-CT imaging with consecutive injections of MMR and control Nanobodies, a strong MMR signal was seen in the knees, ankles, and toes of arthritic mice. Quantification of the SPECT imaging confirmed the specificity of the MMR signal in inflamed joints as compared with the control Nanobody. Dissection of the paws revealed an additional significant MMR signal in nonarthritic paws of affected mice (i.e., mice displaying symptoms of arthritis in other paws). Conclusion: Our data show that MMR is expressed on macrophages in vitro and in vivo in synovial fluid of inflamed paws, whereas expression is relatively low in other tissues. The use of Nanobodies against MMR in SPECT/micro-CT imaging generates the possibility to track inflammatory cells in vivo in arthritic joints.
- macrophage mannose receptor (MMR)
- collagen-induced arthritis (CIA)
- single photon emission computed tomography (SPECT)
- Nanobody
Rheumatoid arthritis (RA), an autoimmune disease defined by chronic inflammation of primarily the joints of the hands and feet, occurs in approximately 1% of the worldwide population (1). Inflammation of the synovial membrane, cartilage, and bone tissue leads to pain, stiffness, and deformity of the joints. Early in the pathogenesis of RA, the synovial membrane becomes hyperplastic and infiltrated with various immune cells, including T cells, B cells, and macrophages (2).
Currently, early-stage RA is difficult to diagnose and monitor efficiently (3). Molecular imaging is a noninvasive technique that can quantify joint inflammation in vivo, which could be of great benefit to the diagnosis, grading, and follow-up of arthritic conditions, especially when assessing the efficacy of therapies (4). To this end, markers are needed that identify different subsets of cells present in the inflamed tissue. Tracer molecules developed to target these markers should bind specifically and rapidly to their target, whereas unbound molecules should be cleared from the body to increase the contrast between specific and unspecific signals. Nanobodies (Ablynx) are small (15-kDa) camelid heavy-chain antibody derivatives that meet all these requirements. These single-variable domain molecules are easily cloned from immunized animal lymphocytes and can be flexibly formatted to meet the needs of the application (5). For SPECT/micro-CT imaging, the high intrinsic thermostability and carboxy-terminal hexahistidine tail of Nanobodies allow for straightforward 99mTc labeling using tricarbonyl chemistry (6,7). Nanobody-derived probes have already been proven to generate highly specific images in several mouse tumor models and in a model for atherosclerotic lesions, with high target-to-background ratios often being obtained within 1 h of tracer injection (8–11). Recently, Nanobodies against the macrophage mannose receptor (MMR; CD206) have been developed and were successfully used to specifically target a subpopulation of tumor-infiltrating macrophages in SPECT/micro-CT imaging (12). MMR is a 175-kDa C-type lectin predominantly expressed by mature macrophages and specific endothelial and dendritic cells. Its primary functions are endocytic clearance of certain glycoproteins and phagocytosis of unopsonized microorganisms (13). Interestingly, MMR was found to be involved in the formation of multinucleated osteoclasts by binding to terminal high-mannose-type oligosaccharides expressed on osteoclast precursor cells (14,15). Osteoclasts are derived from the monocyte or macrophage lineage and are responsible for the progressive destruction of bone tissue in RA and in collagen-induced arthritis (CIA) (16,17), a frequently used animal model for human RA (18,19).
In this study, we first investigated the expression of MMR during the maturation of macrophages and osteoclasts, using MMR-specific Nanobodies in comparison with conventional antibodies against MMR. The expression of MMR was subsequently studied in various tissues of mice with CIA. Finally, the 99mTc-MMR Nanobody was used as a probe in SPECT/micro-CT imaging to track MMR-positive cells in the limbs of mice with or without symptoms of arthritis.
MATERIALS AND METHODS
Mice
Male DBA/1 mice (age, 8–12 wk) were purchased (Janvier Sas) or bred and housed in the animal facility of the University of Leuven. The experiments were approved by the local ethics committee.
CIA
CIA was induced by immunization with collagen type II (CII) in complete Freund adjuvant as previously described (20). Joint inflammation was evaluated by scoring each limb as follows: 0, normal; 1, redness/inflammation of one joint; 2, redness/inflammation of more than one joint; 3, inflammation of the entire paw; and 4, ankylosis or deformity. Limb scores were added to obtain a total score for each mouse.
Generation of Macrophages and Osteoclasts In Vitro
Bone marrow cells were cultured as previously described (20). Briefly, cells were seeded at a density of 2.5 × 10⁵ cells/cm2 in α–minimal essential medium (Gibco) with 10% fetal calf serum (FCS; Gibco). Cells were then stimulated for 2–4 d with macrophage colony-stimulating factor (M-CSF) (20 ng/mL; R&D Systems) to obtain mature macrophages or M-CSF together with receptor activator of nuclear factor κB ligand (RANKL) (50 ng/mL; R&D Systems) to generate osteoclasts. Medium and cytokines were changed every other day. After the culture period, cells were removed from the culture plates for further use or fixed and stained for the presence of the osteoclast-specific-enzyme tartrate-resistant acid phosphatase by incubation in staining solution (0.01% naphtol AS-MX phosphate and 0.06% 5-chloro-4-benzamido-2-methylbenzenediazonium chloride hemi [zinc chloride] salt in 0.1 M acetate buffer, pH 5.0) for 10 min.
Nanobodies and Antibodies
The MMR Nanobody with 6X His tag (Abcam) was produced as described previously (12). For the biotinylated version, the 6X His tag was replaced with a biotin acceptor domain (BAD) sequence (GSTSGSGLNDIFEAQKIEWHE), which allows for site-specific biotinylation. In brief, the MMR Nanobody gene was removed from the original plasmid using a PstI-BstEII restriction digest and inserted in the pHEN6cBAD vector, which was cut in a similar manner. The expression of the Nanobody was performed as described previously (12), with the addition of 50 μM D-biotin (Acros Organics) in the medium and the presence of the pBirA plasmid (21) in the Escherichia. coli cells used for expression. Initial purification was performed on a streptavidin mutein matrix (Roche) column of 5 mL according to the manufacturer’s instructions. Further steps were identical to those described for the MMR Nanobody with a 6X His tag. Nanobodies against the β-lactamase BCII enzyme of Bacillus cereus (BCII10) (22) were used as a control throughout the study.
Fc-receptor–blocking antibodies anti-CD16/anti-CD32; allophycocyanin-conjugated streptavidin; phycoerythrin-conjugated antibodies against CD11b, CD3, and Gr-1; fluorescein isothiocyanate–conjugated F4/80; and CD11c, CD31, and CD19 antibodies were purchased from eBioscience. Alexa647-conjugated MMR and corresponding isotype control antibodies were purchased from Biolegend.
Flow Cytometric Analysis
Synovial tissue and fluid, bone marrow, lymph nodes, and spleen cells were collected. Single-cell suspensions were preincubated with Fc-receptor–blocking antibodies (eBioscience) and stained with the cell-specific antibodies in combination with MMR and isotype control antibodies or biotin-conjugated MMR or BCII10 Nanobodies (10). Propidium iodide (4 μg/mL; Sigma-Aldrich) was added to select living cells. Analysis was performed on a FACScalibur flow cytometer with Cell Quest software (Becton Dickinson).
RNA Extraction, Complementary DNA Production, and Quantitative Real-Time Polymerase Chain Reaction (PCR)
Total RNA was extracted using the Micro-to-Midi Total RNA Purification System (Invitrogen) in accordance with the manufacturer’s instructions. Complementary DNA was produced by reverse transcription using Superscript II Reverse Transcriptase and random primers (Invitrogen) according to the manufacturer’s protocol. A TaqMan Gene expression Assay was used in an ABI Prism 7000 apparatus (Applied Biosystems) to perform quantitative PCR (qPCR). Expression levels of MMR (assay identification no. Mm00485148_m1; Applied Biosystems) were normalized for 18S (catalog no. 4319413E; Applied Biosystems) and glyceraldehyde-3-phosphate dehydrogenase (catalog no. 4352339E; Applied Biosystems) RNA by the 2-ΔΔCT method (23).
Radiolabeling of Nanobodies
Nanobodies were site-specifically labeled with 99mTc at their 6X His tail using [99mTc(H2O)3(CO)3]+ chemistry (Isolink; Mallinckrodt Medical BV) as described previously (11). Labeling efficiency was determined using instant thin-layer chromatography (Pall Corp., Life Sciences). Radiochemical purity was assessed by reversed-phase high-performance liquid chromatography analysis using a PLRP-S column (Agilent Technologies). Stability was further confirmed by performing gel filtration (Superdex 75) of the radiolabeled Nanobody in phosphate-buffered saline immediately after labeling and after 3 h of incubation at 37°C in mouse serum, as described previously (24). Binding specificity of the radiolabeled Nanobodies to the receptor was shown by in vitro binding of the radiolabeled Nanobodies to coated recombinant MMR protein and to MMR-expressing peritoneal macrophages, as described previously (9). In vivo binding specificity has been confirmed previously by comparing the biodistribution in wild-type and MMR-deficient mice by SPECT imaging (12).
Pinhole SPECT/Micro-CT Imaging and Analysis
Imaging was performed at 1 or 3 h after intravenous injection of 30–90 MBq of 99mTc-labeled Nanobody, corresponding to approximately 10 μg as described previously (25). From our previously reported experiments, we concluded that this dose of MMR Nanobody can be considered nonpharmacologic, because it was unable to elicit cytokine and chemokine production in vitro and in vivo and failed to modify lipopolysaccharide-induced cytokine production (12).
Mice were anesthetized using ketamine hydrochloride (18.75 mg/kg; CEVA Animal Health) and medetomidine hydrochloride (0.5 mg/kg; Domitor [Pfizer Animal Health]). Micro-CT imaging (SkyScan 1178; SkyScan) and pinhole SPECT imaging (e.cam180; Siemens Medical Solutions) were performed on separate imaging systems, with the animal in the same animal holder including six 57Co sources as landmarks for semiautomated rigid-body registration. For pinhole SPECT, the camera was mounted with 2 triple-pinhole collimators (pinhole opening, 1.5 mm). Images were reconstructed using an iterative reconstruction algorithm and corrected for attenuation and scatter. Micro-CT images were reconstructed using filtered backprojection (NRecon; SkyScan). Images were viewed and analyzed using AMIDE: A Medical Image Data Examiner software (26). Regions of interest were drawn around the areas of interest. Recorded amounts of radioactivity in the regions of interest were divided by the amount of injected activity (corrected for decay) and expressed as percentage injected activity (%IA).
After SPECT/micro-CT imaging, the mice were sacrificed with a lethal dose of pentobarbital. The paws were dissected and weighed, and their radioactivity content was measured using an automated γ-counter (Cobra II Inspector 5003; Canberra-Packard).
Statistical Analysis
Statistical analyses were performed using the Student t test for unpaired data or the Mann–Whitney U test. P values of 0.05 or less were considered indicative of statistical significance.
RESULTS
MMR Is Expressed on Macrophages and Osteoclasts
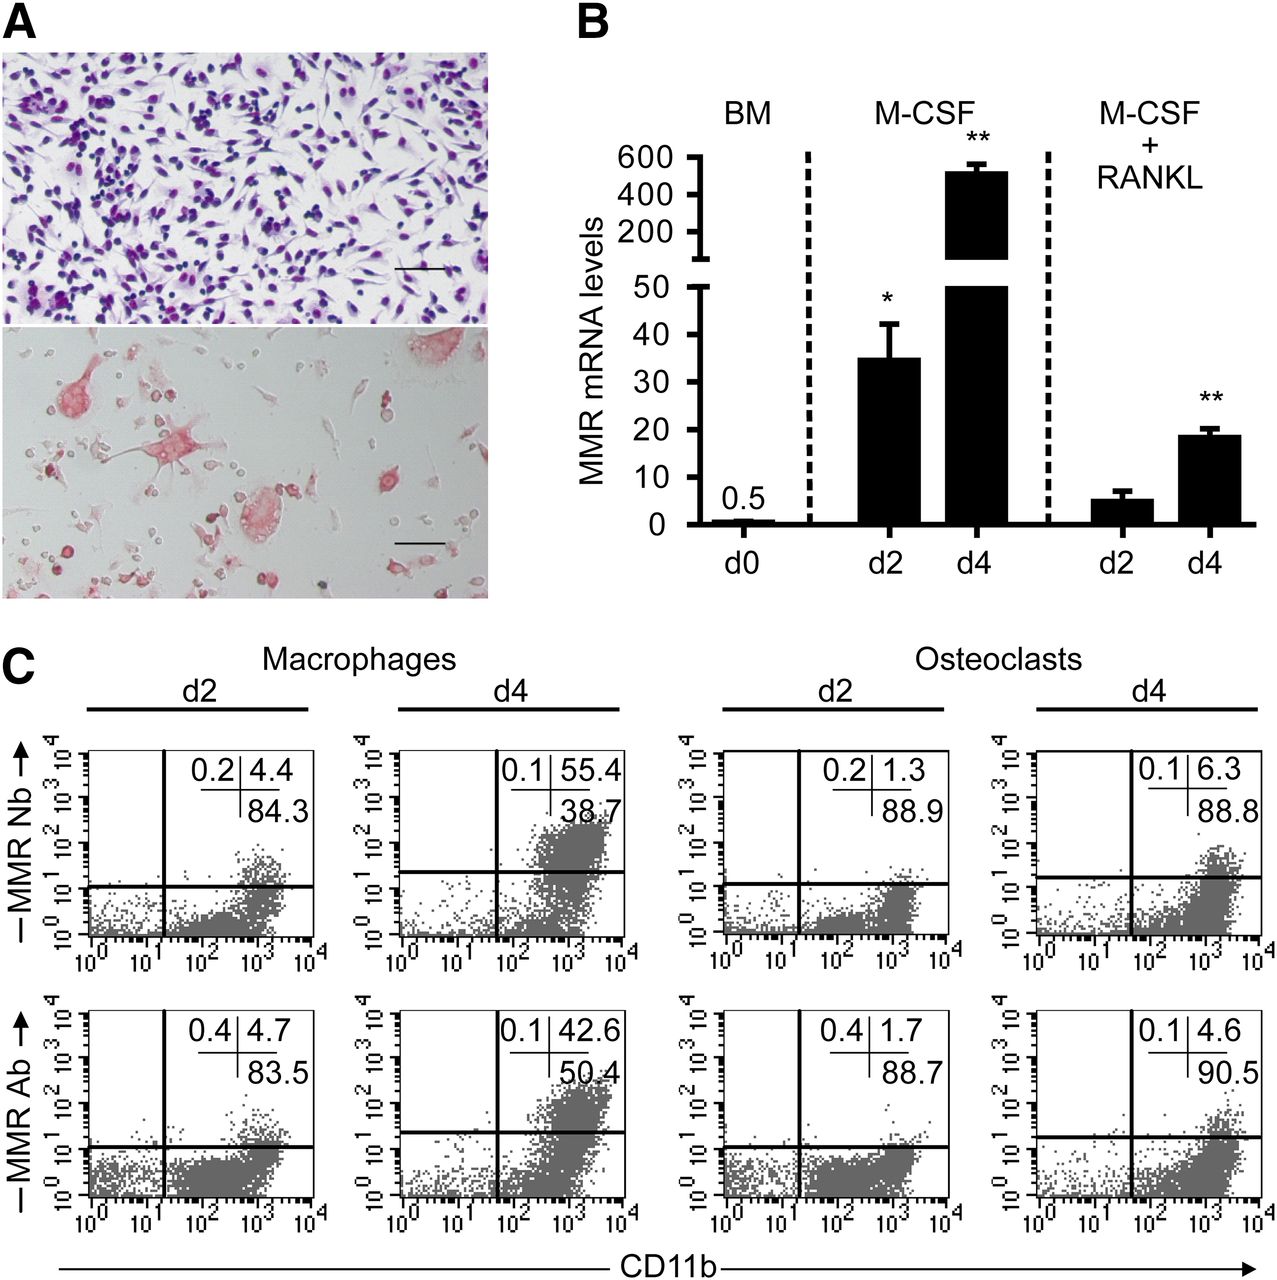
Bone marrow cells were cultured for 2–4 d in the presence of M-CSF with or without RANKL. Macrophages were identified by hematoxylin and eosin staining and their adherence to the substrate. Osteoclast differentiation was detected by tartrate-resistant acid phosphatase staining and by enumeration of cells with 3 or more nuclei (Fig. 1A). Expression of MMR in these cells was evaluated by qPCR and flow cytometry. In unstimulated bone marrow cells (day 0), messenger RNA (mRNA) for MMR was barely detectable, but its expression increased on maturation with M-CSF. During osteoclastogenesis, the increase of MMR mRNA levels was less pronounced (Fig. 1B). mRNA data were confirmed at the protein level by flow cytometry using a MMR-specific Nanobody and a conventional monoclonal anti-MMR antibody. MMR was highly expressed on mature macrophages in culture and to a lesser extent in osteoclast cultures (Fig. 1C). On average, 50% of macrophages and 5%–10% of RANKL-stimulated cells expressed MMR. Staining profiles obtained with Nanobody were similar to those obtained with conventional antibodies (Fig. 1C).

Expression of MMR increases in vitro during formation of macrophages and osteoclasts. Bone marrow cells were cultured in presence of M-CSF or M-CSF plus RANKL. (A) Representative pictures of cultures stimulated for 4 d with M-CSF (upper, hematoxylin and eosin staining) and M-CSF plus RANKL (lower, tartrate-resistant acid phosphatase staining). (B) Expression of MMR mRNA, as measured by qPCR, before culture (d0) and after 2 (d2) or 4 (d4) days. Data are normalized against 18S and GAPD RNA and represent means of 5 values + SEM (unpaired t test, *P < 0.005, **P < 0.0001). One representative experiment of 3 is shown (each experiment was performed with 5 replicates from a pool of at least 2 mice). (C) Flow cytometry on cells harvested after 4 d, using biotin-conjugated MMR Nanobodies or Alexa647-conjugated MMR antibodies and phycoerythrin-conjugated CD11b antibodies. Dot plots shown are of 1 experiment of 2. Percentages of cells in each quadrant are indicated. Quadrant placement was based on staining with isotype control immunoglobulin and control Nanobodies. Ab = antibody; BM = bone marrow before culturing; Nb = Nanobody. Scale bar: 50 μm.
MMR Is Expressed in Synovial Tissues of Mice with CIA
CIA was induced in DBA/1 mice, and clinical symptoms (i.e., redness and swelling of the joints) (Fig. 2A) were recorded for 35 d. When a total arthritic score of approximately 6 (total score of the 4 limbs) was reached, the animals were sacrificed and different organs were dissected for qPCR analysis of MMR mRNA levels. Lungs, blood cells, liver, bone marrow, lymph nodes (submandibular and inguinal), and spleen contained MMR mRNA. Interestingly, also synovia and synovial fluid showed expression of MMR (Fig. 2B). Nanobodies against MMR were used to confirm these qPCR results at the level of membrane-expressed MMR protein by flow cytometry performed on cell preparations of bone marrow, lymph nodes (submandibular and inguinal), spleen, synovium, and synovial fluid (Fig. 2C). In synovia and inguinal lymph nodes, MMR expression was barely detectable (data not shown). MMR expression was detected on cells from bone marrow, submandibular lymph nodes, spleen, and synovial fluid. In these organs, MMR-expressing cells were predominantly CD11b+. More specifically, in synovial fluid, MMR expression was restricted to CD11b+F4/80+ double-positive cells (Fig. 2D). Expression of MMR was not found on endothelial cells (CD31+), B cells (CD19+), or T cells (CD3+) of the synovial fluid (data not shown).

MMR is expressed in vivo in mice with CIA. (A) Images representing clinical scores of CIA in DBA/1 mice. (B) qPCR for MMR mRNA in tissues of mice with CIA (mean total arthritic score per mouse, ∼6). Data are normalized against 18S and GAPD RNA and represent means of 8 mice + SEM. (C) MMR protein expression in bone marrow, lymph nodes, spleen, and synovial fluid as evident from flow cytometry with biotin–MMR Nanobodies and phycoerythrin–CD11b antibodies. Biotin–BCII10 control Nanobodies (see “Materials and Methods” section) were used to visualize background staining. Propidium iodide was used to select for living cells. (D) Flow cytometry on cells from synovial fluid stained with biotin–MMR Nanobodies, phycoerythrin–CD11b antibodies, and fluorescein isothiocyanate–conjugated F4/80 antibodies (left dot plot). Dot plots on right show percentages of MMR-positive CD11b+F4/80+ (R1), CD11b+F4/80− (R2), and CD11b−F4/80− (R3) cells. Quadrant placement was based on profiles obtained with control Nanobodies. BM = bone marrow; FSC = forward scatter; Ing. LN = inguinal lymph nodes; Subm. LN = submandibular lymph nodes; Syn. fluid = synovial fluid.
99mTc-Labeled MMR Nanobodies Specifically Target MMR in Mice
MMR Nanobodies were labeled with 99mTc and purified, after which binding specificity, radiochemical purity, and stability were examined. The specificity of the 99mTc-labeled MMR Nanobodies was evident from their high binding with MMR-expressing peritoneal macrophages, or MMR protein versus low binding to MMR-deficient macrophages or control protein. The 99mTc-labeled BCII10 control Nanobodies demonstrated a low binding to wild-type macrophages and MMR protein. Reversed-phase high-performance liquid chromatography of the MMR Nanobodies after 99mTc-labeling revealed almost 99% purity. Gel filtration of the 99mTc-labeled Nanobodies in phosphate-buffered saline or after 3 h of incubation in mouse serum at 37°C proved their stability (Supplemental Fig. 1; supplemental materials are available online only at http://jnm.snmjournals.org). Targeting of MMR-specific Nanobodies to MMR+ cells in the limbs of mice with severe symptoms of arthritis (mean score ≥ 4 per mouse) was investigated by injecting 99mTc-labeled MMR Nanobodies intravenously in CIA mice. SPECT scans were obtained concomitantly with micro-CT at 1 and 3 h after injection to gauge the effect of the clearance phase on the contrast obtained between specific and background signals. After 1 h, the MMR Nanobody showed strong focal signals in the ankles, tarsals, and metatarsals (Fig. 3). Also, the MMR Nanobody signal did not visibly decline between the 2 time points, whereas the signal from BCII10 control Nanobodies was not pronounced at 1 h after injection and had almost completely disappeared after 3 h (Fig. 3). The specificity of the observed MMR Nanobody accumulation was further confirmed by quantification of the remaining radioactivity (%IA) in the ankles and metatarsal joints. In comparison with 1 h after injection, the signal from MMR Nanobodies at 3 h after injection decreased, with approximately 6% in the paws, whereas the amount of BCII10 control Nanobody was reduced by approximately 65% at the 3-h time point. In contrast to the arthritic mice, the signal in paws of naïve, healthy animals was low and imaging at 3 h after injection showed almost complete clearance of MMR and BCII10 Nanobodies (Fig. 3). Accordingly, 3 h was chosen as an endpoint for further SPECT experiments aimed at localizing MMR expression in vivo. In concordance with our previous experiments with respect to imaging of MMR in tumor-bearing mice (12), injection of MMR Nanobody in naïve mice led to prominent signals in the submandibular lymph nodes, liver, and spleen (Supplemental Fig. 2), most likely representing binding to MMR expressed on endothelial cells, tissue macrophages, and dendritic cells in these tissues (27). The high SPECT signals observed in the kidneys and bladder, for both the MMR and the BCII10 Nanobodies, are a consequence of the rapid clearance of unbound Nanobody from the blood (11). No relevant amount of MMR Nanobody accumulation was seen in the limbs and joints of naïve animals.
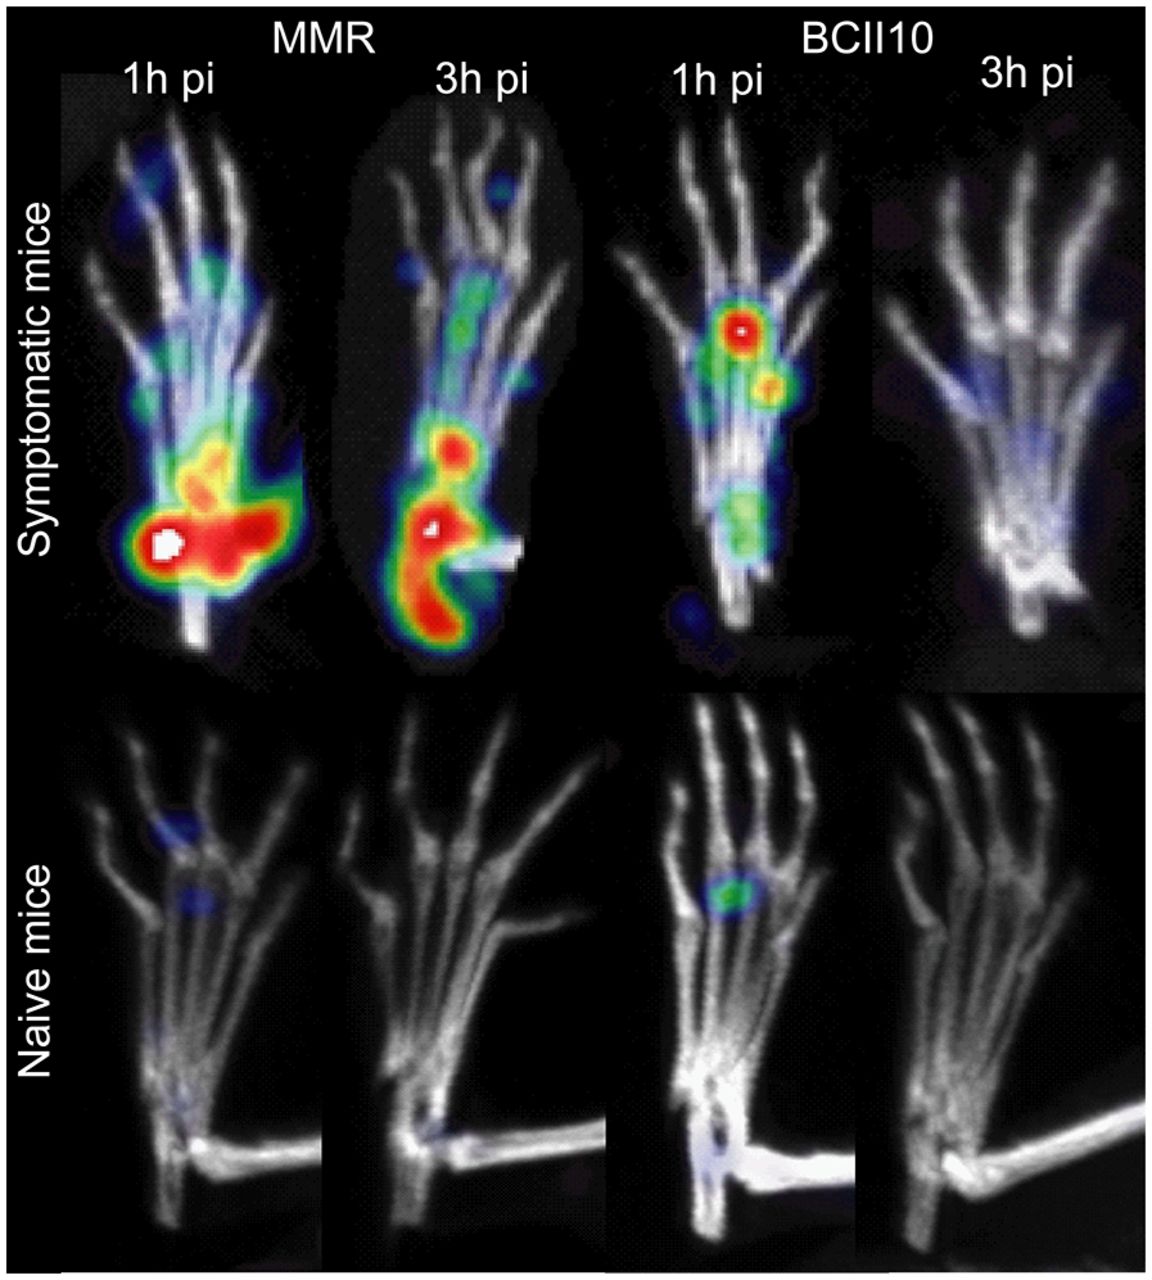
MMR Nanobodies specifically target MMR in in vivo SPECT imaging. SPECT imaging was performed after micro-CT scans on arthritic (symptomatic) mice (n = 8) (35 d after immunization, mean total arthritic score ≥ 4) and healthy (naïve) mice. Detailed images of affected or healthy limbs obtained at 1 or 3 h after intravenous injection of 99mTc-labeled MMR-specific Nanobodies or BCII10 control Nanobodies are shown. Amounts of radioactivity emitted by joint areas were determined; after injection of MMR Nanobody in arthritic mice, decrease in radioactivity between 2 time points was ±5%, against ±65% after injection of control BCII10 Nanobody. pi = postinjection.
99mTc-Labeled MMR Nanobodies Visualize Inflamed Joints of Mice with CIA
Immunized mice were divided into a group remaining free of symptoms of arthritis (asymptomatic) and a group displaying clear inflammation (i.e., redness and swelling) in one or multiple joints (symptomatic). To increase the specificity of the SPECT signals, paw-to-paw and lesion-to-lesion differences were minimized by performing a set of crossover experiments on naïve and CIA mice. Consecutive injections of MMR Nanobodies and BCII10 control Nanobodies were given to the animals, with a 2-d interval to allow for adequate clearance of the Nanobodies and radioactive decay. In symptom-free immunized mice, an MMR signal appeared only in the lymph nodes, liver, spleen, kidney, and bladder, which was completely comparable to the profile obtained in naïve mice, except for an additional signal at the base of the tail, at the site of CII and complete Freund adjuvant injection (Fig. 4A). For the BCII10 Nanobody, only background signals in the kidneys and bladder were observed in both asymptomatic and symptomatic animals. However, in mice with symptoms of CIA, an additional MMR-specific signal became apparent in the joints, in particular in the knees, ankles, and toes (Fig. 4B). These data demonstrate specific accumulation of the MMR Nanobody in the inflamed joints of arthritic mice.
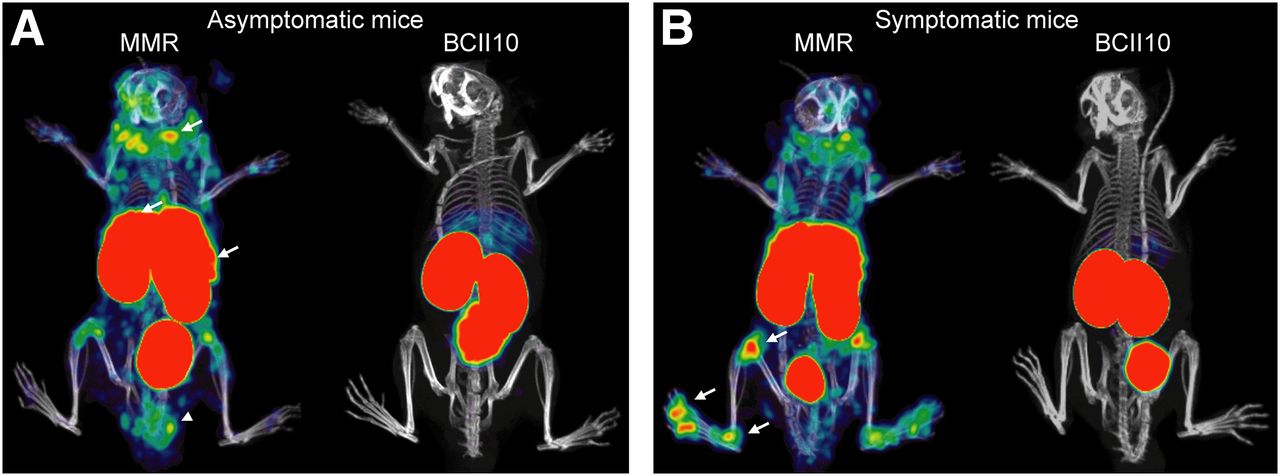
In vivo imaging with MMR-specific Nanobodies visualizes MMR expression in arthritic joints. SPECT imaging was performed after micro-CT scans. Representative images of mice obtained at 3 h after intravenous injection of 99mTc-labeled MMR-specific Nanobodies or BCII10 control Nanobodies are shown (n = 30 mice). (A) Representative SPECT/micro-CT images of immunized mice that did not demonstrate clinical symptoms of arthritis (asymptomatic) and were injected with labeled MMR Nanobody or BCII10 control Nanobody. Note presence of specific MMR staining in lymph nodes, liver, spleen (arrows), and tail base (arrowhead). Kidneys and bladder showed aspecific signal in each image due to elimination of Nanobodies via this route. (B) Representative images of mice that did display clinical signs of arthritis in both hind limbs (symptomatic) and were injected with labeled MMR Nanobody or BCII10 control Nanobody. As in asymptomatic mice, a signal was apparent in lymph nodes, liver, spleen, and tail base. Additionally, MMR staining was evident in knees, ankles, and metatarsal joints (arrows).
Joint Inflammation Is Quantified by MMR Nanobodies
The amount of accumulated MMR and BCII10 control Nanobody in specific regions of interest was quantified in the images obtained in groups of nonimmunized mice, mice that had been immunized to develop CIA but without clinical symptoms of arthritis (asymptomatic), and mice that had been immunized and with symptoms of arthritis (symptomatic). Group values are shown in Supplemental Table 1, and data are graphically presented in Figure 5. After MMR Nanobody injection, the lymph node region of asymptomatic mice contained slightly more radioactivity than did that of the naïve mice. A similar observation was made for the site of injection (i.e., base of the tail) (Supplemental Fig. 3). More importantly, the ankles (Fig. 5A), metatarsal joints (Fig. 5B), and knees (Fig. 5C) showed a significantly higher MMR signal in symptomatic than asymptomatic mice. This difference became even more pronounced when the limbs of mice with clinical symptoms of arthritis were subgrouped into nonarthritic and arthritic ones. The mean level of radioactivity for the nonarthritic paws was virtually identical to that of paws of immunized mice that were completely without any symptoms (asymptomatic) and to that of paws of nonimmunized mice. Importantly, paws showing redness and swelling (arthritic) displayed a significantly higher signal than nonarthritic paws from the same symptomatic mice. The values obtained for the BCII10 Nanobody were consistently low and correspond to an increased retention of the control Nanobody associated with immunization and inflammation of limbs. After SPECT imaging, the mice were euthanized, paws were dissected, and residual radioactivity, represented as %IA/g, was measured (Fig. 5D). We observed a significantly higher signal in arthritic paws than in nonarthritic paws in the symptomatic mice. In contrast to the analysis from the images, levels of MMR Nanobody in nonarthritic paws of symptomatic mice were significantly elevated, compared with paws of immunized mice that had remained completely symptomless. Nanobody levels in the asymptomatic mice were comparable to those in naïve mice.
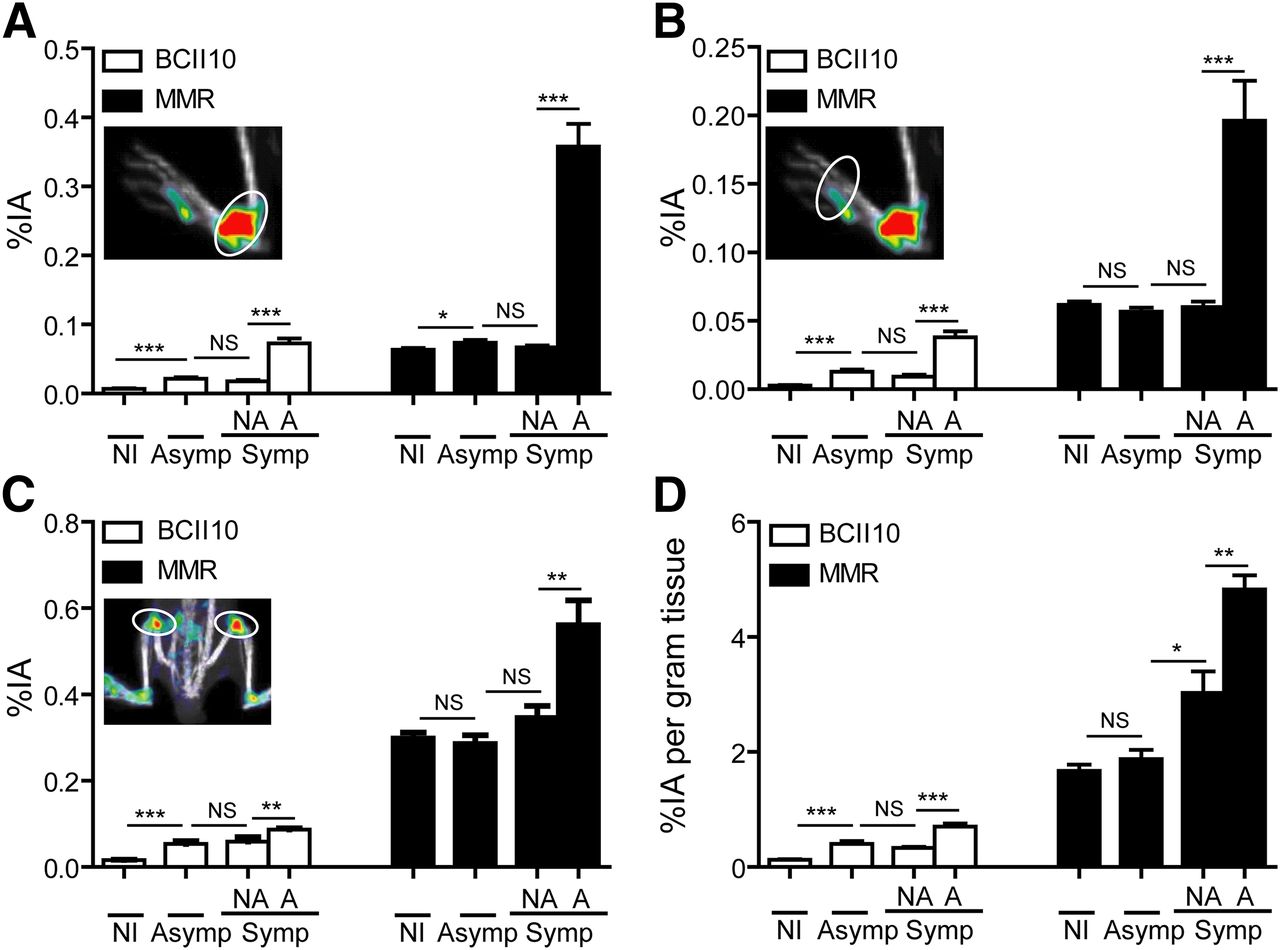
Quantification of 99mTc-labeled BCII10 or MMR Nanobody accumulation. (A–C) Radioactivity emitted by each area of interest (ankles [A], metatarsal joints [B], and knees [C]) was quantified, using AMIDE software, as %IA in groups of nonimmunized mice, immunized mice without symptoms (asymptomatic), and mice with symptoms of arthritis (symptomatic). Not all paws of symptomatic mice displayed clinical symptoms. Paws of these mice were therefore grouped into nonarthritic ones, showing no signs of arthritis, and arthritic ones, which did display redness and swelling. Inset images show quantified areas (circles). (D) After in vivo imaging, animals were sacrificed, paws were dissected, and radioactive content of paws was measured in γ-counter and expressed as %IA per gram of tissue. Bars represent means of 8–18 values (nonimmunized: n = 18; asymptomatic: n = 14; symptomatic/nonarthritic: n = 8; symptomatic/arthritic: n = 18) + SEM. *P < 0.05. **P < 0.01. ***P < 0.0001 Mann–Whitney U test. A = arthritic; NA = nonarthritic; NI = nonimmunized; NS = no significant difference.
DISCUSSION
The main imaging technique used for the diagnosis of RA is radiography, complemented more recently with MR scanning (3). Although these types of imaging are useful in the field of rheumatology, both methods lack the ability to provide information on specific cell types and molecules present in the area of interest at a particular moment in time. Molecular imaging could therefore be an important tool to increase our knowledge of RA pathogenesis and to find more effective ways of monitoring the disease. For instance, local inflammation in the joints of mice with early and established arthritis leads to an increased 18F-FDG accumulation, which is correlated with disease severity (4). In addition, 64Cu antibodies were able to visualize glucose-6-phosphate isomerase in joints of mice from the K/BxN mouse model of arthritis using small-animal PET (28). More specific attention was paid to markers associated with inflammatory conditions in studies using near-infrared antibody-guided imaging to visualize E-selectin (29), present on activated endothelium, and F4/80 (30), present on macrophages and eosinophils. Furthermore, Turk et al. demonstrated accumulation of activated macrophages in joints of rats with adjuvant-induced arthritis by γ-scintigraphy using folic acid–99mTc conjugates, which bind to the high-affinity folate receptor (31). Among the infiltrating cells in synovial tissues and fluid, macrophages constitute a subset of cells that differentiate into multinuclear osteoclasts, which are responsible for bone destruction in RA (32,33). In the present study, we imaged in an animal model of RA the distribution of MMR, a marker expressed by a subpopulation of macrophages and by osteoclasts (14,15). In our study, we confirmed the presence of macrophages in synovium and synovial fluid of arthritic mice. Moreover, we demonstrated that the expression of MMR was restricted to mature CD11b+F4/80+ macrophages, with percentages of cells and intensity of staining similar to those of splenocytes and lymph node cells. Other cells, isolated from bone marrow, lymph nodes, and spleen, showed various degrees of MMR expression levels corresponding to what has been described before (12,34–36). Osteoclast cells that were generated in vitro stained positively for MMR, and these data are in line with findings reported by Morishima et al. (15). However, in comparison with mature macrophages, the expression was only modest on osteoclasts; therefore, we concluded that MMR was not an ideal marker for this population.
As evident from our MMR expression profiles in various organs and cells obtained from mice with CIA, the receptor appears to be a valuable target for in vivo imaging of joint inflammation. Instead of using full-sized monoclonal antibodies as in previous reports of imaging arthritis, we opted for the use of Nanobodies to investigate MMR expression in vivo. Antibodies are known to cause high background signals because of their long residence time in the body and the presence of Fc receptors on certain cells (6). Nanobodies are smaller and lack Fc and will therefore quickly be eliminated from the body when not bound to antigens. Importantly, they can be produced recombinantly at high yield and are stable, making 99mTc labeling at elevated temperatures straightforward (11). Furthermore, Nanobodies have already been successfully used for the visualization of myeloid cells in vivo (7,10), and anti–TNF-α Nanobodies have proven to be successful for the treatment of CIA (37) and are being introduced in the clinic for the treatment of RA (38). The anti-MMR Nanobody used in this study has been successfully applied to image tumor-associated macrophages (12). When the biodistribution of 99mTc-labeled MMR-specific Nanobodies in naïve mice or mice with CIA was compared with the distribution of 99mTc-labeled control BCII10 Nanobodies, MMR was found to be specifically expressed in liver, lymph nodes, and spleen under homeostatic conditions. In mice with CIA, the binding of MMR Nanobodies was additionally seen at the site of immunization, in the knees, ankles, and metatarsal joints. Quantification of radioactivity confirmed the high binding of MMR Nanobody versus low retention of control antibody in each area of interest. With respect to the joint tissues, high MMR binding was observed in arthritic animals but only in limbs showing clinical symptoms of arthritis. Interestingly, on dissection of the paws, significantly higher levels of MMR-specific Nanobody were seen in nonarthritic paws of diseased animals than in mice that were free of symptoms. Such a difference was not observed for the control Nanobody, and therefore these data may be indicative of an incipient inflammation in the asymptomatic paws. The increased MMR Nanobody retention in the lymph node region seemed to be related to the severity of joint inflammation because, compared with asymptomatic mice, symptomatic mice showed an increase in MMR Nanobody retention. However, this phenomenon has yet to be studied further, because the currently observed trend did not yet reach adequate significance.
CONCLUSION
SPECT/micro-CT imaging with 99mTc-labeled Nanobodies directed against MMR is a useful tool for monitoring and quantifying joint inflammation in CIA, a mouse model for RA. MMR is present on a mature macrophage population in synovial fluid of arthritic joints, and the natural occurrence of MMR in other organs does not interfere with imaging of the inflamed limbs. Our findings encourage further investigations on the presence of MMR in joints of RA patients and are important when these Nanobodies will be considered for use in the clinic.
DISCLOSURE
The costs of publication of this article were defrayed in part by the payment of page charges. Therefore, and solely to indicate this fact, this article is hereby marked “advertisement” in accordance with 18 USC section 1734. This study was supported by grants from the government agency for Innovation by Science and Technology (IWT, Belgium) and the Concerted Research Actions of the Regional Government of Flanders (GOA). Tony Lahoutte is a senior clinical investigator of the Research Foundation Flanders (FWO). No other potential conflict of interest relevant to this article was reported.
Acknowledgments
We thank Cindy Peleman for technical assistance, Dr. Marleen Keyaerts for help with the imaging analyses, Anneleen Blykers and Dr. Catarina Xavier for help with the quality control experiments, and Alfons Billiau for reviewing the manuscript.
Footnotes
- © 2013 by the Society of Nuclear Medicine and Molecular Imaging, Inc.
REFERENCES
- Received for publication July 27, 2012.
- Accepted for publication November 26, 2012.


Jump to section
Related Articles
Cited By...
- Phase I Study of [68Ga]Ga-Anti-CD206-sdAb for PET/CT Assessment of Protumorigenic Macrophage Presence in Solid Tumors (MMR Phase I)
- Monitoring Therapy Response of Experimental Arthritis with Radiolabeled Tracers Targeting Fibroblasts, Macrophages, or Integrin {alpha}v{beta}3
- 99mTc-NTP 15-5 Imaging for Cartilage Involvement in Experimental Rheumatoid Arthritis: Comparison with Routinely Used Molecular Imaging Methods and Sensitivity to Chronic Nonsteroidal Antiinflammatory Drug Treatment
- Molecular Imaging with Macrophage CRIg-Targeting Nanobodies for Early and Preclinical Diagnosis in a Mouse Model of Rheumatoid Arthritis