


Abstract
90Y radioembolization is a promising therapy for patients with primary and secondary liver malignancies. Pretherapeutic assessment consists of hepatic angiography and 99mTc-macroaggregated albumin (99mTc-MAA) perfusion scintigraphy to estimate the liver-to-lung shunt and exclude extrahepatic 99mTc-MAA deposition. However, the predictive value of intratumoral 99mTc-MAA uptake remains unclear. Methods: One hundred four patients with chemotherapy-refractory liver-dominant metastatic colorectal cancer were treated with 90Y radioembolization between December 2006 and December 2010. All of the patients underwent angiographic assessment and perfusion scintigraphy with 99mTc-MAA before lobar 90Y radioembolization. For inclusion, patients must have undergone pretherapeutic and follow-up MR imaging (6 wk and 3 mo after radioembolization, respectively). The degree of intratumoral 99mTc-MAA uptake was rated, and liver metastases were classified according to changes in tumor diameter on both an individual and a patient basis using Response Evaluation Criteria in Solid Tumors (RECIST) 1.1. Response at both time points, MAA uptake, and catheter position were then statistically analyzed in a linear and generalized linear mixed model at a significance level of 0.05 (P value). Results: Sixty-six patients with a total of 435 colorectal liver metastases (mean number of lesions ± SD, 6.6 ± 2.8; mean lesion size ± SD, 33.8 ± 21.2 mm; lesion size range, 10–154 mm) were included in this analysis. According to the patient-based analysis, 3 patients had partial response, 49 stable disease, and 6 progressive disease after 6 wk. After 3 mo, 5 patients showed partial response, 26 stable disease, and 17 progressive disease. There was no association of patient-based tumor response with overall 99mTc-MAA uptake (P = 0.172) or with catheter position (P = 0.6456). Furthermore, an interaction effect of 99mTc-MAA uptake and catheter position in relation to tumor response was not found (P = 0.512). Moreover, in lesion-based analysis according to RECIST 1.1 there was no association of tumor response with degree of 99mTc-MAA uptake, catheter position, or interaction of 99mTc-MAA uptake and catheter position (P = 0.339, 0.593, and 0.658, respectively). Conclusion: Response to 90Y radioembolization was found to be independent of the degree of 99mTc-MAA uptake. Therefore, therapy should not be withheld from patients with colorectal liver metastases lacking intratumoral 99mTc-MAA accumulation.
Radioembolization with 90Y is a promising catheter-based liver-directed modality approved by the Food and Drug Administration for the treatment of patients with hepatic metastases of colorectal carcinoma (1–4). For this interventional technique, 90Y-embedded microspheres of glass or resin are infused directly into the hepatic arteries, where they become lodged within the tumor microvasculature and irradiate the tumor by β-emission (5).
Perfusion scintigraphy with 99mTc-labeled macroaggregated albumin (99mTc-MAA) is mandatory before 90Y radioembolization to identify extrahepatic visceral sites of tracer accumulation despite previous prophylactic microcoil embolization of extrahepatic vessels and to estimate the liver-to-lung shunt (5–8). For perfusion scintigraphy, SPECT has proven superior over planar scintigraphy, especially for the identification and topographic assignment of extrahepatic nuclide accumulation, particularly when coregistered with morphologic cross-sectional imaging (9–11). 99mTc-MAA has a particle size (10–50 μm; average particle size, 35 μm) comparable to resin microspheres (30–40 μm) and has therefore been propagated to simulate the expected microsphere distribution during 90Y radioembolization. However, contradictory results have been published concerning the suitability of 99mTc-MAA uptake to predict the response of hepatic tumors to hepatic artery infusion chemotherapy and 90Y radioembolization (12–16).
Therefore, the aim of this study was to evaluate whether the pattern of intratumoral 99mTc-MAA uptake in colorectal liver metastases was predictive for the response to 90Y radioembolization.
MATERIALS AND METHODS
Patients
Between December 2006 and December 2010, 104 patients (mean age ± SD, 60.9 ± 10.0 y; age range, 30–78 y) with extensive colorectal liver metastases were treated with 90Y radioembolization. All patients had not been suitable for resection and had no option for further systemic chemotherapy. This study was approved by the local Ethics Committee, and all patients gave written informed consent for their treatment as required. Before treatment, patients underwent contrast-enhanced thoracoabdominal CT MR imaging of the liver with hepatocyte-selective contrast medium for the assessment of tumoral and nontumoral liver volume, portal vein patency, and the presence of extrahepatic disease. All patients were assessed with digital subtraction angiography including prophylactic microcoil embolization of extrahepatic vessels before administration of 99mTc-MAA for perfusion scintigraphy. For inclusion in this analysis, patients must have undergone 90Y radioembolization with pretherapeutic MRI (not longer than 30 d) and follow-up MR imaging. Confluencing hepatic metastases and lesions smaller than 10 mm on baseline MR imaging were excluded. In addition, no more than 10 lesions per patient were evaluated. At our institute, 90Y radioembolization is routinely performed in 2 sessions as a sequential treatment beginning with the liver lobe with predominant tumor burden; thus, lesions identified on Bremsstrahlung tomography located outside the treatment area of Bremsstrahlung emission were also excluded.
MR Imaging Protocol
All MR examinations were performed on a 1.5-T MR system (Gyroscan, Intera; Philips Medical Systems) using a SENSE body coil (Philips). Imaging was performed at baseline immediately before 90Y radioembolization and at 6 wk and 3 mo after 90Y radioembolization. Examinations were performed with the following parameters: unenhanced T1-weighted imaging (gradient echo; repetition time [TR], 211 ms; echo time [TE], 3.3 ms; field of view [FOV], 450 cm; matrix, 256 × 144; SENSE factor, 2; and section thickness, 8 mm), T2-weighted fast-spin-echo imaging (TR, 1,600 ms; TE, 100 ms; flip angle [α], 80°; FOV, 450 cm; matrix, 384 × 196; SENSE factor, 2; and section thickness, 8 mm), and breath-hold axial single-shot echo planar diffusion-weighted T2-weighted fast-spin-echo imaging (TR, 1,850 ms; TE, 68 ms; b factors, 0 and 500 s/mm2; matrix, 112 × 111; FOV, 450 cm; section thickness, 8 mm; number of signal averages, 2; half scan factor, 0.608). Then, gadolinium ethoxybenzyl diethylenetriamine pentaacetic acid (0.1 mmol/kg body weight; Primovist [Schering]) was administered with an infusion rate of 1.5 mL/s, followed by a 30-mL saline flush. T1-weighted 3-dimensional fast-field-echo imaging sequences were acquired with the following parameters: TR, 3.9 ms; TE, 1.9 ms; α, 10°; FOV, 450 cm; matrix, 192 × 136; SENSE factor, 2; section thickness, 6 mm; and spectral adiabatic inversion recovery. For subsequent acquisitions, intervals allowing the patient’s free breathing were placed between the arterial and portal venous phases (20 s) and portal venous and equilibrium phases (i.e., interstitial) (40 s), respectively. T1-weighted 3-dimensional fast-field-echo and T1-weighted fast-spin-echo images (TR, 131 ms; TE, 5 ms; α, 70°; FOV, 450 cm; matrix, 256 × 135; SENSE factor, 2; and section thickness, 8 mm) at the hepatocyte-selective (delayed) phase were acquired 10 and 20 min after contrast material was administered.
Angiography and 99mTc-MAA Perfusion Scintigraphy
Angiography was performed to evaluate the vascular anatomy of the liver and to assess the vascularization of liver metastases before 90Y radioembolization. To avoid extrahepatic deposition of microspheres (e.g., to the gastrointestinal tract), all vessels of concern such as the gastroduodenal, right gastric, supraduodenal, falciform, and cystic artery were embolized before 99mTc-MAA assessment. 99mTc-MAA (99mTc-TechneScan LyoMAA; Covidien Deutschland GmbH, Neustadt a. d.) was injected nonselectively (artery of proper or common hepatic) as a single dose in 18 of 66 patients (27.3%) or in a selective way as a split dose in the remaining 48 of 66 patients (72.7%). In 40 of 48 patients, the 99mTc-MAA was applied in the right and left hepatic arteries, in 3 of 48 in the right hepatic artery only, in 1 of 48 in the right and middle hepatic arteries, and in 1 of 48 in the middle and left hepatic arteries. Mean applied activity for all patients was 153.4 ± 32.1 MBq of 99mTc-MAA. To avoid nonspecific tracer uptake in the abdomen due to free 99mTc, 600 mg of perchlorate were administered orally before angiography.
In all patients subject to 99mTc-MAA perfusion scintigraphy, planar whole-body images and SPECT images of the abdomen were acquired. Imaging was performed with a double-head SPECT γ-camera (e.cam 180°; Siemens Healthcare). Planar whole-body scintigraphy was performed with a 256 × 1,024 matrix at a scan speed of 10 cm/min. SPECT was performed within a 128 × 128 matrix with 64 projections over a 360° angle (30 s/projection) at an energy window of 140 keV (15% window width). For all imaging, low-energy high-resolution collimators were used. Tomograms were reconstructed by a 2-dimensional ordered-subset expectation maximization algorithm (17) with 8 iterations and 4 subsets. Attenuation correction was performed using the method of Chang (18), with the attenuation coefficient for water (μ = 0.15 cm−1). Subsequently, the manual rigid fusion of SPECT and MR images was performed using software (workstation: e.soft turbo; Siemens Medical Inc.) that included dedicated image-fusion (Fusion 7D; Mirada Medical).
90Y Radioembolization
90Y radioembolization using resin microspheres (SIR-Spheres; Sirtex Medical Europe) was performed sequentially starting with the liver lobe showing the predominant tumor load. Treatment over the right hepatic artery was performed in 48 of 66 patients (72.7%), over the left hepatic artery in 6 of 66 (9.1%), over the right and middle hepatic arteries in 6 of 66 (9.1%), over the left and middle hepatic arteries in 1 of 66 (1.5%), and over segmental hepatic arteries in 5 of 66 (7.6%). Overall, in 41 of 66 patients (62.1%), 90Y was applied in the identical vessel to 99mTc-MAA, whereas in the other 25 of 66 patients (37.9%) the position varied. The first treatment started 16.1 ± 11.0 d after 99mTc-MAA perfusion scintigraphy. Mean activity of the first treatment session for all patients was 1,146.5 ± 225.4 MBq of 90Y.
Bremsstrahlung Tomography
After 90Y radioembolization, the distribution of the resin microspheres was evaluated by Bremsstrahlung tomography in all patients. Images were recorded with the aforementioned double-head γ-camera equipped with medium-energy general collimators. SPECT was performed with 128 projections over a 360° angle (30 s/projection) using a 128 × 128 matrix. The energy window was chosen in accordance with the suggestions by Minarik et al. (19) in the energy range of 75 keV (20% window width) (20). Tomograms were reconstructed by a 2-dimensional ordered subset expectation maximation algorithm (17) with 8 iterations and 4 subsets. Attenuation correction was performed using the method of Chang (18), with a μ of 0.185 cm−1. In the case of metastases in both liver lobes, 90Y radioembolization of the contralateral lobe was performed after an interval of 4–6 wk.
Image Analysis
Images were analyzed by an experienced radiologist and nuclear medicine physician each in a consensus reading. MR images were analyzed on a PACS workstation (Infinitt Co., Ltd.). Lesions suitable for analysis were depicted on baseline MR images. Fused images of Bremsstrahlung tomograms and MR images were used to confirm that the identified lesions were located within the area of 90Y accumulation. The analysis was performed with dedicated image-fusion software (Fusion 7D Software; Mirada Medical). Metastases were numbered by placing electronic labels to assess lesion size of baseline and follow-up MR images simultaneously. The intratumoral 99mTc-MAA accumulation on fused MR images/99mTc-MAA SPECT images was classified into 4 groups (1, no intratumoral 99mTc-MAA uptake; 2, minimal 99mTc-MAA uptake with no signs of central necrosis on MR imaging; 3, profound 99mTc-MAA uptake throughout the lesion or uptake at the tumor margins in lesions with central necrosis; and 4, strong 99mTc-MAA uptake).
Statistical Analysis
Statistical analysis was performed using the software SAS 9.2 (SAS Institute Inc.). The degree of 99mTc-MAA uptake was classified as either low MAA (groups 1 and 2) or high MAA (groups 3 and 4). For patient-based analysis therapy, response of treated lesions was evaluated by Response Evaluation Criteria in Solid Tumors (RECIST) 1.1 (21). For lesion-based analysis, each lesion was analyzed according to RECIST 1.1. In addition, responding lesions (RLs), with a decrease in tumor diameter, and nonresponding lesions (NRLs), with an increase in tumor diameter, were categorized. For treatment response assessed with RECIST, a linear mixed model with 1 (concerning the follow-ups) or 2 (concerning the number of lesions per patient additionally) random effects was performed to evaluate the impact of 99mTc-MAA uptake, catheter position of 99mTc-MAA application, and their interaction on tumor response. For lesion-based analysis of changes in tumor size, a generalized linear mixed model with 2 random effects was applied. A P value of 0.05 was set to be the level of statistical significance. All tests were performed at full nominal test level.
RESULTS
Sixty-six of 104 patients (25 women, 41 men; mean age ± SD, 60 ± 10.3 y) with a total of 435 colorectal liver metastases (mean number of lesions ± SD, 6.6 ± 2.8; mean lesion size ± SD, 33.8 ± 21.2 mm; lesion size range, 10–154 mm) were included in this retrospective analysis. Thirty-eight patients had to be excluded from this analysis: in 18 patients, no follow-up MR image was available; 12 patients underwent pretherapeutic MR imaging more than 30 d before 90Y radioembolization; in 4 patients, metastases were not clearly distinguishable on follow-up MR imaging; in 2 patients, no hepatocyte-selective contrast medium was used for follow-up MR imaging; and in another 2 patients, SPECT data of perfusion scintigraphy were not available.
Of those 66 patients evaluated, the interval between initial MR imaging and 90Y radioembolization was 13.1 ± 8.4 d. Fifty-eight patients underwent follow-up MR imaging at 6 wk (43.8 ± 12.8 d) after therapy, 48 patients at 3 mo (94.7 ± 19.2 d) thereafter, and 41 patients at both time points.
In all patients, the liver-to-lung shunt was 6.6% ± 3.4%. Extrahepatic abdominal nuclide accumulation was found in 14 of 66 patients for perfusion scintigraphy, of which 6 patients required a reevaluation with angiography, additional coiling, and additional perfusion scintigraphy. In 8 patients, the causal vessel was identified retrospectively; thus, it was embolized at the time of 90Y radioembolization angiography or 90Y microspheres were given distal to the aberrant vessel.
Lesion-Based Analysis According to Changes in Tumor Diameter
Four hundred thirty-five (mean lesion size ± SD, 33.9 ± 21.2 mm) colorectal liver metastases were identified at initial MR imaging, of which 377 lesions (58 patients) and 290 lesions (48 patients) could be analyzed at 6 wk and 3 mo, respectively. At the 6-wk follow-up examination, 211 (mean lesion size in baseline MR imaging ± SD, 33.4 ± 19.7 mm; decrease in diameter, −15.6% ± 15.1%) of 377 liver metastases were classified as RL, and 166 lesions (mean lesion size in baseline MR imaging ± SD, 35.8 ± 24.1 mm; increase in diameter, 26.1% ± 26.8%) were categorized as NRL. At 3 mo, 290 metastases were assessed; 144 (mean lesion size in baseline MR imaging ± SD, 32.7 ± 20.3 mm; decrease in diameter, −20.1% ± 16.9%) of the 290 were classified as RL and 146 (mean lesion size in baseline MR imaging ± SD, 30.3 ± 17.9 mm; increase in diameter, 39.8% ± 45.1%) as NRL (Fig. 1). Although no significant association between therapy response and degree of 99mTc-MAA uptake was found, there was a tendency for an inverse correlation to yield better tumor response in low 99mTc-MAA uptake (P = 0.058). There was no significant impact of catheter position (P = 0.199), and no interacting effect of 99mTc-MAA uptake and catheter position on the therapy response was found (P = 0.998). Treatment response in relation to 99mTc-MAA uptake and catheter position are summarized in Table 1.

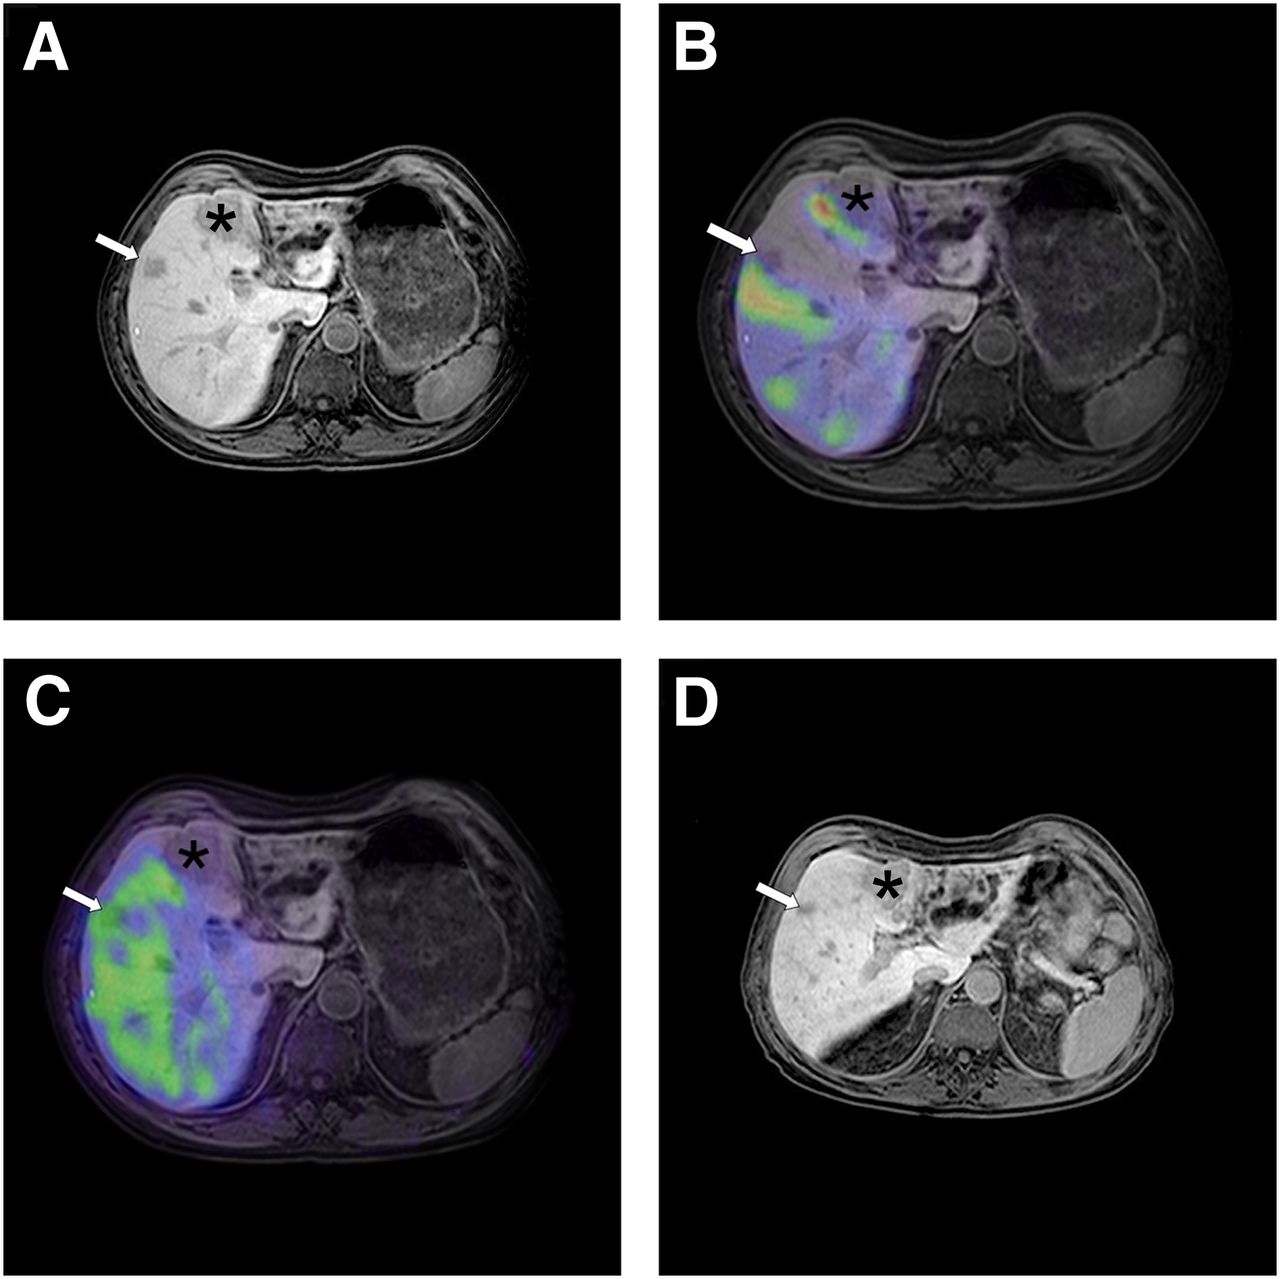
Sixty-six-year-old patient with hepatic metastases of colorectal carcinoma. Pretherapeutic contrast-enhanced MR imaging of liver (A) revealed in this axial slice intrahepatic lesion in segment 5 (arrow) and larger one in segment 4 (*). Perfusion scintigraphy using nonselective application of 99mTc-MAA by proper hepatic artery (B) revealed heterogeneous intrahepatic distribution of administered nuclide without intratumoral accumulation in both hepatic metastases (B). After selective 90Y radioembolization in right hepatic artery in sequential treatment plan, Bremsstrahlung scintigraphy was performed and fused with MR imaging. Pattern of 90Y-labeled microspheres showed relatively homogeneous distribution in right liver lobe with accumulation in metastasis in segment 5 (arrow) and no accumulation in metastasis in segment 4 (*) (C). On follow-up MR image (D), 6 wk after 90Y radioembolization there was clear decrease in size of treated metastasis in segment 5 (arrow) and stable situation of metastasis in segment 4 (*).
99mTc-MAA Uptake and Catheter Position in Relation to Lesion-Based Therapy Response
Lesion-Based Analysis According to RECIST 1.1
At 6 wk after 90Y radioembolization, tumor response in the treated liver lobe was rated as PR in 28 metastases (7.4%), as SD in 278 (73.7%), and as PD in 71 (18.8%). After 3 mo, 32 lesions (11.0%) were rated as PR, 164 (56.6%) as SD, and 94 as PD (32.4%). Again, no association of tumor response with the degree of 99mTc-MAA uptake was found (P = 0.339). In addition, no association of therapy response in relation to catheter position (P = 0.593) and no interacting effect of 99mTc-MAA uptake and catheter position on therapy response was found (P = 0.658). Treatment response in relation to 99mTc-MAA uptake and to catheter position is summarized in Table 2.
99mTc-MAA Uptake and Catheter Position in Relation to Lesion-Based Therapy Response According to RECIST 1.1 After 6 Weeks and 3 Months
Patient-Based Analysis
Three patients showed PR, 49 stable disease, and 6 PD after 6 wk. After 3 mo, 5 patients were classified as PR, 26 as SD, and 17 as PD. No association of tumor response with overall 99mTc-MAA uptake was found at either follow-up interval (P = 0.172).
In addition, a possible influence of a change in catheter position at evaluation angiography, as compared with 90Y application, was evaluated, but again no association of therapy response to the catheter position was found (P = 0.646). Furthermore, no interacting effect of 99mTc-MAA uptake and catheter position on therapy response was observed (P = 0.512). Tables 3 and 4 show treatment response at 6 wk and 3 mo, respectively, in relation to patient age, 99mTc-MAA activity, liver-to-lung shunt, 99mTc-MAA uptake, delivered 90Y activity, and catheter position.
Patient Demographics and Tumor Response Are Assessed by MR Imaging in Previously Treated Liver Lobe 6 Weeks After 90Y Radioembolization
Patient Demographics and Tumor Response Are Assessed by MR Imaging in Previously Treated Liver Lobe 3 Months After 90Y Radioembolization
DISCUSSION
The results of this study demonstrate that the pattern of intratumoral 99mTc-MAA uptake has no predictive value for the 90Y radioembolization therapy response in patients with colorectal liver metastases. At first, this finding may come as a surprise because a locoregional transarterial treatment such as 90Y radioembolization takes advantage of the aspect that liver metastases derive most of their blood supply from the hepatic artery whereas the hepatic parenchyma receives its supply predominantly from the portal vein (22). For transcatheter arterial chemoembolization as another locoregional transarterial treatment for patients with hypervascularized tumors such as hepatocellular carcinoma (HCC), it is well accepted that its success is highly dependent on the tumor vascularization, so that this treatment modality has become the standard of care in patients with intermediate-stage HCC (23). Consequently, it has been postulated that the mechanism of action for 90Y radioembolization is flow-directed deposition of 90Y microspheres into the vascular tumor bed and irradiation of the tumor by β− emissions of 90Y while the normal liver parenchyma is largely spared, thus combining the effects of interstitial high-dose radiotherapy and arterial microembolization (2,24). Nevertheless, the results of this study were obtained exclusively in patients with colorectal liver metastases, which can display various degrees of tumor vascularization and deposition of 99mTc-MAA and 90Y microspheres (25).
Angiogenesis is a complex but fundamental requirement for tumor growth, invasion, and spread of metastases allowing newly formed metastatic nodules to rapidly coopt existing host vessels (26,27). Microvessel density analysis as an indicator of angiogenesis has been well described because it may resemble a prognostic factor and correlate with the aggressiveness and metastatic potential of solid tumors (28). Although it has been acknowledged that tumor vascularization of colorectal liver metastases is highly abnormal, a considerable heterogenity of the density of small tumor vessels at the liver-to-tumor interface (which represents the target area for 90Y microspheres) has been reported (28,29). Furthermore, the radiographic vascular appearance of liver metastases does not affect survival after 90Y radioembolization (30). Regarding the difference between the pattern of 99mTc-MAA and 90Y microsphere deposition, several factors have to be addressed. Although the particles display almost similar sizes (10–50 μm for 99mTc-MAA and 30–40 μm for resin microspheres), the number of particles infused is highly different. Although approximately 150,000 99mTc-MAA particles were infused for perfusion scintigraphy, the mean activity of a lobar liver dose of resin microspheres administered in this study was 1.14 GBq, which contains approximately 23 million microspheres (assuming an activity of 50 Bq per microsphere). As a result, the hepatic vasculature of the treated liver lobe is flooded with approximately 300 times more particles during 90Y radioembolization. Even in hypovascular lesions assessed as low MAA with 99mTc-MAA, a sufficient amount of 90Y microspheres get lodged in the tumor microvasculature to induce relevant antitumor effects. Liver biopsies obtained from colon cancer metastases previously treated with resin microspheres showed an incongruent deposition, with the majority being located near tumor nodules. Although similar numbers of spheres were found at the tumor center and normal liver, the periphery of the tumor contained a 200-times greater concentration of spheres, with microspheres typically grouped in clusters of a few to several dozen spheres per cluster (31,32). In analyses of HCC patients who received resin microspheres, dose calculations based on measurements performed during laparotomy yielded doses between 34 and 1,474 Gy for tumor tissue whereas normal liver parenchyma received 9–75 Gy, resulting in a ratio of the number of microspheres seen in the tumor periphery, compared with nonneoplastic liver tissue (T:N ratio), of 0.4:1 up to 45:1 (33). A similar microsphere deposition can be observed in colorectal carcinoma although at a much lower level than in HCC, with T:N ratios ranging from 2:1 to 2:5 (24). Despite the obviously unavoidable deposition of microspheres in regular liver tissue, an analysis by Ruehl et al. has shown that small amounts of microspheres in normal liver parenchyma are generally well tolerated, and radioembolization-induced liver disease occurs infrequently if 90Y radioembolization is performed as a sequential lobar treatment (34).
Obviously, no histologic data are available on the intrahepatic distribution pattern of 99mTc-MAA; thus, the interpretation of the pattern is dependent on SPECT imaging. No relation could be found in our patients when the distribution pattern in both of the SPECT images and the corresponding lesional follow-up image were visually compared. This observation implies that in 99mTc-MAA SPECT no prediction of response in colorectal carcinoma is possible. Therefore, pretherapeutic dosimetric calculations based on 99mTc-MAA imaging, as reported for HCC (7,35), should be seen critically.
Taken together, according to our data it is not possible to predict the MR imaging–based therapy response from the degree of intratumoral 99mTc-MAA uptake in perfusion scintigraphy. There is increasing evidence of a clinically relevant discrepancy of tumor response evaluation with metabolic 18F-FDG PET, as compared with traditional cross-sectional imaging (36). Recently, it has been shown that 18F-FDG PET can predict survival of breast cancer patients with hepatic metastases after 90Y radioembolization (37). In a small group of 8 patients with colorectal liver metastases who underwent 90Y radioembolization, the degree of 99mTc-MAA uptake was found to correlate with the metabolic response as assessed with 18F-FDG PET (15). Unfortunately, 18F-FDG PET/CT is not routinely performed in patients scheduled for 90Y radioembolization at our institute, so that we cannot contribute with additional data to these interesting findings.
CONCLUSION
Our results demonstrate that in patients with colorectal liver metastases, therapy response after 90Y radioembolization was independent of the degree of intratumoral 99mTc-MAA uptake. Consequently, therapy should not be withheld from patients with colorectal liver metastases lacking intratumoral 99mTc-MAA accumulation.
DISCLOSURE
The costs of publication of this article were defrayed in part by the payment of page charges. Therefore, and solely to indicate this fact, this article is hereby marked “advertisement” in accordance with 18 USC section 1734. No potential conflict of interest relevant to this article was reported.
Footnotes
↵* Contributed equally to this work.
Published online Feb. 27, 2013.
- © 2013 by the Society of Nuclear Medicine and Molecular Imaging, Inc.
REFERENCES
- Received for publication August 8, 2012.
- Accepted for publication October 15, 2012.


Jump to section
Related Articles
Cited By...
- Partition Model-Based 99mTc-MAA SPECT/CT Predictive Dosimetry Compared with 90Y TOF PET/CT Posttreatment Dosimetry in Radioembolization of Hepatocellular Carcinoma: A Quantitative Agreement Comparison
- Reply: High Impact of Preferential Flow on 99mTc-MAA and 90Y-Loaded Microsphere Uptake Correlation
- Predictive Value of 99mTc-MAA SPECT for 90Y-Labeled Resin Microsphere Distribution in Radioembolization of Primary and Secondary Hepatic Tumors
- Systematic Evaluation of Tumoral 99mTc-MAA Uptake Using SPECT and SPECT/CT in 502 Patients Before 90Y Radioembolization
- Pretreatment Dosimetry in HCC Radioembolization with 90Y Glass Microspheres Cannot Be Invalidated with a Bare Visual Evaluation of 99mTc-MAA Uptake of Colorectal Metastases Treated with Resin Microspheres
- Reply: Pretreatment Dosimetry in HCC Radioembolization with 90Y Glass Microspheres Cannot Be Invalidated with a Bare Visual Evaluation of 99mTc-MAA Uptake of Colorectal Metastases Treated with Resin Microspheres
- Results Confounded by a Disregard for Basic Dose-Response Radiobiology
- Reply: Value of 99mTc-Macroaggregated Albumin SPECT for Radioembolization Treatment Planning
- Reply: Results Confounded by a Disregard for Basic Dose-Response Radiobiology
- Value of 99mTc-Macroaggregated Albumin SPECT for Radioembolization Treatment Planning