


Abstract
Neuroreceptor imaging in the nonhuman primate (NHP) is valuable for translational research approaches in humans. However, most NHP studies are conducted under anesthesia, which affects the interpretability of receptor binding measures. The aims of this study were to develop awake NHP imaging with minimal head restraint and to compare in vivo binding of the γ-aminobutyric acid type A (GABAA)-benzodiazepine radiotracer 11C-flumazenil under anesthetized and awake conditions. We hypothesized that 11C-flumazenil binding potential (BPND) would be higher in isoflurane-anesthetized monkeys. Methods: The small animal PET scanner was fitted to a mechanical device that raised and tilted the scanner 45° while the awake NHP was tilted back 35° in a custom chair for optimal brain positioning, which required acclimation of the animals to the chair, touch-screen tasks, intravenous catheter insertion, and tilting. For PET studies, the bolus–plus–constant infusion method was used for 11C-flumazenil administration. Two rhesus monkeys were scanned under the awake (n = 6 scans) and isoflurane-anesthetized (n = 4 scans) conditions. An infrared camera was used to track head motion during PET scans. Under the awake condition, emission and head motion-tracking data were acquired for 40–75 min after injection. Anesthetized monkeys were scanned for 90 min. Cortisol measurements were acquired during awake and anesthetized scans. Equilibrium analysis was used for both the anesthetized (n = 4) and the awake (n = 5) datasets to compute mean BPND images in NHP template space, using the pons as a reference region. The percentage change per minute in radioactivity concentration was calculated in high- and low-binding regions to assess the quality of equilibrium. Results: The monkeys acclimated to procedures in the NHP chair necessary to perform awake PET imaging. Image quality was comparable between awake and anesthetized conditions. The relationship between awake and anesthetized values was BPND (awake) = 0.94 BPND (anesthetized) + 0.36 (r2 = 0.95). Cortisol levels were significantly higher under the awake condition (P < 0.05). Conclusion: We successfully performed awake NHP imaging with minimal head restraint. There was close agreement in 11C-flumazenil BPND values between awake and anesthetized conditions.
Neuroreceptor imaging in nonhuman primates (NHPs) with PET has been a pivotal translational approach to understanding pharmacologic effects on neurotransmitter systems related to neuropsychiatric illness such as Parkinson disease, dementia, and substance abuse (1–3). However, a limitation of this approach is that human PET studies are performed in the conscious state, whereas most of NHP PET studies are conducted under anesthesia. Although anesthesia helps control head motion, agents such as isoflurane have been shown to affect neuroreceptor outcome measures by increasing endogenous neurotransmitters or altering receptor availability (4).
PET imaging has been performed successfully in conscious NHPs with an acrylic cap surgically implanted onto the skull, as a means of head restraint, by Tsukada and others. This approach limits the applicability of awake NHP imaging by requiring an invasive surgical procedure and potentially increasing animal stress during imaging. For each scan, the implant is fixed to the monkey chair after temporary sedation, a process that can potentially affect receptor binding measures.
We proposed a novel awake imaging approach using minimal head restraint to permit a wide-range of head movement during the scan. The approach is noninvasive, is less restrictive, and completely eliminates the use of anesthesia. To correct for the rapid NHP head motion, we adapted the Vicra motion-correction technology (NDI) used in human studies in the high-resolution research tomograph (5) to awake NHP imaging in the Focus-220 small animal PET scanner (Siemens/CTI). The animals were trained in a customized NHP chair for acclimation to the PET scan environment, before scanning, thus obviating the need for anesthesia.
The aim of this study was to develop an appropriate methodology to execute awake NHP PET brain imaging with minimal head restraint. The Focus-220 scanner was fitted to a mechanical device that raised and tilted the scanner while the awake NHP was tilted back in the chair for optimal brain positioning. This procedure required acclimation of the animals to the chair, touch-screen tasks, intravenous catheter insertion, and tilting. The Vicra infrared camera (http:www.ndigital.com/medical/polarisfamily.php) tracked its reflective tool that was noninvasively mounted atop the animal’s head. During the scan, emission and motion data were acquired simultaneously. We intended the methods we developed to be minimally stressful to the subject and hence took cortisol measurements during the scans to index the levels of stress.
We tested the utility of this novel imaging paradigm with the γ-aminobutyric acid type A (GABAA)-benzodiazepine (BDZ) receptor antagonist 11C-flumazenil. A bolus–plus–constant infusion (B/I) injection schedule for 11C-flumazenil was optimized (6) for awake scanning during the equilibrium phase of the tracer; this reduced the scan time and eliminated the need for arterial input data. Equilibrium analysis was used to determine nondisplaceable binding potential (BPND), a neuroreceptor binding measure of the ratio of specific to free plus nonspecific receptor radioligand binding at equilibrium (7). In this evaluation, we hypothesized that 11C-flumazenil BPND would be higher under the isoflurane anesthesia condition than the awake condition. This hypothesis was based primarily on a human study that showed that isoflurane produced a dose-dependent increase in 11C-flumazenil distribution volume in comparison to awake controls (8). One potential mechanism for this effect is anesthesia-induced increases in GABA; increased GABA levels have been shown to enhance the affinity for ligands to the BDZ site, coined the GABA shift (9). Evidence that the GABA shift is detectable with 11C-flumazenil PET has been provided by a recent human study using tiagabine, a GABA membrane transporter blocker (10). Thus, an increased affinity for GABAA-BDZ receptors due to isoflurane should produce an increase in 11C-flumazenil BPND, compared with the awake condition.
MATERIALS AND METHODS
Animals
Studies were performed with 2 rhesus monkeys (Macaca mulatta) (1 female, 1 male; mean weight ± SD, 10.4 ± 4.4 kg; mean age, 10.2 ± 4.2 y). Each monkey underwent 3 awake scans and 2 anesthetized scans. The animals were fasted on all scan days. The study protocol was approved by the Yale University Institutional Animal Care and Use Committee. Animals were housed and maintained in accordance with federal guidelines for the care and use of NHPs and provided with enrichment on a regular basis.
Awake NHP Training and Acclimation to Scan Environment
An overview of the awake study setup with the Focus-220 small animal PET scanner is shown in Figure 1. The scanner was fitted with a mechanical lifter-tilter designed to raise and rotate the scanner up to an operational limit of 45°. For optimal positioning of the brain in the field of view (FOV), the animals learned to tilt back 35° in the custom NHP chair while the Focus-220 was tilted forward. The Vicra motion-tracking camera (NDI) tracked a remote tool at 20 Hz (Fig. 1A, inset) during the PET acquisition. This device was attached to a silicone rubber plug and adhered to the NHP’s shaved scalp before each scan and was easily removed after the scan. The computer-controlled pump for tracer administration is shown in Figure 1B.
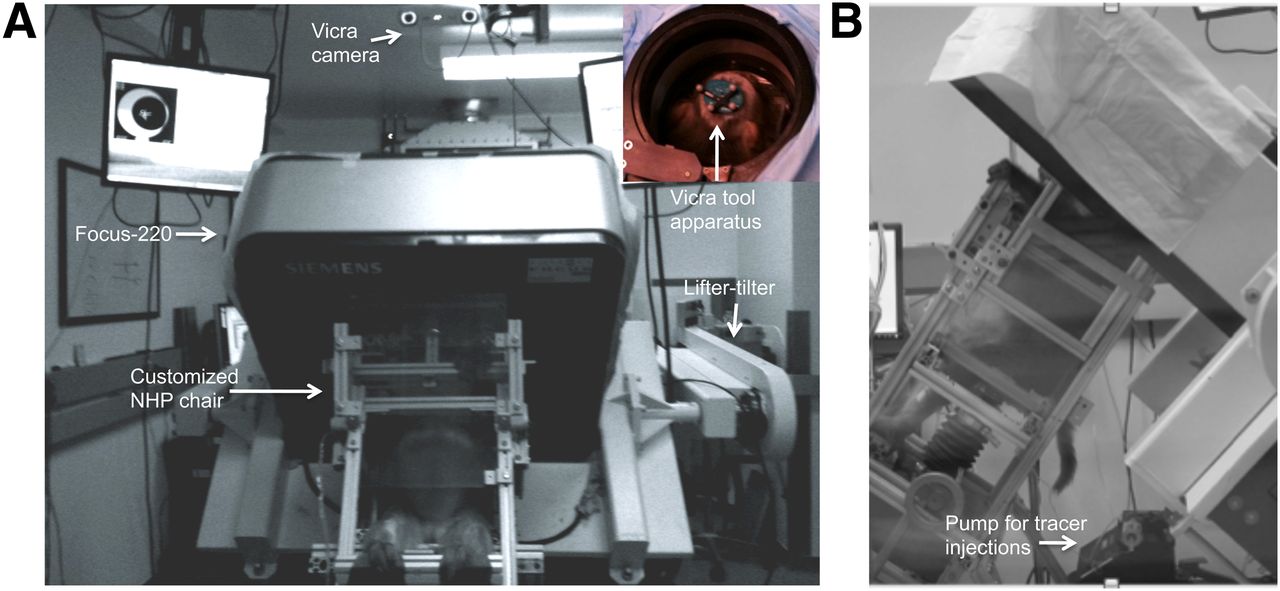
Overview of awake study setup in Focus-220 suite. (A) Front view and Vicra camera view of tool apparatus on animal’s head from behind Focus-220 (inset). (B) Side view of monkey sitting in NHP chair tilted in scanner.
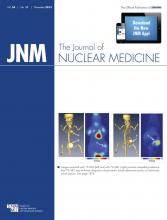
The following describes the training and acclimation steps in preparation for the awake PET scan procedure. Monkeys were first trained in the custom NHP chair (Fig. 2A). Animals were initially trained to transfer into the chair from their home cage for food reward. Next, NHPs were brought into a training room to learn a series of procedures. A touch-screen was mounted to the chair to enable the NHP to learn to touch the screen for food and juice reward from the lick tube. Next, NHPs were trained to accept a neck plate, which permitted a wide range of head movement. The neck plate, made of polycarbonate, was slid behind the neck and fastened to the chair with screws. To allow for intravenous catheter insertion necessary for tracer injection or blood sampling, the monkeys were acclimated to having their feet secured to the foot bar with vet wrap. For preparation for the Vicra tracking-tool placement, the animal’s head was shaved and a rigid, silicone rubber plug was adhered to the scalp with actor’s skin glue. Training for these procedures took a minimum of several weeks, with approximately 3 sessions per week. Several animals were screened for eligibility to perform awake imaging, where the animals excluded were typically not juice- or food-motivated or required more than 2 mo to acclimate to an awake procedure (e.g., chair transfer from cage or neck plating).

Custom NHP chair and Focus-220 mock scanner. (A) NHPs were acclimated to a custom chair designed for scanning in Focus-220. (B) Focus-220 mock scanner was used for training NHPs to tilt backward while mock scanner was slowly lowered over head.
Next, the animals were trained in the mock Focus-220 scanner to tilt backward as the chair was attached to a mini ramp (Fig. 2B). The mock scanner was slowly lowered as the monkey continued to perform a task on the touch-screen. After a few tilting sessions in the mock scanner, the animals were brought into the Focus-220 scan room to practice the steps of the B/I awake scan procedure, where scan acquisition occurs during the equilibrium phase of the tracer. For each NHP, there were several practice sessions of the awake scan procedure, with at least 2 performed with saline infusions. Once the animal was familiar with all procedures and was able to stay tilted in the scanner for a sufficient period of time, the awake 11C-flumazenil scans were performed.
PET Experiment
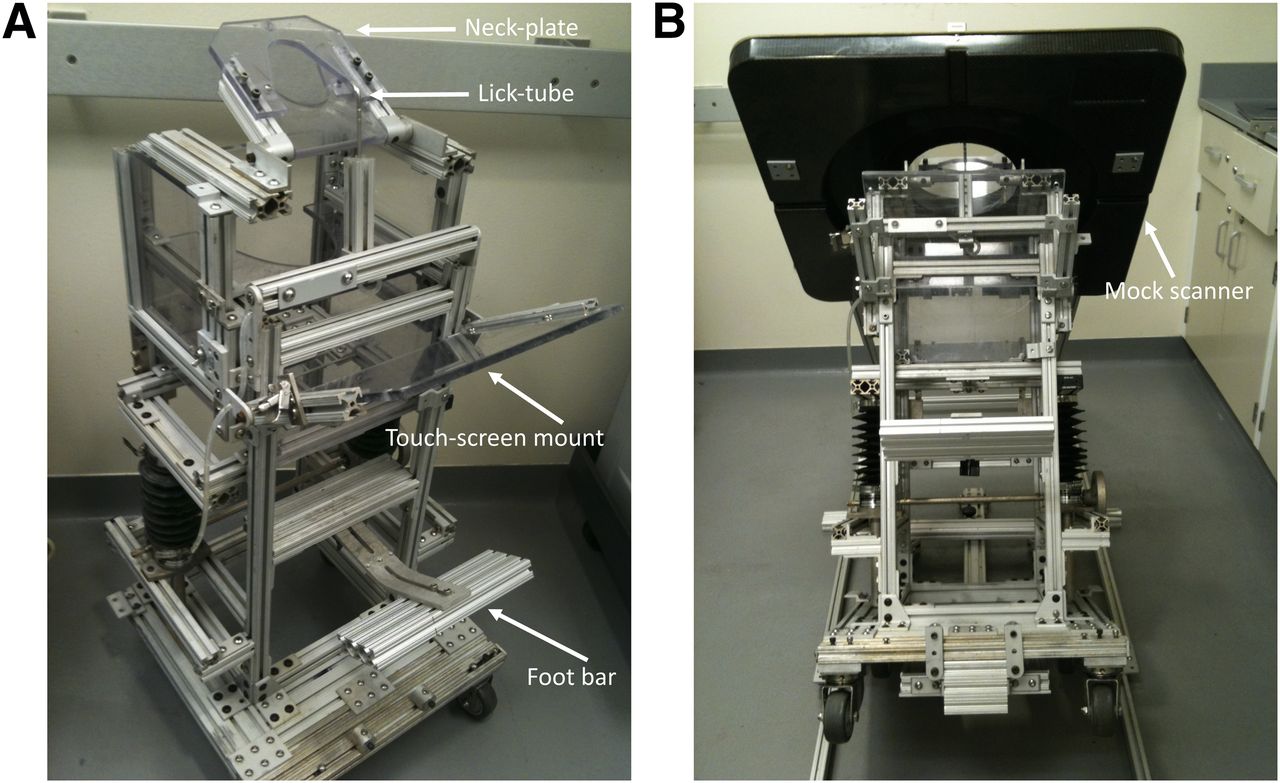
PET scans were obtained on the Focus-220 small animal scanner (full width at half maximum, ∼1.5 mm). Study designs are shown in Figure 3. 11C-flumazenil was injected as a B/I using a computer-controlled pump (Harvard Apparatus, Inc.). The appropriate B/I schedule was determined by the parameter Kbol (min). Specifically, the magnitude of the bolus portion of tracer delivery is equal to the infused amount over Kbol min. B/I curves can be estimated, and an optimal Kbol can be chosen using time–activity curves from a bolus study (6). Under the anesthetized condition, emission data were acquired for 90 min after injection. Under the awake condition, emission data were acquired for approximately 40–75 min after injection during the equilibrium phase of the tracer. However, 11C-flumazenil was administered as a 3-min bolus for 1 awake scan where emission data were acquired for 75 min after injection.

11C-flumazenil B/I study design for anesthetized (A) and awake (B) scans.
The anesthetized scans were repeated on the same day, with a 3.5-h interval between the 2 radiotracer injections. For the anesthetized scans (Fig. 3A), animals were initially immobilized with ketamine hydrochloride (10 mg/kg, intramuscularly), then transported to the PET suite for scan preparation 2 h before the initial 11C-flumazenil injection. Once intubated, the animals were maintained on oxygen and isoflurane (∼2%) anesthesia throughout both scans. A 9-min transmission scan preceded each of the emission scans. 11C-flumazenil was administered as a B/I with a Kbol of 90 min, and emission data were collected for 90 min.
The timing for the awake scan procedures (Fig. 3B) relative to tracer injection at 0 min proceeded as follows: animals were transported in the NHP chair from their cage and brought to the Focus suite before 11C-flumazenil injection (−30 min). Once the neck plate and catheter were placed (−25 to −10 min), the chair was secured to the ramp, and the touch-screen was mounted (−10 to 0 min). 11C-flumazenil was administered as a B/I (0 min) while the monkey performed a touch-screen task with juice reward (0 min on). For these studies, the initial Kbol value was set to 90 min, the value used in the anesthetized scan. Subsequent examination of the data suggested that a Kbol of 60 min was more appropriate for awake scans, based on analysis of data from the single awake bolus scan, and this value was used in the ensuing awake scans.
The Vicra tool, attached to a silicone rubber plug, was adhered to the head of the animal via actor’s skin glue (+20–25 min) (Fig. 1, inset). Then, the NHP chair was tilted back 35°, and the preraised scanner was tilted forward 45° (30 min). With the animal’s head positioned in the scanner FOV, the Vicra infrared motion-tracking acquisition commenced, followed by the emission acquisition (∼35–75 min after injection). Transmission scans were not acquired for the awake studies.
Radiochemistry
11C-flumazenil was prepared from a reaction of desmethylflumazenil (∼0.5 mg) with 11C-methyl iodide in anhydrous N,N-dimethylformamide and aqueous KOH (12 N, 8 μL). Synthesis was performed using either the AutoLoop synthesis module (Bioscan Inc.) or the TracerLab FxC-Pro module (GE Healthcare). The crude reaction mixture was purified by semipreparative high-performance liquid chromatography (column: LUNA C18 [Phenomenex], 10 μm, 10 × 250 mm; mobile phase: 25% acetonitrile and 75% 0.1 M ammonium formate with 0.5% acetic acid, pH 4.2 [v/v]; flow rate: 5 mL/min). The product peak at approximately 12.5–13.5 min was collected, diluted with 50 mL of deionized water, and loaded onto a Waters C18 Classic SepPak cartridge. The cartridge was washed with 10 mL of 0.001N HCl. The product was eluted off the SepPak with 1 mL of EtOH, followed by 3 mL of saline, into a sterile vial containing 7 mL of saline and 40 μL of 4.2% NaHCO3 solution via a Millipore GV filter (0.22 μm, 33 mm). Radiochemical purity of the final product was greater than 99%, with specific activity of 248.27 ± 162.06 MBq/nmol (6.71 ± 4.38 mCi/nmol) at the end of synthesis. Radiochemical yield was 4,218.0 ± 1,972.1 MBq (114.0 ± 53.3 mCi).
Cortisol Measurements
Blood samples were taken for measurements of cortisol levels, as an indicator of stress, during 1 awake and both anesthetized scans for each monkey. In the awake scan, 2 mL of venous samples were collected every 10 min until the end of the scan. For the anesthetized scans, 2-mL samples were collected at 10-min intervals beginning approximately 30 min before tracer injection. Samples were centrifuged at 2,930g for 5 min and sent for analysis (ANTECH Diagnostics). Within and between animals, statistical analysis between awake and both anesthetized groups was performed with 2-tailed, unpaired t tests with a P value of less than 0.05.
MR Scanning and Processing
MR images were acquired on a Siemens Magnetom 3.0T Trio scanner in anesthetized animals (∼2% isoflurane), using an extremity coil. T1-weighted images were acquired in the coronal plane with a spin echo sequence (echo time, 3.34; repetition time, 2,530; flip angle, 7°; section thickness, 0.50 mm; FOV, 140 mm; image matrix, 256 × 256 × 176 pixels; and matrix size, 0.55 × 55 × 0.50 mm). The MR images were stripped of skull and muscle so that only the brain remained in the image (FMRIB’s [Functional Magnetic Resonance Imaging of the Brain] Brain Extraction Tool, http://www.fmrib.ox.ac.uk/fsl/bet2/index.html). This procedure was performed once for each monkey before coregistration with the PET images.
PET Image Reconstruction and Processing
List-mode data were collected and reconstructed using filtered backprojection with a Shepp filter with cutoff at 30% of the Nyquist frequency and with all corrections (attenuation, normalization, scatter, randoms, and dead time). Final image dimensions and voxel sizes were 256 × 256 × 95 and 0.95 × 0.95 × 0.80 mm, respectively. Data from the anesthetized scans were directly reconstructed into a sequence of 27 frames: 6 × 30 s, 3 × 1 min, 2 × 2 min, and 16 × 5 min.
Awake list-mode data were reconstructed with motion correction performed via the multiacquisition frame-based (MAF) method (11). The list-mode and motion data were time-synced, and the motion data were used to divide the list-mode data into subframes based on an intraframe motion threshold (IFMT) and a minimum subframe duration threshold (MFDT) (12). The IFMT defined the maximum motion permitted within a frame, and the MFDT defined the minimum frame duration. Thus, periods of large, fast motion were dropped. Motion data consisted of transformation matrices at 20 Hz, and each transformation was applied to 8 points chosen as the vertices of a rectangle in the center of the FOV to compute a measure of intraframe motion magnitude (mm). A new subframe was started when the IFMT exceeded 2 mm, keeping subframes with an MFDT of 3 s.
Each subframe image was first reconstructed without attenuation and scatter correction. The subframes were then rigidly aligned to a common awake reference space, using the averaged transformation matrix within each subframe. For attenuation correction, a transmission image of the same animal from an anesthetized study was used. The transmission image was mapped into the awake reference space by registering the non–attenuation-corrected PET summed images of the anesthetized (aligned to the transmission) and the awake reference scans to the MR image and multiplying the 2 transforms (13). With the transmission image in the reference position, the inverse of the transformation matrices were applied to create a new transmission image for the individual subframes to reconstruct each with attenuation and scatter correction. Then, these fully corrected subframes were transformed back to the reference position and were summed to produce standard-duration frames (5 × 5 min).
For PET–to–MR image alignment, summed PET images acquired under awake and anesthetized conditions were registered to each animal’s MR image via a 6-parameter rigid registration using normalized mutual information in FMRIB Library Tool (FSL) FLIRT (FMRIB’s Linear Image Registration Tool, www.fmrib.ox.ac.uk/fsl/flirt/index.html). Summed (50–75 min) PET images from awake scans were registered to the MR image, whereas summed PET images from anesthetized scans were chosen with the Multitransform method (14) and were registered to the MR image. An affine plus nonlinear registration was performed (Bioimage Suite 2.5; http://www.bioimagesuite.org/index.html) for each MR image to a high-resolution NHP MR template where ROIs were defined. PET images were resliced to template space via the 2 transforms—that is, PET-to-MR and MR-to-template. The following regions were taken from the template: amygdala (0.10 mL), cerebellum (5.9 mL), cingulate cortex (0.64 mL), frontal cortex (2.5 mL), insula (0.96 mL), occipital cortex (5.2 mL), pons (0.33 mL), temporal cortex (3.2 mL), and thalamus (0.25 mL).
Equilibrium Analysis
To determine the quality of equilibrium, time–activity curves were assessed in the occipital cortex and pons regions, the highest and lowest binding regions, respectively, to measure percentage change per min (%Δ/min = slope/mean concentration × 100) for anesthetized scans (Kbol = 90 min, n = 4), awake scans (Kbol = 90 min, n = 3), and awake scans (Kbol = 60 min, n = 2).
BPND images were computed with the pons as the reference region using equilibrium analysis between 50 and 75 min as: Eq. 1where CROI and CREF are the mean concentrations (Bq/mL) in the ROI and the pons reference region, respectively. BPND was computed as an average of the voxel values in each ROI. For B/I studies, mean BPND images were computed across replicates and monkeys for the anesthetized and awake scans, where a correction factor was applied to the initial awake studies acquired with a Kbol of 90 min, because these were not quite at equilibrium (supplemental data; supplemental materials are available at http://jnm.snmjournals.org). The single awake bolus study was analyzed with the simplified reference tissue model (15). Percentage change in mean BPND (%ΔBPND) between conditions was computed as
 Eq. 2
Eq. 2
Statistical analysis of between-group differences was performed with 2-tailed, unpaired t tests with a P value less than 0.05, without correction for multiple comparisons, where ROI BPND values were treated independently.
RESULTS
To assess the quality of equilibrium for B/I studies with 11C-flumazenil, time–activity curves in the high (occipital cortex)- and low (pons)-binding regions were analyzed. Mean %Δ/min were slightly positive for anesthetized scans (n = 4) in the occipital cortex (+0.29 ± 0.18) and pons (+0.47 ± 0.48) with a Kbol of 90 min. Mean %Δ/min were negative for awake scans (n = 3) in the occipital cortex (−0.34 ± 0.38) and pons (−1.00 ± 1.96) using the same infusion schedule (Kbol = 90 min). Kbol was adjusted to 60 min for the subsequent awake B/I scans (n = 2), as determined from the awake bolus scan time–activity curves, and %Δ/min in the time–activity curves improved in the occipital cortex (+0.22 ± 0.91) and pons (+0.51 ± 1.33), which was similar to the anesthetized values.
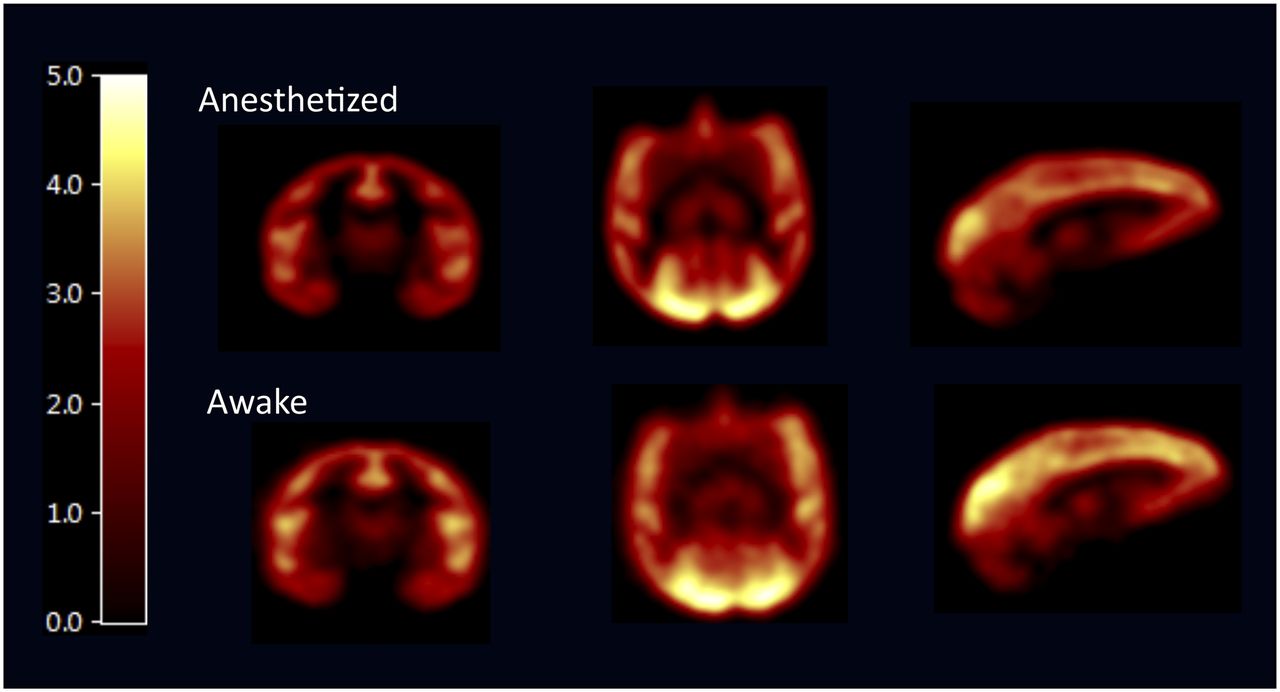
Mean BPND images of 11C-flumazenil show moderately higher binding in awake than anesthetized studies (Fig. 4) where

Comparison of BPND images in anesthetized and awake studies. Mean BPND images of 11C-flumazenil were computed from B/I studies in anesthetized (n = 4) and awake NHPs (n = 5). Images are post-smoothed with 3-mm gaussian kernal and displayed on common scale after registration to NHP template.
Mean BPND values in ROIs and %ΔBPND are shown in Table 1. BPND was slightly higher in the awake than anesthetized condition in all regions except for the cerebellum and temporal cortex, but this difference was not significant. The largest %ΔBPND was observed in the amygdala.
Regional 11C-Flumazenil BPND Values from Anesthetized and Awake Studies
Results for cortisol analysis are shown in Table 2, with statistical comparisons shown within monkeys between awake and both anesthetized conditions. Cortisol levels were statistically higher in the awake than in the anesthetized condition. Between animals, monkey 1 had higher cortisol levels than monkey 2 in both conditions. For monkey 1, cortisol levels were significantly higher during the awake scan than during the 2 anesthetized scans, which had comparable cortisol levels. For monkey 2, cortisol levels were significantly higher during the awake scan than during the first but not the second anesthetized scan. Each pair of anesthetized scans was obtained in 1 d. Because cortisol is a measure of stress that may be linked to GABA function, 11C-flumazenil binding may be altered in awake scans, compared with anesthetized scans (see the “Discussion” section).
Cortisol Levels (μg/dL) from Awake and Anesthetized Studies with 11C-Flumazenil
DISCUSSION
To our knowledge, these studies represent the first PET imaging of awake NHPs with minimal head restraint using extensive acclimation and pretraining of the animals.
The present approach was applied to compare 11C-flumazenil BPND under awake and anesthetized conditions. Our results showed no significant differences, although BPND was slightly higher in the awake condition. These results differ from a human study, which showed an isoflurane dose-dependent increase in 11C-flumazenil distribution volume, compared with the awake state (8). A subsequent technical note stated that the infusion of phenylephrine, used to maintain mean arterial blood pressure before induction, in combination with isoflurane may have increased the free fraction of the tracer (16). Thus, it is uncertain that the distribution volume increase reflected changes in specific binding. The outcome measure used here, BPND, is insensitive to free fraction.
Allowing head movement during the scan posed challenges in terms of image reconstruction. For motion correction, emission list-mode data acquired under the awake condition were reconstructed with the MAF method (11) where time-synced motion information was used to divide the data into subframes. A disadvantage of this method is data loss due to large or high-frequency head motion. As a result, motion-corrected awake scans were noisier, such that images acquired under awake and anesthetized conditions were smoothed for fair visual comparison. Cortical folds in the BPND images of anesthetized studies were better defined than in the awake studies (Fig. 4), because the MAF data had up to 2 mm of intraframe motion. Better accuracy of motion correction may be achieved with event-by-event motion correction, as used in the motion-compensation OSEM (ordered-subset expectation maximization) list-mode algorithm for resolution recovery reconstruction (MOLAR) for the high-resolution research tomograph (5). MOLAR corrects all lines of response back to their original positions, and all of the data are used. However, at the time of this study, MOLAR implementation was not complete for the Focus-220. For future awake scans, MOLAR may be the optimal reconstruction method.
Another challenge was attenuation correction, where acquiring a transmission scan was not feasible for awake, unrestrained NHPs. To circumvent this issue, an algorithm was developed to use transmission datasets acquired under anesthesia for attenuation correction in awake emission scans for the same animal. This algorithm was tested using pairs of emission data with aligned attenuation images from anesthetized scans obtained on different days with the procedure described earlier (13). ROI time–activity curve values were compared between emission images corrected for attenuation with a realigned transmission image or the original aligned transmission image for different tracers. Depending on the positioning of the brain in the FOV, the realigned transmission image sometimes had missing values, typically toward the bottom of the FOV, producing underestimations in time–activity curves. This issue was resolved by creating a larger, average transmission image using multiple transmission scans for the same animal in different positions in the FOV. In the event that transmission scans are unavailable for an animal, such data can be easily acquired during a separate scan day while the animal is under anesthesia. Alternatively, transmission data from other animals might be useable, if appropriate interanimal nonrigid registrations are developed and validated. Such algorithms might take advantage of existing monkey MR templates.
The awake imaging protocol was designed to reduce stress to the animal by allowing head motion and decreasing scan time. Both monkeys used in this study acclimated quickly to all training procedures. For this study, several animals were evaluated, where the animals chosen were highly food-motivated and readily adapted to awake scan acclimation procedures.
During the awake scan procedure, the animals showed some evidence of stress, particularly during the awake intravenous catheterization required for tracer infusion and cortisol blood sampling. In the current study, the measured cortisol levels under the awake condition were consistent with previous studies involving cortisol measurements as NHPs acclimated to awake procedures (i.e., chair restraint and blood draws) (17–20). Under the anesthetized condition, it is possible that stress levels during the second anesthetized PET study were affected by the long protocol (7 h); however, there are limited data on the effects of long-term anesthesia on cortisol, except in protocols involving a surgical procedure. In a study with female pigs, cortisol levels were monitored under different anesthetics over the course of 4 h with and without (sham condition) surgical intervention (21). Although there were no differences in cortisol levels between the sham condition and surgical intervention with desflurane and propofol, there was a significant increase in cortisol after 4 h with sevoflurane. Additionally, cortisol responses with surgical interventions varied depending on the anesthetic used. Cortisol, in response to stress, has been shown to vary with time of day (i.e., diurnal cycle) and sex in humans (22), in line with the differences in cortisol levels observed between monkeys in the anesthetized scans. Other possible factors contributing to the disparity in cortisol levels between the 2 animals may be attributed to age and social status (23,24).
Minimizing stress is important for awake imaging in NHPs because it may influence neuroreceptor measures. PET studies in awake rhesus monkeys using pharmacologic stressors have shown an increase in cortisol levels and differences in regional cerebral blood flow and regional cerebral metabolic rate of glucose measured with 15O-H2O and 18F-FDG, respectively (25,26). In addition, microdialysis studies have shown that physically or pharmacologically induced stress increases GABA levels in the basolateral amygdala (27,28). These findings are consistent with our data where the largest difference in 11C-flumazenil BPND was observed in the amygdala in awake monkeys. Taken together, stress may influence PET measures in conscious NHP studies and can be reduced with the appropriate equipment and consistent, regimented training (18,19).
To improve on the current awake imaging design, recent structural developments may permit tilting of the scanner to 90° (parallel to the floor). Validation of scanner performance at this configuration is required. Sitting in an upright position during scan acquisition will improve the comfort level for the animal. For future awake NHP imaging studies, these modifications are expected to reduce stress and to increase the reliability of PET measures.
The study findings did not support our hypothesis based on the effect of isoflurane on GABA and GABAA-BDZ binding. There is general but not complete agreement in the literature that a primary target for isoflurane anesthetic action is at the GABAA receptor, where GABA is the major inhibitory neurotransmitter in the central nervous system. GABAA is an ionotropic receptor and contains GABA and BDZ binding sites (29,30). The BDZ site has been extensively studied in stress and anxiety disorders. BDZ site modulators exert their effects in the presence of GABA but do not directly activate the GABAA receptor (31). BDZ agonists potentiate the effects of GABA by increasing the conductance of Cl− to intensify hyperpolarization and inhibition of neuronal activity (31,32). In turn, in vitro homogenate binding studies have demonstrated that GABA increases the affinity for ligands to the BDZ site, termed the GABA shift (9).
A recent review reported that volatile anesthetics dose-dependently enhanced extrasynaptic GABA-induced inhibitory postsynaptic currents akin to higher extracellular GABA concentration, in vitro (33). With further evidence of the GABA shift as demonstrated with PET and SPECT studies with tiagabine (10,34), isoflurane-induced increases in GABA should be detectable with 11C-flumazenil at the GABAA-BDZ receptor site. However, in this study we did not observe statistically significant differences in 11C-flumazenil BPND between awake and anesthetized conditions.
Apart from eliminating anesthesia effects on PET measures and brain function, awake neuroreceptor imaging provides the opportunity to simultaneously measure cognitive performance and to correlate various aspects of cognitive function with receptor availability and neuroreceptor binding. However, the current design with minimal head restraint would not permit simultaneous microdialysis measurements, important for relating neurotransmitter release to PET measurements before and after a pharmacologic challenge. In the present study, the animals performed touch-screen tasks for juice reward; however, once the scanner was tilted, the animal’s view of the touch-screen was limited. For future studies, which aim to correlate PET activity to task performance, careful consideration must be taken to limit overtrained behavior that may affect PET measurements. For behavioral activation studies, where the animal performs a cognitive task during the scan, a baseline scan should be included where the animal performs a control task that does not interfere with the specific neuronal circuitry under study. Henceforth, it will be important to ensure that the animals can perform the tasks effectively throughout the imaging period to investigate noninvasive cognitive neurochemistry in the primate.
CONCLUSION
We developed a novel protocol to image awake NHPs with minimal head restraint using motion-tracking technology. This approach was evaluated with the BDZ radioligand 11C-flumazenil under awake versus anesthetized conditions. Animals acclimated to procedures in a custom NHP chair and successfully performed repeated awake PET scans. Equilibrium analysis of 11C-flumazenil binding was slightly, but nonsignificantly, higher in unrestrained awake versus anesthetized NHPs. This work provides a foundation for correlating behavioral imaging paradigms with PET radioligand measurements for advancing translational research approaches between humans and NHPs.
DISCLOSURE
The costs of publication of this article were defrayed in part by the payment of page charges. Therefore, and solely to indicate this fact, this article is hereby marked “advertisement” in accordance with 18 USC section 1734. Research support was provided by Glaxo-Smith Kline and the training grant 1-T90-DK070068. This publication was also made possible by CTSA grant number UL1 RR024139 from the National Center for Research Resources (NCRR) and the National Center for Advancing Translational Science (NCATS), components of the National Institutes of Health (NIH), and NIH roadmap for Medical Research. Its contents are solely the responsibility of the authors and do not necessarily represent the official view of NIH. No other potential conflict of interest relevant to this article was reported.
Acknowledgments
We acknowledge the staff at the Yale PET Center, especially Shervin Liddie and Siobhan Ford, and other members of the NHP team, including Brooke Roberts, Amanda Abbott, and David Campbell. Special thanks go to Jodi Scholz, Irina Esterlis, Edward Fung, and Jean-Dominique Gallezot to for helpful scientific discussions.
Footnotes
Published online Oct. 10, 2013.
- © 2013 by the Society of Nuclear Medicine and Molecular Imaging, Inc.
REFERENCES
- Received for publication February 25, 2013.
- Accepted for publication June 24, 2013.


Jump to section
Related Articles
Cited By...
- Functional Characterization of 5-HT1B Receptor Drugs in Nonhuman Primates Using Simultaneous PET-MR
- Tobacco smoking interferes with GABAA receptor neuroadaptations during prolonged alcohol withdrawal
- Evaluation of Frame-Based and Event-by-Event Motion-Correction Methods for Awake Monkey Brain PET Imaging