


Abstract
Response Evaluation Criteria In Solid Tumors (RECIST) (unidimensional), Southwest Oncology Group (SWOG) solid tumor response criteria (bidimensional), and their modified variants are commonly used in the tumor response assessment after treatment of gastroenteropancreatic and thoracic neuroendocrine tumors (NETs). In the current study, RECIST, SWOG criteria, modified RECIST (mRECIST), and modified SWOG (mSWOG) criteria were compared in patients with NETs treated with [177Lu-DOTA0,Tyr3]octreotate (177Lu-octreotate). Methods: Two-hundred sixty-eight Dutch patients with NETs who had been treated with 177Lu-octreotate between January 2000 and April 2007 were studied. CT or MR imaging scans were analyzed using RECIST, SWOG criteria, mRECIST, and mSWOG criteria (including the tumor response class minor response [decrease of 13%–30% for mRECIST and 25%–50% for mSWOG]). The outcomes were correlated with progression-free survival (PFS) and overall survival (OS). Results: Eleven patients had an unknown tumor response and were excluded. The rates of objective response (OR) (complete response + partial response [+minor response for mRECIST/mSWOG]), stable disease, and progressive disease (PD) were 28%, 49%, and 24%, respectively, according to RECIST; 25%, 49%, and 26%, respectively, according to SWOG; 44%, 33%, and 24%, respectively, according to mRECIST; and 45%, 29%, and 26%, respectively, according to mSWOG. In patients who had OR, stable disease, or PD, the median PFS was 26–30, 27–34, and 8 mo, respectively, with any of the 4 response criteria. In patients who had OR, stable disease, or PD, the median OS was 55–57, 56–74, and 11–12 mo, respectively, with any of the 4 response criteria. Subanalyses for patients who had progression before treatment start were comparable. Conclusion: Patients with PD as treatment outcome had significantly shorter PFS and OS than patients with an OR or stable disease with all 4 scoring systems. PFS and OS were comparable for patients with tumor regression and stable disease. The addition of the response class minor response did not improve the correlation with PFS and OS. The 4 scoring systems gave comparable results in terms of PFS and OS per categorized outcome.
- neuroendocrine tumor
- peptide receptor radionuclide therapy
- [177Lu-DOTA0,Tyr3]octreotate
- treatment response
Gastroenteropancreatic and thoracic neuroendocrine tumors (NETs) are rare neoplasms that usually grow slowly and have a relatively indolent course. Surgery is the only potential for cure. Often, these tumors are metastasized at diagnosis. Treatment options for metastasized disease include somatostatin analogs; chemotherapy; newer targeted therapies such as sunitinib (Sutent; Pfizer Inc.), a tyrosine kinase inhibitor (1), or everolimus (Afinitor; Novartis Pharmaceuticals), an inhibitor of mammalian target of rapamycin (2); peptide receptor radionuclide therapy (PRRT); or liver-directed therapies (in the case of predominant liver disease), such as chemoembolization, embolization, or radiofrequency ablation.
PRRT with radiolabeled somatostatin analogs is currently available in several, mostly European, centers and has shown promising results in the treatment of NETs (3–7).
Tumor response assessment after treatment of NETs is mostly done by imaging with CT or magnetic resonance. Several response criteria can be used for this purpose, including the Response Evaluation Criteria In Solid Tumors (RECIST) (8) (unidimensional), the Southwest Oncology Group (SWOG) solid tumor response criteria (9) (bidimensional), and their modified variants. It is not known what criteria correlate best with survival in patients with NETs.
In the current study, RECIST, SWOG criteria, modified RECIST (mRECIST), and modified SWOG (mSWOG) criteria were compared in patients with NETs treated with [177Lu-DOTA0,Tyr3]octreotate (177Lu-octreotate), regarding tumor response outcome and correlation with survival.
MATERIALS AND METHODS
Patients
Inclusion criteria for this study were Dutch patients with gastroenteropancreatic and thoracic NETs; treatment with 177Lu-octreotate in our institution between January 2000 and April 2007; tumor uptake during [111In-DTPA0]octreotide scintigraphy (OctreoScan; Mallinckrodt) preceding the therapy that was at least as high as that in normal liver tissue; no prior treatment with other radiolabeled somatostatin analogs; baseline serum hemoglobin ≥ 6 mmol/L, white blood cell count ≥ 2 × 10⁹, and platelet count ≥ 75 × 109; baseline serum creatinine concentration ≤ 150 μmol/L or creatinine clearance ≥ 40 mL/min; and Karnofsky performance status ≥ 50. No requirements were made regarding documented tumor progression before treatment start. The patients were retrospectively selected. Treatment until April 2007 was used as a cutoff date to allow for a sufficient follow-up time. Only Dutch patients were selected, because loss to follow-up is limited in this patient group. This study is part of the ongoing prospective study in patients with NETs treated with 177Lu-octreotate at the Department of Nuclear Medicine, Erasmus University Medical Center Rotterdam, which was approved by the local medical ethical committee. All patients gave written informed consent to participate in the study.
Treatment
[DOTA0,Tyr3]octreotate was obtained from BioSynthema. 177LuCl3 was distributed by IDB-Holland. 177Lu-octreotate was locally prepared as described previously (10). Granisetron (Kytril [Roche], 3 mg) was injected intravenously 30 min before the infusion of 177Lu-octreotate was started. To reduce the radiation dose to the kidneys, an infusion of amino acids (2.5% arginine and 2.5% lysine, 1 L) was started 30 min before the administration of the radiopharmaceutical and lasted 4 h. The radiopharmaceutical was coadministered, using a second pump system. Cycle doses were 3.7 or 7.4 GBq, depending on short-term toxicity, injected over 30 min. The intended interval between treatments was 6–10 wk. Normally, patients undergo 4 treatment cycles. Patients were treated up to a cumulative intended dose of 22.2–29.6 GBq. If dosimetric calculations indicated that the radiation dose to the kidneys would exceed 23 Gy with a dose of 29.6 GBq, the cumulative dose was reduced to 22.2–27.8 GBq. Routine hematology and liver and kidney function tests were performed before each therapy and at follow-up visits.
Tumor Response
Tumor response assessment was done according to RECIST (8), to SWOG criteria (9), and to mRECIST and mSWOG criteria, in which the tumor response class minor response was added, pertaining to a decrease of 13%–30% for mRECIST and a decrease of 25%–50% for the mSWOG criteria. Table 1 lists the criteria and definitions specified by RECIST and SWOG.
Criteria and Definitions of Response Assessment According to RECIST and SWOG
Tumor lesions had been scored according to the SWOG criteria as part of the ongoing prospective study in patients with NETs treated with 177Lu-octreotate at our institution. For this study, we extracted the longest diameter from the bidimensional measurement for reclassification according to RECIST. Normally, a maximum of 5 lesions per organ and 10 lesions in total should be used for RECIST and a maximum of 3 lesions per organ for the SWOG criteria (total maximum number of lesions is not stated in the SWOG criteria). Because lesions had been scored according to the SWOG criteria as part of the ongoing prospective study, a maximum of 3 lesions per organ was available. Therefore, a maximum of 3 instead of 5 lesions per organ was used for RECIST. Tumor response assessment at 3 mo after the last treatment with 177Lu-octreotate was used for this analysis. Tumor response had to be confirmed on a subsequent CT/MR imaging scan, except for progressive disease (PD). Response categories were complete response (CR), partial response (PR), stable disease, and PD for RECIST and SWOG criteria and CR, PR, minor response, stable disease, and PD for mRECIST and mSWOG criteria. If a patient had only 1 follow-up scan (and thus no confirmatory scan), and was hereafter lost to follow-up, the tumor response was unknown. However, if a patient died after 1 follow-up scan, the tumor response was PD. Death or evident clinical progression during treatment or before a CT/MR imaging scan was acquired was defined as PD. Normal follow-up of patients treated with 177Lu-octreotate consisted of CT/MR imaging at 6 wk, 3 mo, and 6 mo after the last treatment and thereafter every 6 mo. Baseline CT/MR imaging was performed within 3 mo before start of the treatment with 177Lu-octreotate. Contrast-enhanced CT or gadolinium-enhanced MR imaging was used for response assessment, unless there was a clinical contraindication for the use of contrast.
Statistical Analysis
Progression-free survival (PFS) and overall survival (OS) were calculated. January 1, 2010, was used as a cutoff date. PFS was defined as the time from the first treatment with 177Lu-octreotate until the time of progression (radiologic or clinical) or death from any cause. For PFS analysis, patients were censored in the case of no progression at the time of the last tumor assessment by CT/MR imaging before the cutoff date or if lost to follow-up. OS was defined as the time from the first treatment with 177Lu-octreotate until the date of death from any cause. For OS analysis, patients were censored if alive at the last date of follow-up before the cutoff date or if lost to follow-up. Survival curves were estimated with the Kaplan–Meier method. The different response outcome categories were compared with the log-rank test.
Intercriterion agreement between the different response criteria was assessed using the Cohen’s κ statistics. The intercriterion agreement based on the κ statistic was interpreted as follows: κ of 0.0–0.20, slight agreement; κ of 0.21–0.40, fair; κ of 0.41–0.60, moderate; κ of 0.61–0.80, substantial; and κ of 0.81–1.00, almost perfect (11). The discriminative ability of the response criteria was assessed using the C index (12). This index can be seen as a natural extension of the area under the receiver-operating-characteristic curve for survival analysis. A C index of ≤ 0.5 indicates prediction no better than chance, and values from 0.5 to 1.0 (perfect prediction) indicate improvement over chance (13).
The SPSS (SPSS 15.0; IBM) and R (Terry Therneau [2012]; A Package for Survival Analysis in S; R package version 2.36–14) packages were used. Two-sided P values are reported. P values of less than 0.05 were considered to be significant.
RESULTS
Two-hundred eighty-one Dutch patients with gastroenteropancreatic and thoracic NETs had been treated with 177Lu-octreotate according to protocol in our institution between January 2000 and April 2007. Thirteen patients were excluded from this study for the following reasons: only measurable bone lesions (n = 5), lesions could not be clearly delineated on CT (n = 3), only a written CT report of the CT performed after treatment was available (not the CT images themselves) (n = 2), MR imaging at baseline and follow-up by CT (n = 1), baseline images not available (n = 1), and no measurable lesions on CT (only on [111In-DTPA0]octreotide scintigraphy) (n = 1).
Thus, 268 patients were evaluated. Baseline characteristics are presented in Table 2. There were 138 men and 130 women. Mean age was 59 y (range, 23–83 y). Imaging was performed with CT in 260 patients and with MR imaging in 8 patients. Five hundred sixty-two lesions were assessed: 430 liver lesions, 53 primary tumors, 46 lymph nodes, 10 total liver (this was done if single liver lesions could not be measured separately, because all lesions were coalesced), 7 pulmonary lesions, and 16 other soft-tissue lesions. All lesions had a baseline longest diameter of ≥ 10 mm and hence met the definition of a measurable lesion for RECIST.
Baseline Characteristics (n = 268)
Tumor Response
Eleven patients, who were all lost to follow-up, had an unknown tumor response and were excluded. The rates of objective response (OR) (CR + PR [+minor response for mRECIST/mSWOG]), stable disease, and PD were 28% (71/257), 49% (125/257), and 24% (61/257), respectively, according to RECIST; 25% (65/257), 49% (125/257), and 26% (67/257), respectively, according to SWOG; 44% (112/257), 33% (84/257), and 24% (61/257), respectively, according to mRECIST; and 45% (115/257), 29% (75/257), and 26% (67/257), respectively, according to mSWOG (Table 3).
Tumor Response Confirmed at 3 Months According to RECIST/SWOG/mRECIST/mSWOG (n = 257)
Intercriterion Agreement and C Index
Intercriterion agreement using the Cohen’s κ statistics showed good correlation between RECIST and SWOG criteria (κ = 0.76; 95% confidence interval [CI], 0.69–0.83), between mRECIST and mSWOG criteria (κ = 0.78; 95% CI, 0.71–0.84), between RECIST and mRECIST (κ = 0.76; 95% CI, 0.69–0.83), and between SWOG and mSWOG criteria (κ = 0.71; 95% CI, 0.64–0.78).
The C indices for prediction of PFS were similar for the 4 response criteria with values of 0.74 (95% CI, 0.70–0.78) for RECIST, 0.72 (95% CI, 0.68–0.76) for SWOG, 0.73 (95% CI, 0.68–0.77) for mRECIST, and 0.72 (95% CI, 0.68–0.76) for mSWOG. Also for OS, the C indices were similar for the 4 response criteria with values of 0.66 (95% CI, 0.61–0.71) for RECIST, 0.68 (95% CI, 0.63–0.72) for SWOG, 0.66 (95% CI, 0.61–0.71) for mRECIST, and 0.66 (95% CI, 0.61–0.71) for mSWOG. The C indices for PFS were higher than those for OS for all response criteria.
Survival
Eleven patients who had an unknown tumor response were excluded from this analysis. According to RECIST, 206 patients had progression or died (whichever came first). Median PFS for RECIST was 23 mo (95% CI, 20–26) for the total group. According to SWOG, 204 patients had progression or died (whichever came first). Median PFS according to SWOG was 23 mo (95% CI, 20–26) for the total group. In patients who had OR, stable disease, or PD, the median PFS was 26, 33, and 8 mo (P < 0.001, log-rank test [overall significant difference between the outcome categories]), respectively, according to RECIST; 30, 27, and 8 mo (P < 0.001, log-rank test), respectively, according to SWOG; 27, 34, and 8 mo (P < 0.001, log-rank test), respectively, according to mRECIST; and 28, 28, and 8 mo (P < 0.001, log-rank test), respectively, according to mSWOG (Fig. 1). The addition of the response class minor response did not improve the correlation with PFS.
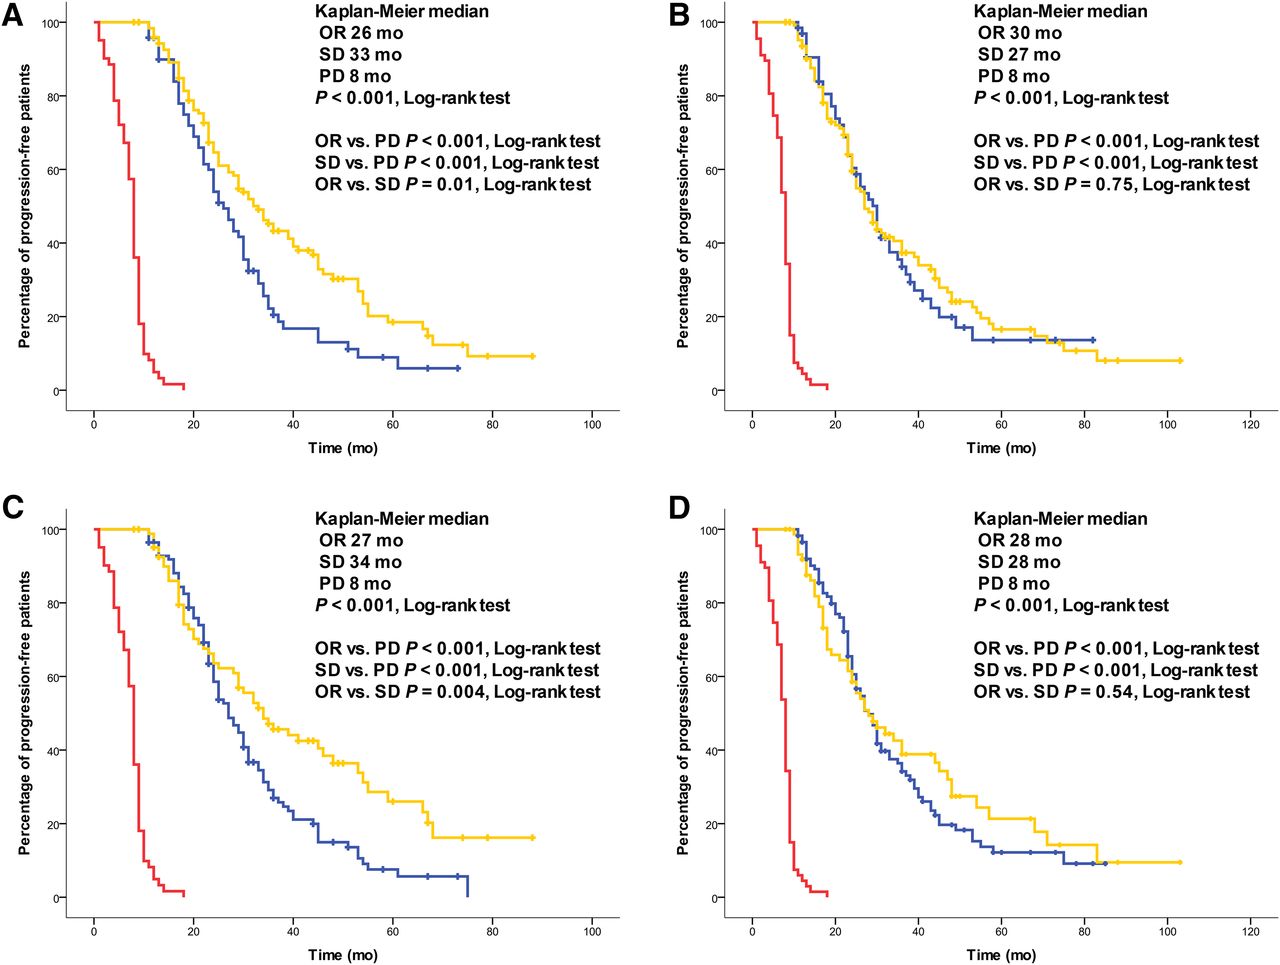
PFS in 257 patients with NETs. Significant difference in median PFS was observed for patients with OR (blue line), stable disease (yellow line), or PD (red line) according to RECIST (A), SWOG (B), mRECIST (C), and mSWOG (D). SD = stable disease.
One hundred forty-five patients died. Median OS was 51 mo (95% CI, 45–57) for the total group. In patients who had OR, stable disease, or PD, the median OS was 55, 56, and 11 mo (P < 0.001, log-rank test), respectively, according to RECIST; 57, 63, and 12 mo (P < 0.001, log-rank test), respectively, according to SWOG; 55, 64, and 11 mo (P < 0.001, log-rank test), respectively, according to mRECIST; and 55, 74, and 12 mo (P < 0.001, log-rank test), respectively, according to mSWOG (Fig. 2). As for the PFS, the addition of the response class minor response did not improve the correlation with OS.
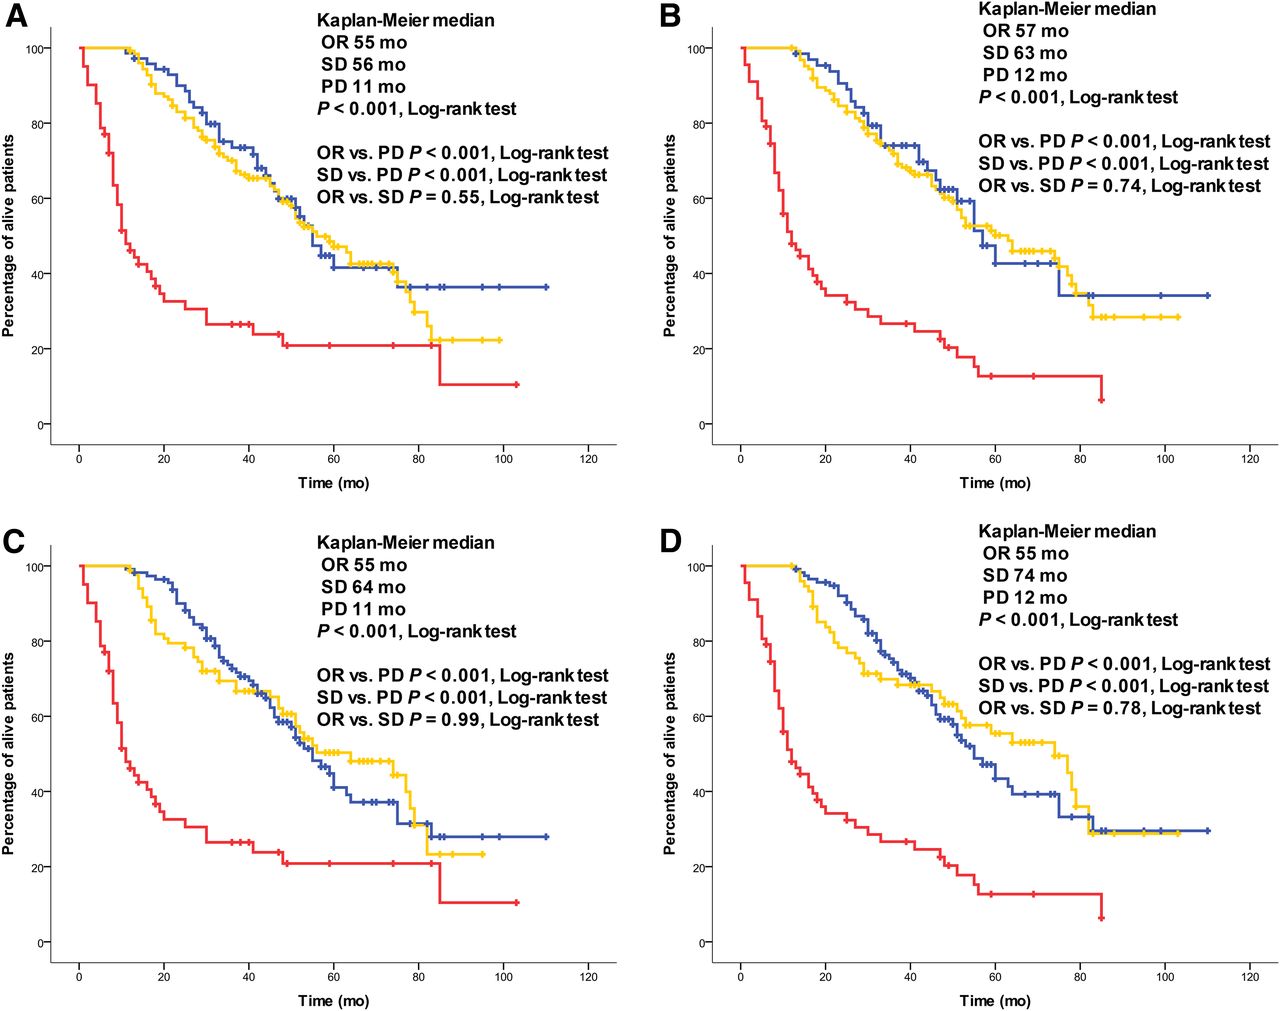
OS in 257 patients with NETs. Significant difference in median OS was observed for patients with OR (blue line), stable disease (yellow line), or PD (red line) according to RECIST (A), SWOG (B), mRECIST (C), and mSWOG (D). SD = stable disease.
Subanalyses for patients who had progression (based on radiologic imaging [not always RECIST- or SWOG-based] or clinical progression) in the 12 mo before treatment with 177Lu-octreotate and those who did not have progression showed results comparable to those for the total group analysis (Figs. 3 and 4). Subanalyses for patients with different tumor types showed that in patients with a nonfunctional pancreatic NET, PFS and OS were longest in patients with OR (Supplemental Fig. 1). Especially in patients with midgut NETs, the longest PFS and OS were observed in patients with stable disease as tumor outcome (Supplemental Fig. 1). Lastly, subanalyses for patients with midgut NETs who had progression (based on radiologic imaging [not always RECIST- or SWOG-based] or clinical progression) in the 12 mo before treatment with 177Lu-octreotate and those who did not have progression showed results comparable to those for the total group analysis (Supplemental Fig. 2).
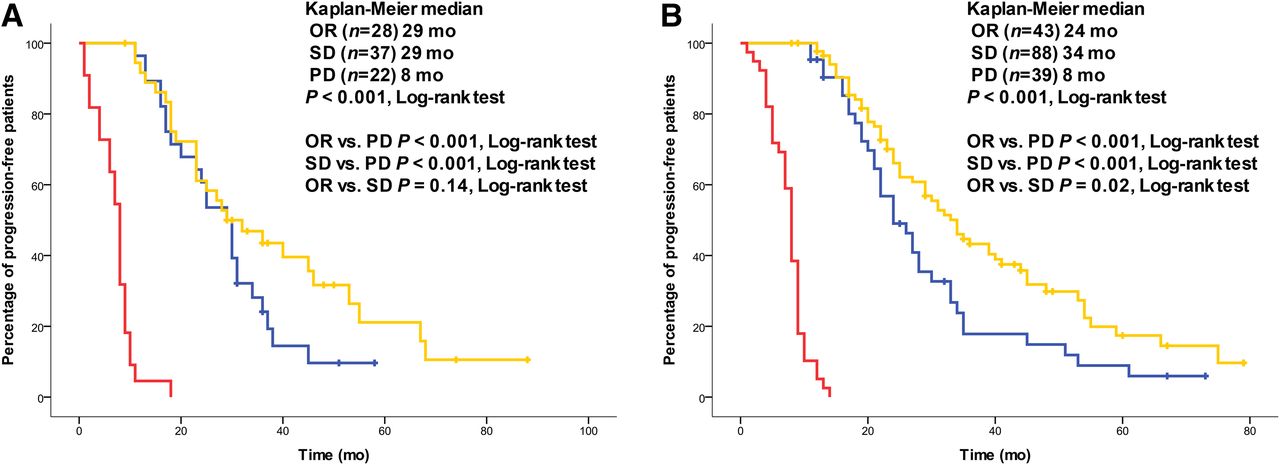
PFS based on RECIST in patients with NETs with progression before treatment (n = 87) (A) and without progression before treatment (n = 170) (B). Response categories according to RECIST (OR [blue line], stable disease [yellow line], and PD [red line]). PFS analyses with response categories according to SWOG, mRECIST, and mSWOG, respectively, gave comparable results. SD = stable disease.

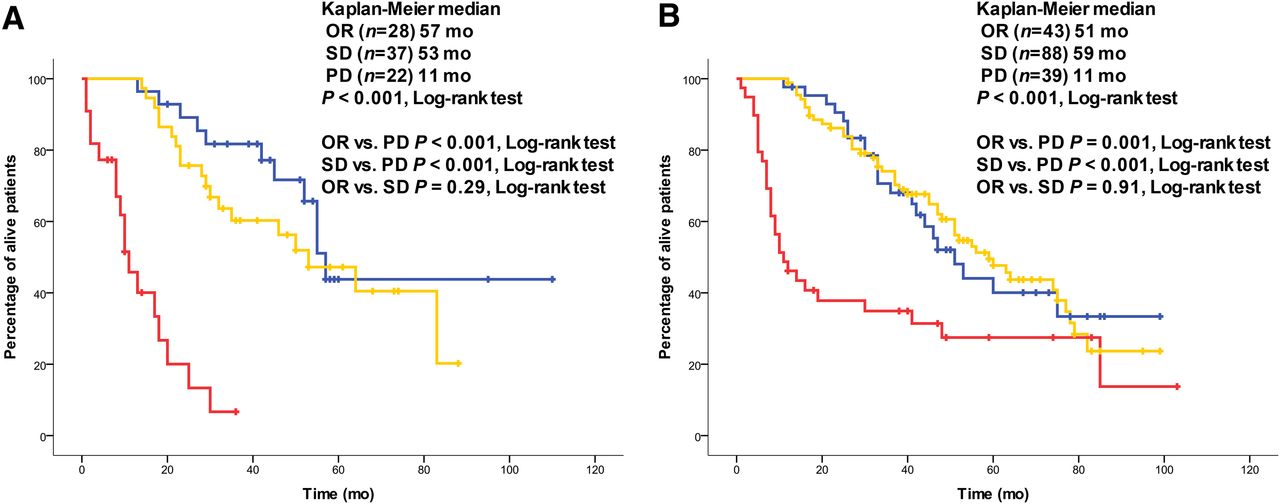
OS in patients with NETs with progression before treatment (n = 87) (A) and without progression before treatment (n = 170) (B). Response categories according to RECIST (OR [blue line], stable disease [yellow line], and PD [red line]). OS analyses with response categories according to SWOG, mRECIST, and mSWOG, respectively, gave comparable results. SD = stable disease.
DISCUSSION
In this study, we compared 4 different response criteria—that is, RECIST, SWOG, mRECIST, and mSWOG—in the tumor response assessment in patients with NETs treated with 177Lu-octreotate. The RECIST and SWOG criteria gave comparable results, with a good correlation as indicated by the Cohen’s κ statistic. The same held true for the mRECIST and mSWOG criteria. Patients with PD as treatment outcome had significantly shorter PFS and OS than patients with an OR or stable disease with all 4 scoring systems. PFS and OS were comparable for patients with tumor regression and stable disease.
Tumor response assessment by imaging is regarded as the most objective response assessment available nowadays. In the response assessment of NETs, both RECIST (1,2,7,14) and SWOG criteria (4–6) are widely used. To our knowledge, this is the first report to compare these 2 criteria for NETs. Our data indicate that the application of the RECIST or SWOG criteria gives the same results and predicts PFS and OS in a comparable way. Furthermore, the modified variants (i.e., mRECIST and mSWOG) did not improve the correlation with PFS and OS.
In other tumor types, modified response criteria were able to predict survival better than the classic criteria. In the response assessment of hepatocellular carcinoma after treatment with sorafenib (a multikinase inhibitor), the application of modified RECIST criteria, based on the unidimensional measurement of only the contrast-enhanced portion of a hepatic lesion at the arterial phase on CT, resulted in better prediction of OS than with the application of the classic RECIST (15). Also in the response assessment of hepatocellular carcinoma after chemoembolization, the modified RECIST as explained above and the European Association for the Liver (EASL) criteria, based on the bidimensional measurement of only the contrast-enhanced portion of a hepatic lesion at the arterial phase on CT, resulted in better prediction of OS than the classic criteria (16).
Other new criteria are the Choi criteria, which were developed for the assessment of gastrointestinal stromal tumors to treatment with imatinib mesylate (17). The Choi criteria are based on quantification of change in both tumor size and density on CT. A decrease in tumor size of more than 10% or a decrease in tumor density of more than 15% on CT is defined as good response. Good responders on CT at 2 mo had significantly longer time to progression than those who did not respond (17).
Some of these new criteria have also been applied to NET patients. The EASL criteria have been applied to patients with NETs with liver metastases treated with hepatic arterial chemoembolization with doxorubicin-eluting beads (18,19) or with 90Y radioembolization (20). The Choi criteria have been applied to a patient with a pancreatic NET treated with sunitinib and Octreotide LAR. In that patient, a response could be demonstrated using Choi criteria but not by RECIST (21).
For the 4 response criteria investigated in this study, the patients with stable disease as treatment outcome had an OS comparable to patients with OR as treatment outcome. For PFS, according to SWOG patients with OR had a longer PFS (30 mo) than patients with a stable disease (27 mo); for mSWOG, PFS was the same for stable disease and OR patients. However, RECIST and mRECIST showed better PFS for stable disease than for OR patients. This is an unexpected finding. We performed subanalyses for patients with and without progression before treatment with 177Lu-octreotate and for different tumor types to further explore this finding. Subanalyses for patients with and without progression before treatment with 177Lu-octreotate showed results comparable to those for the total group analysis. For the nonfunctional pancreatic NETs, OS and, to a lesser extent, PFS were longer for OR than for stable disease patients. Subanalyses for functional pancreatic NETs were not reliable, because this group was too small to permit valid comparisons. Also the groups of patients with a foregut NET and with a hindgut NET were too small to permit valid conclusions. Especially in the midgut NET patients, stable disease patients had a PFS and OS comparable to OR patients. This could be explained by the slow-growing nature of midgut NETs, which can be stable for several years. In this sense, it is questionable whether these patients have benefited from the treatment with 177Lu-octreotate at all or that they also would have remained stable without treatment. Patients with stable disease as treatment outcome may have different patient or tumor characteristics, which could explain the difference in survival. One such tumor characteristic could be the Ki67 proliferative index, which has proven to be an important prognostic factor for survival in patients with midgut NETs (22,23). However, the Ki67 index was not available for most patients, because it was not determined routinely in our institution before 2007. In a subsequent analysis, performed in patients treated after April 2007, we determined the distribution of World Health Organization (WHO) grading (24) (which incorporates the Ki67 index) in patients with a nonfunctional pancreatic NET and those with a midgut NET. Midgut NETs had significantly more often a lower proliferation rate than nonfunctional pancreatic NETs (WHO grade 1 [Ki67, 0%–2%], 24 patients; WHO grade 2 [Ki67 > 2%–20%], 18 patients for midgut NETs, vs. WHO grade 1, 8 patients; WHO grade 2, 30 patients; WHO grade 3 [Ki67 > 20%], 2 patients for nonfunctional pancreatic NETs, P = 0.001, Fisher exact test using Monte Carlo method), supporting the hypothesis above. However, because the studied patient group was heterogeneous with respect to tumor type and progression before treatment, the correlation with survival remains uncertain from our data.
Next to morphologic assessment, tumor response assessment can also be performed by functional imaging, for example, by PET imaging. For NETs, PET can be performed with 68Ga-DOTA-Tyr3-octreotide (25), 6-18F-fluoro-l-DOPA (26,27), or 11C-5-hydroxytryptophan (26), among others. Combining PET with CT gives anatomic and functional information on tumors in a single examination. This may very well be the future of imaging in NETs. However, PET with some of these radiopharmaceuticals is not widely available.
Furthermore, volumetric evaluation of tumors—that is, 3-dimensional (3D) assessment instead of 1-dimensional (unidimensional) or 2-dimensional (bidimensional) assessment—has been suggested as a better method for evaluating tumor size (28). However, because there are no standardized response criteria for 3D assessment of tumors and because this application is not available in many centers, 3D assessment of tumors is not integrated in routine clinical practice, to date.
There are several limitations to this study. First, documented tumor progression before treatment start was not a strict inclusion criterion. Second, treatment response was not assessed through molecular imaging, such as with 6-18F-fluoro-l-DOPA. Third, it can be questioned whether using 3 instead of 5 lesions for RECIST had any impact on the results. Lastly, the retrospective character is an inherited limit of this study. However, we feel that the long follow-up time and large number of patients and events permit valid conclusions to be made.
CONCLUSION
Patients with PD as treatment outcome had a significantly shorter PFS and OS than patients with an OR or stable disease with all 4 scoring systems. PFS and OS were comparable for patients with tumor regression and stable disease. The addition of the response class minor response did not improve the correlation with PFS and OS. The 4 scoring systems gave comparable results in terms of PFS and OS per categorized outcome.
DISCLOSURE
The costs of publication of this article were defrayed in part by the payment of page charges. Therefore, and solely to indicate this fact, this article is hereby marked “advertisement” in accordance with 18 USC section 1734. No potential conflict of interest relevant to this article was reported.
Acknowledgments
We thank Dr. Maria A.J. de Ridder for statistical advice.
- © 2013 by the Society of Nuclear Medicine and Molecular Imaging, Inc.
REFERENCES
- Received for publication November 27, 2012.
- Accepted for publication May 7, 2013.


