


Abstract
In this era of systems biology, the tide of information derived from “omic” technologies (genomics, proteomics, etc.) has sparked a revolution in drug design, with many industrial and academic programs now embracing the concepts of molecular medicine (i.e., targeting changes in specific proteins or pathways) as measures of treatment efficacy and outcome. This approach has yielded a plethora of new preclinical therapeutics directed at novel targets within oncology. In many ways, the evolution of molecular imaging agents as diagnostic probes mirrors that of chemotherapeutics; yet despite an increasing number of PET and SPECT radiotracers being evaluated in human trials, relatively few agents have found widespread use in clinical oncology. In light of this observation, is it time to reevaluate our strategies for radiopharmaceutical design and use? In this article, we argue that PET has enormous potential to deliver clinically relevant information on disease dynamics that extends beyond mapping the density and spatial distribution of a target. Recent developments in targeting pharmacodynamic biomarkers aim to exploit better the advantages of functional PET by detecting changes in signal transduction pathways, particularly in response to disease progression or treatment in cancer.
Disruptions in normal cellular signaling lie at the heart of many pathologies. In cancer, multiple fundamental genetic defects resulting from activating mutations, gene translocations, changes in copy number, loss of tumor suppressors, or alterations in micro-RNA activity and expression are required for disease initiation and progression (1). Genetic defects frequently lead to changes in the balance and regulation of signaling pathways associated with cancer hallmarks, including cellular proliferation, metabolism, survival, adhesion, motility, stress response, invasion, and migration (2). These manifest differences between normal and diseased tissue are the basis for identifying biologic markers (biomarkers) that may serve as diagnostic indicators of disease stage, progression, or response to therapeutic intervention. Thus, detection and quantification of key biomarkers using noninvasive nuclear imaging technologies is the ultimate goal of radiotracer design. The challenge remains to orient the discovery of PET radiotracers and imaging strategies toward detecting changes in signaling pathways that are reflective of disease and patient status.
BIOMARKERS FOR IMAGING AND THERAPY
Biomarker Classification
Genomic and proteomic screening has provided a wealth of potential new biomarkers for diagnosis and new targets for antineoplastic therapy (3). From a nuclear imaging perspective, targets are typically selected before radiotracer development, usually on the basis of their differential expression (e.g., upregulation) in the chosen pathology versus nondiseased control or background tissue. Differential target expression is the origin of specific contrast in nuclear imaging. Suitable targets can be grouped into categories depending on their physiologic location, which may be in the extracellular matrix, on the cell surface, or within the cell. In terms of structure and function, most targets are proteins that play pivotal roles in cellular metabolism, proliferation, and survival, by acting as growth factors, receptors, enzymes, second messengers, or effectors mediating signal transduction.
An alternate method for categorizing biomarkers, which presents some practical advantages, is based on their intended application in a clinical setting as prognostic, predictive, or pharmacodynamic indicators (4). Prognostic biomarkers are used by clinicians to provide an indication of the likely course of disease progression. For example, the presence of mutated breast cancer susceptibility genes 1 and 2 imparts an increased likelihood of developing breast and ovarian cancer (5), whereas prostate-specific antigen (PSA) levels in blood are monitored routinely in prostate cancer patients (6). The value of prognostic markers lies in their potential to facilitate early diagnosis and in evaluating whether treatment should be administered. Nuclear imaging modalities may not be economically viable for large-scale screening for early detection. This objective is more readily attained by genotyping or blood analyses of high-risk patients, before imaging referral. A case in point is the recent advent of EarlyCDT-Lung (Oncimmune Ltd.) technology for screening lung cancer patients for the presence of anticancer antibodies, which at a cost of approximately $300 per person, provides modest sensitivity (∼40%) but specificity of 90% for experimental detection of small cell and non–small cell lung cancer (7).
Radiotracers have the potential to play important roles in noninvasive detection of predictive and pharmacodynamic biomarkers. Predictive biomarkers are indicators of the likelihood that a patient may respond to a given intervention and hence guide clinicians in their choice of therapy. PET of predictive biomarkers has been the mainstay of radiotracer development in oncology over the past 2 decades. Indeed, most radiotracers listed in the Molecular Imaging and Contrast Agent Database (8) were developed against predictive biomarkers. In the context of radiotracer imaging, such “predictions” normally involve identifying the spatial distribution and density of a therapeutic target, thus providing a molecular justification for administering targeted therapeutics. A prominent example from preclinical and phase I/II clinical trials is the use of radiolabeled trastuzumab (Herceptin; Genentech) for detecting expression of HER2/neu growth-factor receptors in breast cancer. Here, PET, in conjunction with anatomic imaging modalities (e.g., CT), can potentially guide therapy or surgical intervention by measuring biomarker expression in specific lesions. A notable exception is the recent development of 18F-PEG6-IPQA, which, in addition to measuring target density and distribution, binds irreversibly with high selectivity to activated mutant L858R epidermal growth-factor receptor in non–small cell lung carcinoma. Thus, 18F-PEG6-IPQA can potentially be used to predict response or resistance to gefitinib or erlotinib treatment (9).
A substantial number of targets for established radiotracers can be considered as upstream components of signal transduction pathways. However, overexpression of a signaling protein does not necessarily entail a corresponding increase in signaling. If the expression of a predictive biomarker changes during disease progression or therapy, the same target may also serve as a pharmacodynamic biomarker with potential for monitoring drug efficacy. In 2004, Smith-Jones et al. (10) introduced a new paradigm for pharmacodynamic imaging heat-shock protein-90 inhibition by 17-allylamino-17-demethoxygeldanamycin (tanespimycin) via detecting changes in HER2/neu expression levels before and after treatment using 68Ga-F(ab′)2-trastuzumab.
Radiotracer Classification
In addition to a taxonomy based on target location, radiotracers can also be classified mechanistically as those that directly bind to their target (i.e., competitive, noncompetitive, or allosteric inhibitors) or enzyme/transporter substrates. Directly binding radiotracers bind reversibly or irreversibly to their target and thus provide a specific signal in proportion to the target abundance. In addition to small-molecular-weight agents based on modified receptor ligands, this group includes, among others, radiolabeled antibodies, Affibody molecules (Affibody AB), peptides, and kinase inhibitors. Enzyme-targeted or transporter-targeted radiotracers are typically substrates that produce image contrast based on elevated accumulation in the diseased versus normal tissue due to increased enzyme or transporter expression or activity. The prototypic enzyme-targeted tracers are 18F-FDG, for measuring hexokinase activity, and 3′-deoxy-3′-18F-fluorothymidine (18F-FLT), for measuring DNA synthesis and cellular proliferation via thymidine kinase-1 activity. Other examples include hypoxia-selective radiotracers such as 18F-fluoromisonidazole and 60/61/62/64Cu-diacetyl-bis(N4-methythiosemicarbazone), which accumulate via enzyme-mediated reductive trapping in oxygen-depleted tissues, and matrix metalloprotease–targeted agents, which are substrates for catalytic cleavage by activated matrix metalloproteases (11). Importantly, radiotracers of either mechanistic class have the potential to be used to detect any class of biomarker.
In terms of using radiotracers for detecting pharmacodynamic targets, the concept of surrogate imaging is particularly noteworthy. Here, the key distinction is that target expression or activity need not be a driver of disease but may instead act as a downstream marker showing a correlative change that is directly proportional to the altered status of a particular pathway. Detection by PET of surrogate pharmacodynamic biomarkers represents a promising avenue for monitoring progression of disease and response to therapy and for imaging signal transduction.
PET OF SIGNAL TRANSDUCTION
Imaging Metabolic and Proliferative Biomarkers
18F-FDG and 18F-FLT are well-established tools for measuring general changes in cellular metabolism and proliferation, which have attracted wide attention for monitoring drug efficacy in the clinic (12). One elegant example of measuring a clearly defined pharmacodynamic change is furnished by 18F-FDG imaging in patients with gastrointestinal stromal tumor (13). Whereas anatomic changes in tumor size are often delayed or absent, 18F-FDG PET correlates with c-kit inhibition by imatinib (Gleevec; Novartis) therapy in gastrointestinal stromal tumor. In particular, unaltered tumoral 18F-FDG uptake from baseline to follow-up is indicative of primary resistance to c-kit kinase inhibitors, whereas reemergence of metabolic activity after a course of treatment implies acquired (secondary) resistance (13,14). This application of 18F-FDG PET has greatly simplified the management of patients with gastrointestinal stromal tumor and has had an impact on the design of other recent clinical trials (15). Similarly, 18F-FLT PET has been used to monitor the efficacy of several experimental treatments that affect cellular proliferation, including inhibition of epidermal growth-factor receptor by gefitinib (Iressa; AstraZeneca) (16) and monitoring the efficacy of aurora kinase inhibitors (17,18).
Although 18F-FDG PET and 18F-FLT PET are of proven utility in monitoring treatment response, these radiotracers are relatively nonselective for pathophysiologic processes. An important goal is to design radiotracers that provide a robust and well-defined correlation between the expression or activity of downstream pharmacodynamic biomarkers and aberrant signaling in tumors (19–21).
Imaging Androgen Receptor (AR) Signaling in Prostate Cancer
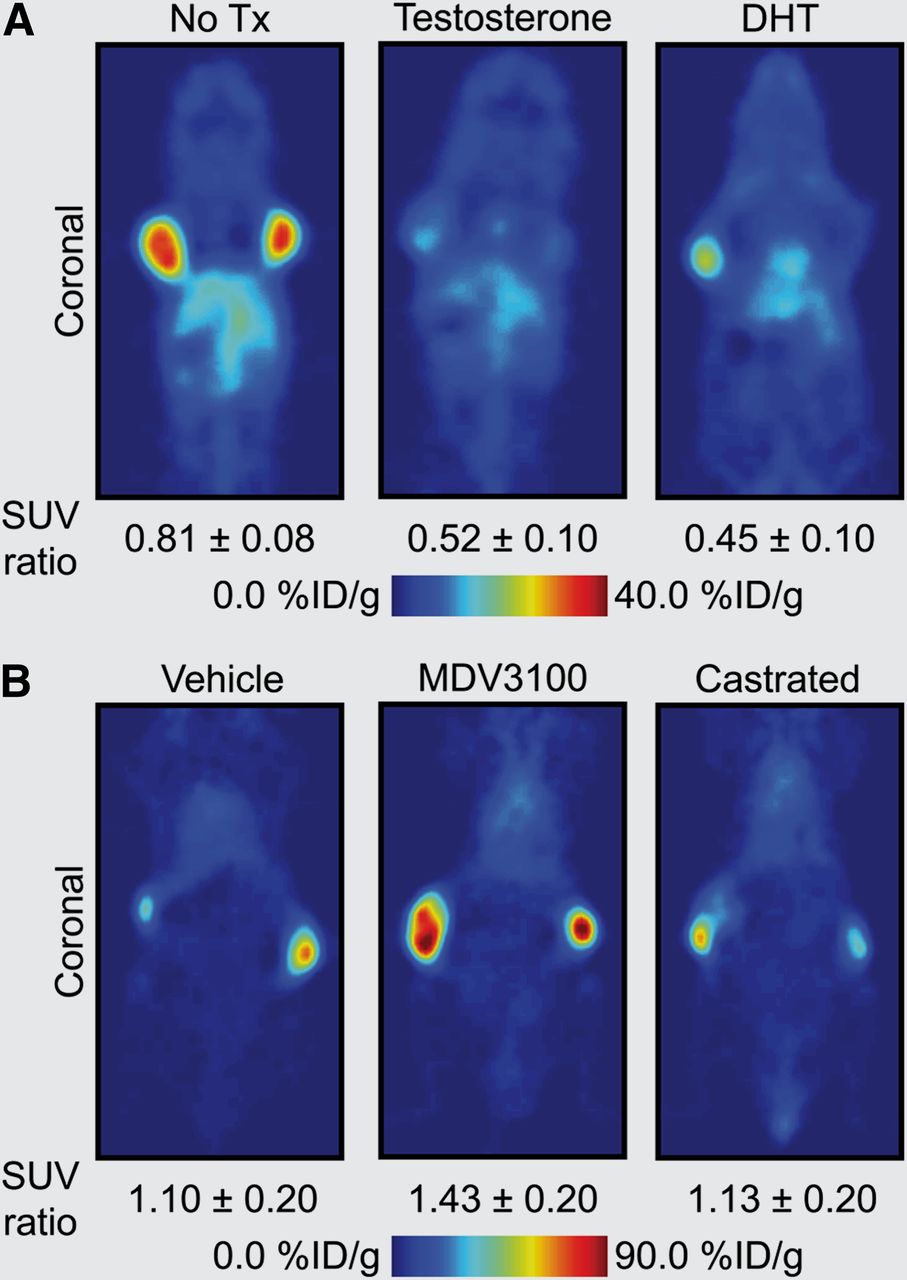
AR signaling in prostate cancer represents one of the most well-documented systems whereby monitoring signal transduction can provide clinically relevant information on disease stage, progression, and response to treatment (Fig. 1). In a recent study on prostate cancer, Evans et al. (20) demonstrated proof of the principle of pharmacodynamic pathway imaging—that is, imaging changes in a downstream biomarker as a surrogate measure of response to treatment-induced modulation of upstream signaling components. These authors used an inverse relationship between AR signaling and prostate-specific-membrane antigen (PSMA), a type II integral membrane glycoprotein. PSMA expression is well known to correlate with disease progression and patient outcome and can be examined as a prognostic biomarker for histology and imaging. First, in vitro and ex vivo experiments confirmed that androgen-induced AR signaling repressed PSMA gene transcription and protein expression—a result that was confirmed in vivo by observation of attenuated tumor uptake of the monoclonal anti-PSMA antibody 64Cu-J591 in castrated mice bearing CWR22rv1 tumors while under treatment with testosterone or dihydrotestosterone (Fig. 2A). The authors then showed that 64Cu-J591-immuno-PET could measure the efficacy of antiandrogen MDV3100 therapy. Because of the reciprocal relationship between AR signaling and PSMA expression, treatment with MDV3100 blocked AR signaling, leading to elevated PSMA and a concordant increase in radiotracer uptake in LNCaP-AR xenografts (Fig. 2B). Although the PET method used to image PSMA is not entirely new, considerable novelty and clinical relevance are derived from shifting the perspective of PSMA from a prognostic to a pharmacodynamic imaging biomarker.
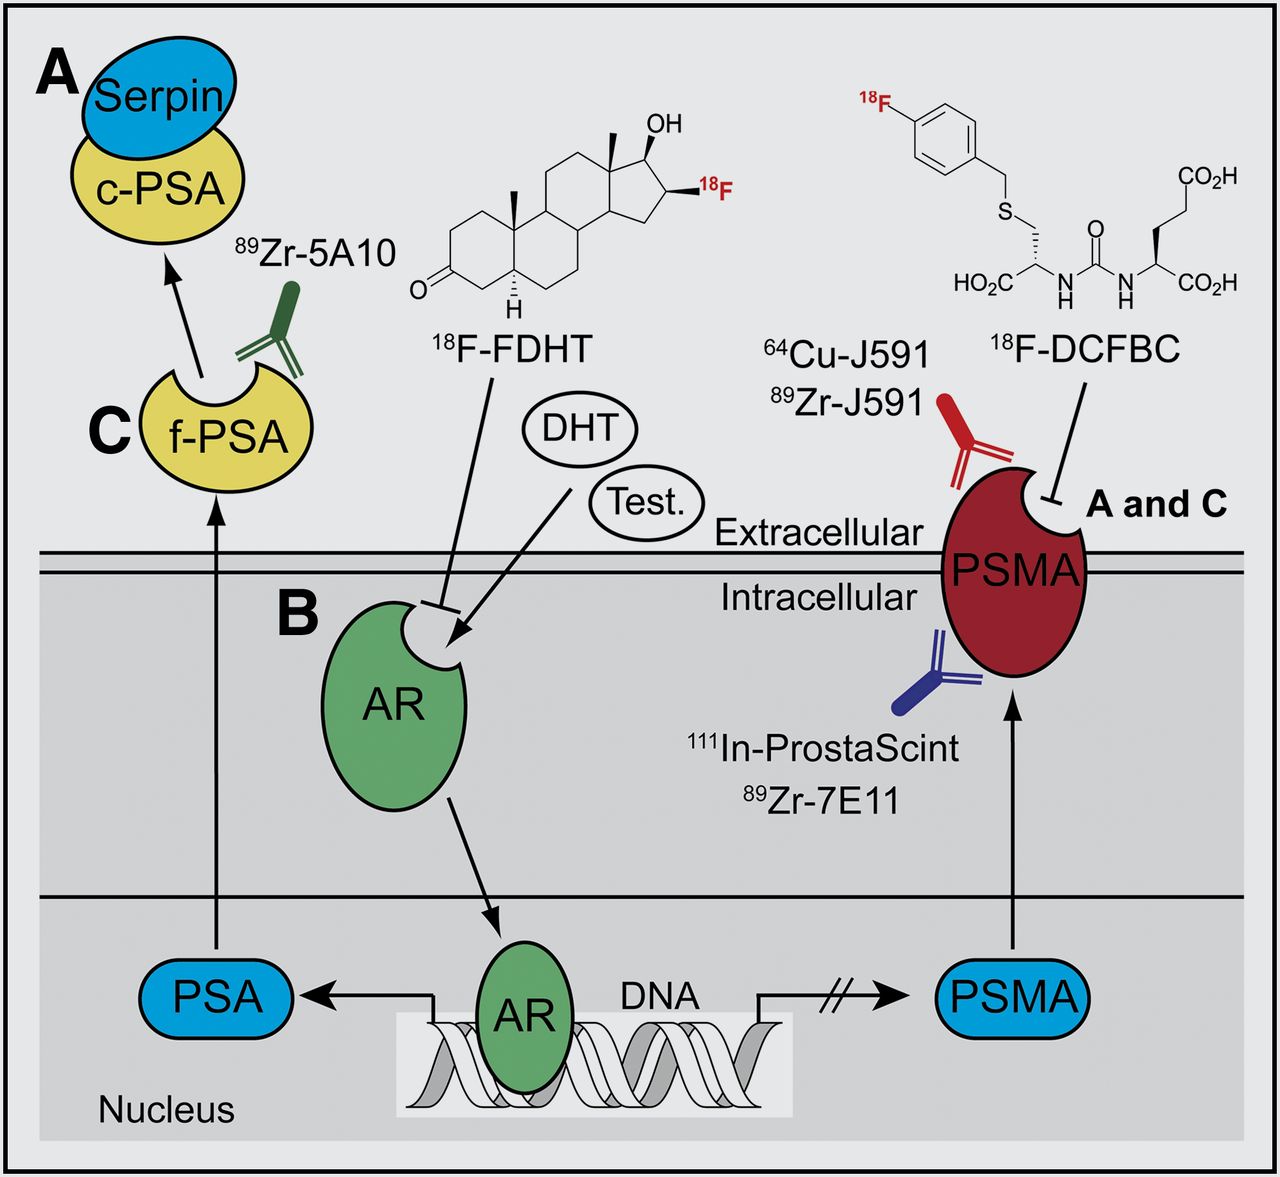
Simplified schematic of AR-signaling axis. Testosterone (Test.) and dihydrotestosterone (DHT) ligand binding induces AR activation, causing increased expression of PSA and repressing PSMA levels (20,21). (A) Catalytically inactive serpin-complexed PSA (c-PSA) is used as prognostic blood pool biomarker (6). (B) PET of AR occupancy using 18F-fluorodihydrotestosterone (18F-FDHT) and imaging PSMA expression using small-molecule (e.g., 18F-DCFBC [N-[N-[(S)-1,3-dicarboxypropyl]carbamoyl]-4-18F-fluorobenzyl-l-cysteine]) and immuno-PET radiotracers are being evaluated as potential predictive biomarkers in clinical trials (22–24). (C) Imaging catalytically active free PSA (f-PSA) and changes in PSMA levels can also be used as pharmacodynamic biomarkers for monitoring modulation of AR signaling in response to antiandrogens such as MDV3100 and, potentially, androgen biosynthesis inhibitors such as abiraterone (Zytiga).

64Cu-J591 immuno-PET images demonstrating use of PSMA as pharmacodynamic biomarker of changes in AR signaling in prostate cancer (20). (A) PET images demonstrating approximately 50% decrease in 64Cu-J591 uptake in testosterone- and DHT-treated vs. nontreated (No Tx) castrated nude mice bearing contralateral CWR22rv1 xenografts. (B) PET images showing increase in 64Cu-J591 uptake in MDV3100-treated vs. vehicle-treated or castrated nude mice bearing contralateral LNCaP-AR tumors (constitutively active AR signaling). Standardized uptake value ratio is mean tumor uptake of ratio (scan 2/scan 1) of 2 PET scans conducted before (scan 1) and after therapy (scan 2). (Images courtesy of Prof. Charles Sawyers, Memorial Sloan-Kettering Cancer Center.)
Recent work by Ulmert et al. has extended the paradigm for imaging AR signaling by developing the immuno-PET radiotracer 89Zr-5A10 for imaging of PSA—a member of the kallikrein-related peptidase family. Binding of 89Zr-5A10 is selective for the extracellular tissue expression of free PSA (Fig. 1) (21), as distinct from the catalytically inactive, serpin-complexed PSA, which is secreted in the blood pool and is used as a nonradiologic prognostic biomarker for screening and for monitoring treatment response (6). The combination of various small-molecule and antibody-based radiotracers targeting AR, PSA, and PSMA represents an emerging tool box for noninvasive PET characterization of AR signaling in prostate cancer with unprecedented biochemical detail (20–22).
Imaging Antimigratory and Antiproliferative Effects of Src Family Kinase (SFK) Inhibitors
SFKs control cellular migration and invasion and are common targets for molecular therapeutics, such as the clinically approved multi-Bcr/Abl and SFK inhibitor dasatinib (Bristol-Myers Squibb) (19). Expression of oncogenic SFKs is upregulated in several tumors, including chronic myelogenous leukemia, glioblastoma multiforme, pancreatic adenocarcinoma, breast cancer, and non–small cell lung cancer. SFK signaling is also necessary for the proper localization of cellular adhesion molecules such as αvβ3 integrin, which can contribute to cell invasion and metastasis formation. Recently, Dumont et al. exploited this connection to develop a novel noninvasive approach to imaging pharmacodynamic pathways for measuring response to dasatinib treatment in mice bearing U87MG xenografts (Fig. 3) (19). These authors showed that tumor uptake of the αvβ3-targeting ligand 64Cu-DOTA-c(RGDfK) (64Cu-DOTA-cyclo-(Arg-Gly-Asp-d-Phe-Lys)) fell by half in response to dasatinib. Thus, PET of αvβ3 integrin provides a pharmacodynamic readout of changes in the upstream SFK signaling upon drug treatment.
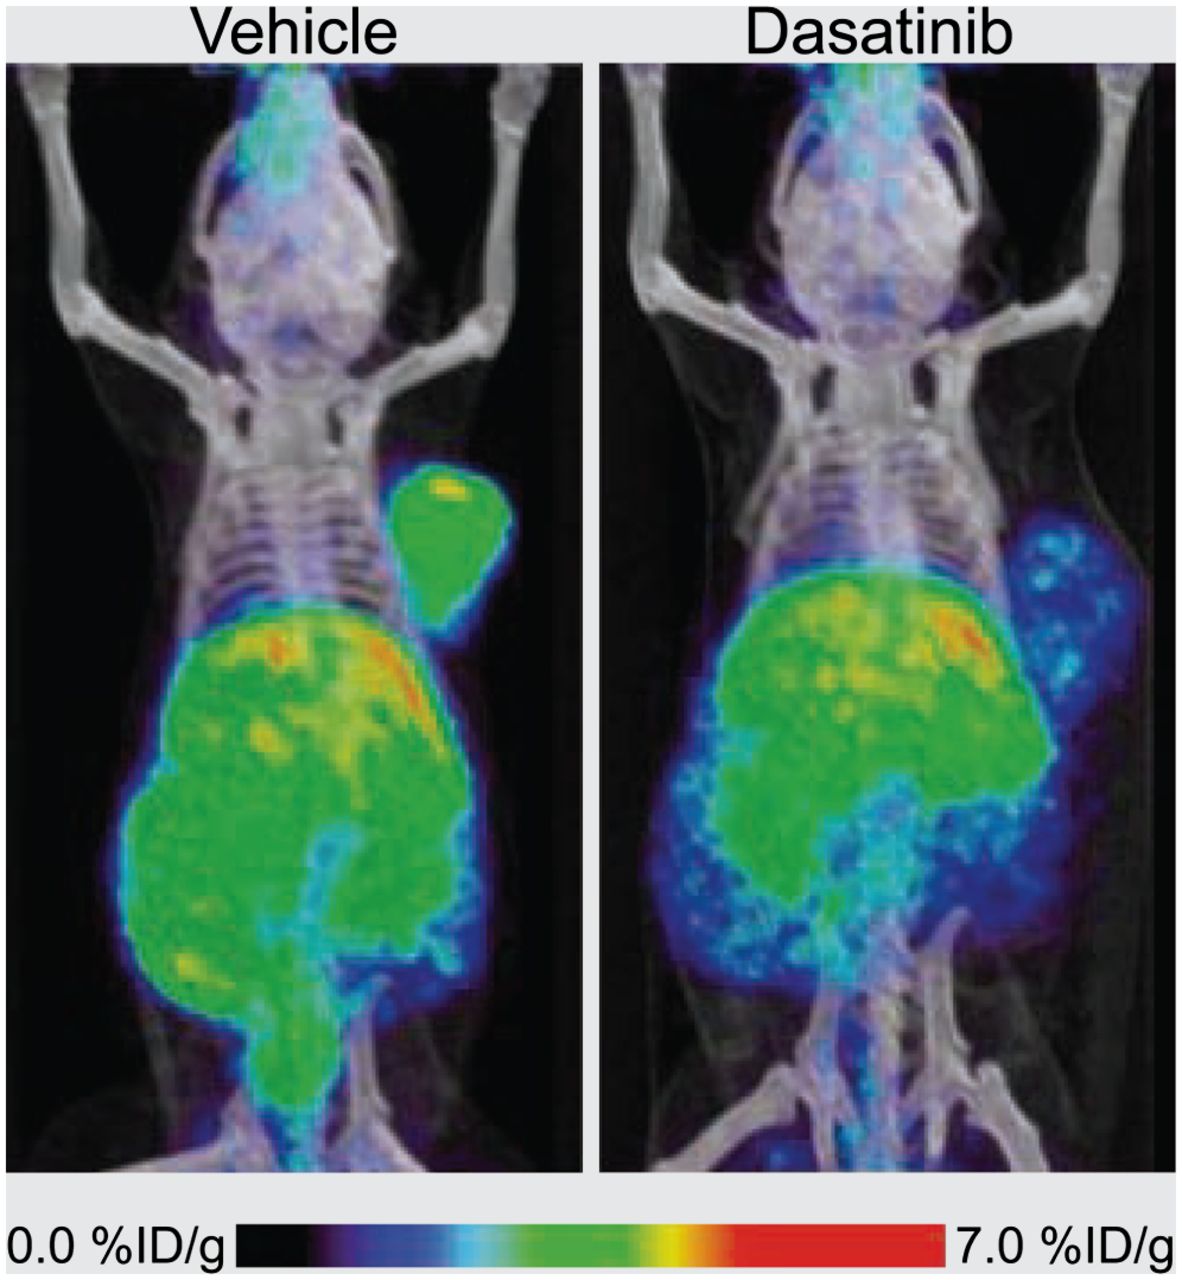
64Cu-DOTA-c(RGDfK) PET images of αvβ3 integrin in response to Src inhibition with dasatinib. (Left) PET radiotracer signal in control U87MG tumors. (Right) Loss of radiotracer uptake resulting from de-creased αvβ3 expression after dasatinib treatment. (Adapted with permission of (19).)
CONCLUSION
Examples of pharmacodynamic pathway imaging highlighted here demonstrate that knowledge of how and why a target is overexpressed in tumors enables molecular imaging to advance beyond mapping target densities and localizing lesions, toward providing a deeper understanding of the biochemical dynamics of disease progression and response to therapy. Crucially, current approaches to radiotracer chemistry are sufficient for addressing the challenge. However, we believe that significant gains in radiotracer performance and clinical success may be achieved when the nuclear medicine community fully embraces the complexities of cellular signaling through imaging changes in pharmacodynamic biomarker expression.
Acknowledgments
We thank Prof. Jason Lewis, Dr. Nagavarakishore Pillarsetty, Dr. Michael Evans, and Dr. David Ulmert for helpful discussions. This work was funded in part by the ETH Fellowship Program (FEL-01-10-1). No other potential conflict of interest relevant to this article was reported.
Footnotes
Published online Aug. 9, 2012.
- © 2012 by the Society of Nuclear Medicine and Molecular Imaging, Inc.
REFERENCES
- Received for publication April 22, 2012.
- Accepted for publication July 31, 2012.


Jump to section
Related Articles
Cited By...
- Molecular Imaging of Post-Src Inhibition Tumor Signatures for Guiding Dasatinib Combination Therapy
- Imaging Diagnostic and Therapeutic Targets: Steroid Receptors in Breast Cancer
- Effect of Platinum-Based Chemoradiotherapy on Cellular Proliferation in Bone Marrow and Spleen, Estimated by 18F-FLT PET/CT in Patients with Locally Advanced Non-Small Cell Lung Cancer
- Molecular Imaging Reveals Trastuzumab-Induced Epidermal Growth Factor Receptor Downregulation In Vivo