


Abstract
The plasma concentration of Epstein-Barr virus (EBV) DNA is associated with tumor burden and prognosis in patients with nasopharyngeal carcinoma (NPC), but data on the relationship between viral load and 18F-FDG PET functional parameters are lacking. We examined the association of 18F-FDG PET functional parameters and EBV DNA load with the clinicopathologic characteristics and clinical outcomes of patients with NPC. Methods: One hundred eight patients with NPC who underwent 18F-FDG PET before treatment were included in this study. We determined total lesion glycolysis (TLG) of the primary tumor, the cervical nodes, and their combination and the maximal standardized uptake value of the primary tumor and cervical lymph nodes. EBV DNA was measured by real-time polymerase chain reaction. Results: EBV DNA was significantly associated with total TLG (R2 = 0.589). Total TLG values had the highest correlation with EBV DNA load and were significantly associated with tumor, nodal, and overall stages. However, tumor TLG greater than the median (>65 g) was the only parameter significantly associated with overall, local recurrence-free, disease-free, and distant metastasis-free survivals (P = 0.033, 0.014, <0.001, and 0.023, respectively). After allowance for potential confounders, tumor TLG retained its independent significance for overall and disease-free survival rates (P = 0.045 and 0.006, respectively). Conclusion: Total TLG values are primarily associated with tumor burden and clinical stage, whereas tumor TLG is the best predictor of patient survival after treatment.
Nasopharyngeal carcinoma (NPC) is one of the most common types of head and neck cancer in Southeast Asia. NPC is a very radiosensitive tumor, and 5-y overall survival (OS) and disease-free survival (DFS) rates of up to 70% can be obtained by the use of concurrent chemoradiotherapy (1–3). However, some patients may still develop locoregional and distant failure, thus requiring salvage or palliative therapy (4–6). For these reasons, the development of more tailored treatment approaches can ultimately improve clinical outcomes.
The recognition of the importance of Epstein-Barr virus (EBV) in the pathogenesis of NPC (7–9) has stimulated a growing interest in EBV-based biomarkers for patients with this malignancy (10,11). Notably, the assessment of cell-free EBV DNA load may not only serve for detection of NPC (11) but also have value for prediction of prognosis and treatment outcomes. For instance, it has been reported that posttreatment EBV DNA levels may be clinically useful for monitoring tumor relapse (11–13).
Several investigators have examined the value of 18F-FDG PET functional parameters for treatment planning in different malignancies, including NPC (14–16). A novel functional parameter—termed total lesion glycolysis (TLG) and defined as the standardized uptake value (SUV) multiplied by metabolic tumor volume (MTV)—has been described previously (17). TLG integrates both anatomic and biologic data and has been shown to predict prognosis in breast, colorectal, and lung cancers (18–22). However, the prognostic value of TLG in patients with NPC has not been sufficiently evaluated. In addition, whereas EBV DNA levels are associated with tumor volume quantified by MRI (23), data on the relationship between viral load and 18F-FDG PET functional parameters are scarce (24).
In this study, we sought to examine the association of 18F-FDG PET functional parameters and EBV DNA load with the clinicopathologic characteristics and clinical outcomes of patients with NPC. The combined use of blood-borne biomarkers and imaging parameters may eventually provide an individually tailored approach to the treatment of NPC.
MATERIALS AND METHODS
Study Patients
Informed consent was obtained from all participants, and the study protocol was approved by the Hospital Ethics Committee. The study population consisted of 108 patients with newly diagnosed NPC who were consecutively recruited at Chang Gung Memorial Hospital, Lin-Kou, Taiwan, between January 2006 and August 2009. Patients with metastatic disease at presentation (M1 stage), with other malignancies, or who had been previously treated at other institutions were excluded.
The study participants were staged with the 2002 cancer staging system revised by the American Joint Committee on Cancer (25). All patients had biopsy-proven NPC and received a thorough examination before therapy and every 6 mo after treatment. In brief, the examinations included head and neck MRI, chest radiography, and abdominal ultrasound. Before treatment, all participants underwent 18F-FDG PET to confirm the initial clinical stage.
All patients received external-beam definitive radiotherapy for a cumulative dose of 64.8 Gy or higher. In keeping with our current treatment policy, all patients whose overall stage were 3 or greater received additional cisplatin-based concurrent chemoradiotherapy (1,2). Patients were followed every week during treatment and then every 3 mo for 2 y, every 4 mo for the next 2 y, and every 6 mo thereafter. Flexible fiberoptic nasopharyngoscopy was performed at each visit. A conventional work-up was performed 3 mo after completion of treatment and subsequently on a yearly basis or whenever clinically indicated.
The findings from 18F-FDG PET and MRI were discussed jointly by our NPC research team. When possible, imaging-guided biopsies were obtained for lesions suggestive of malignancy. If a biopsy of the lesion of interest was not feasible or yielded a negative result in patients with equivocal or positive imaging results, close clinical and imaging follow-up was pursued. Patients with residual tumors confined to the primary site of origin were classified as having local failure. Patients with residual tumors in the neck lymph nodes were classified as having regional failure. Patients with disease beyond the primary lesion and regional lymph nodes were classified as having distant failure.
Collection and Storage of Blood Plasma
Before treatment, blood samples (10 mL) were collected through venipuncture in tubes containing ethylenediaminetetraacetic acid. Immediately after collection, samples were centrifuged (2,000g) to obtain the separated plasma and were then stored in polypropylene tubes at −80°C until analysis. Samples were not exposed to more than 1 freeze–thaw cycle.
Quantitation of Plasma EBV DNA Load
DNA extraction and quantification of plasma EBV DNA load were performed as described previously (11,26,27).
Imaging with 18F-FDG PET/CT
All patients fasted for at least 6 h before 18F-FDG PET/CT. Imaging was performed with a PET/CT system (Discovery ST 16; GE Healthcare) consisting of a PET scanner and a 16-section CT scanner. Before acquisition of PET images, helical CT was performed from the head to the proximal thigh according to a standardized protocol with the following settings: transverse 3.0-mm collimation × 16 modes, 100 kVp, 100 mAs, 0.5-s tube rotation, 35-mm/s table speed, and pitch of 1.5. No intravenous iodinated contrast agents were administered. CT data were resized from a 512 × 512 matrix to a 128 × 128 matrix to match the PET data to fuse images and generate CT-based transmission maps. Emission scans from the head to the proximal thigh were acquired at 50–70 min after injection of 370 MBq of 18F-FDG. Images were acquired in 2-dimensional mode, 3 min per table position. PET images were reconstructed with CT used for attenuation correction and an ordered-subset expectation maximization iterative reconstruction algorithm (4 iterations and 10 subsets).
Image Analysis
Semiquantitative evaluation was performed with a Syngo MI Workplace (Siemens Healthcare). The SUVs were determined by the region-of-interest technique. The maximum SUVs (SUVmax) were obtained by drawing the regions of interest over the most intense slice of the primary tumor within the nasopharynx and the neck lymph nodes. The value was calculated as follows: SUV = (decay-corrected activity [kBq] per milliliter of tissue volume)/(injected 18F-FDG activity [kBq]/body weight in grams).
The MTV was measured from attenuation-corrected 18F-FDG PET images. The boundaries were drawn so as to include the primary tumor within the nasopharynx or metastatic regional lymph nodes in the axial, coronal, and sagittal 18F-FDG PET/CT images. To define the contouring margins around the target, an SUV of 2.5 was used. The contour around the target lesion inside the boundaries was automatically produced, and the voxels presenting SUV intensity greater than 2.5 within the contouring margin were incorporated to define the MTV. The TLG was calculated according to the following formula:
The TLG values of the primary tumor, cervical lymph nodes, and total tumor (defined as the sum of the signal intensities of the primary tumor plus the cervical lymph nodes) were designated as tumor TLG, nodal TLG, and total TLG, respectively. The SUVmax of the primary tumor and the cervical lymph nodes were termed tumor SUVmax and nodal SUVmax, respectively.
Validation of Measurement of 18F-FDG PET/CT Parameters
To validate all measured 18F-FDG PET/CT parameters, all values were processed using PET VCAR (volume computer-assisted reading) software on an Advantage Workstation (GE Healthcare). A fixed SUV threshold of 2.5 was applied as the lowest limit of the automatic segmentation criteria. The bounding box used for selecting the volume of interest was placed and checked on 3 sectional PET images (axial, coronal, and sagittal) to ensure that the entire lesion was entirely included in the 3 dimensions. The single-component modality was deselected to prevent the segmentation that may potentially derive from grabbing normal structures outside the volume of interest into the final calculation. The measurements of SUVmax, mean SUV, MTV, and TLG were uploaded automatically by the PET VCAR system.
Data Analysis
Continuous variables are presented as mean and SD. The correlation between PET parameters and plasma EBV DNA load was calculated by linear regression for continuous variables. All patients were followed until death or until December 2010. Univariate survival analyses were performed with the Kaplan–Meier method (log-rank test). The Cox proportional hazards regression model was used for multivariate analyses of the independent predictors for the rates of OS, DFS, local recurrence-free survival (LRFS), neck recurrence-free survival (NRFS), and distant metastasis-free survival (DMFS). All tests were 2-sided, and P values less than 0.05 were considered statistically significant.
RESULTS
Patient Characteristics
The general characteristics of the study participants are summarized in Table 1. At the time of the last follow-up, 88 patients were alive and 14 were dead. Thirty-one patients had tumor relapses after treatment. Sites of failure were as follows: local failure alone (n = 5), neck failure alone (n = 3), distant failure alone (n = 11), local and neck failure (n = 1), local and distant failure (n = 8), and neck and distant failure (n = 3) (Fig. 1).
General Characteristics of Study Participants

Flowchart of NPC patients throughout study (n = 108). AWD = alive with disease; DOD = die of disease; NED = no evidence of disease.
Validation of Measurement of 18F-FDG PET/CT Parameters
All measured values of 18F-FDG PET/CT parameters derived from 2 different systems (Syngo MI Workplace and PET VCAR) were analyzed. The results indicated a marked degree of correlation between the 2 different measurement systems for all 18F-FDG PET parameters, including tumor TLG (R2 = 0.996, P < 0.0001), nodal TLG (R2 = 0.998, P < 0.0001), total TLG (R2 = 0.997, P < 0.0001), tumor SUVmax (R2 = 0.998, P < 0.0001), and nodal SUVmax (R2 = 0.999, P < 0.0001).
Association Between EBV DNA Load and 18F-FDG PET Parameters
Linear regression analysis revealed the potential association between EBV DNA load and all 18F-FDG PET parameters, including tumor TLG (R2 = 0.251), nodal TLG (R2 = 0.447), total TLG (R2 = 0.589), tumor SUVmax (R2 = 0.199), and nodal SUVmax (R2 = 0.462, Table 2). The results indicated only total TLG was significantly correlated with EBV load.
Correlation Analyses of 18F-FDG PET Functional Parameters and EBV DNA Copy Number (mL−1) for Untreated NPC Patients
Clinicopathologic Characteristics, 18F-FDG PET Parameters, and EBV DNA Load
As shown in Table 3, higher T stages were associated with increased tumor TLG, total TLG, tumor SUVmax, and EBV DNA load. Compared with patients with N0 or N1 disease, those with N2 or N3 disease had higher nodal TLG, total TLG, nodal SUVmax, and EBV DNA load. Similarly, patients with advanced NPC (stage III or IV) had higher tumor TLG, nodal TLG, total TLG, nodal SUVmax, and EBV DNA load than those with early disease (stage I or II). We did not find any significant association of 18F-FDG PET parameters with age, sex, or the pathologic classification (Table 3).
Association of 18F-FDG PET Functional Parameters and EBV DNA Copy Number with Clinicopathologic Characteristics of NPC Patients
18F-FDG PET Parameters, EBV DNA Load, and Treatment Outcomes
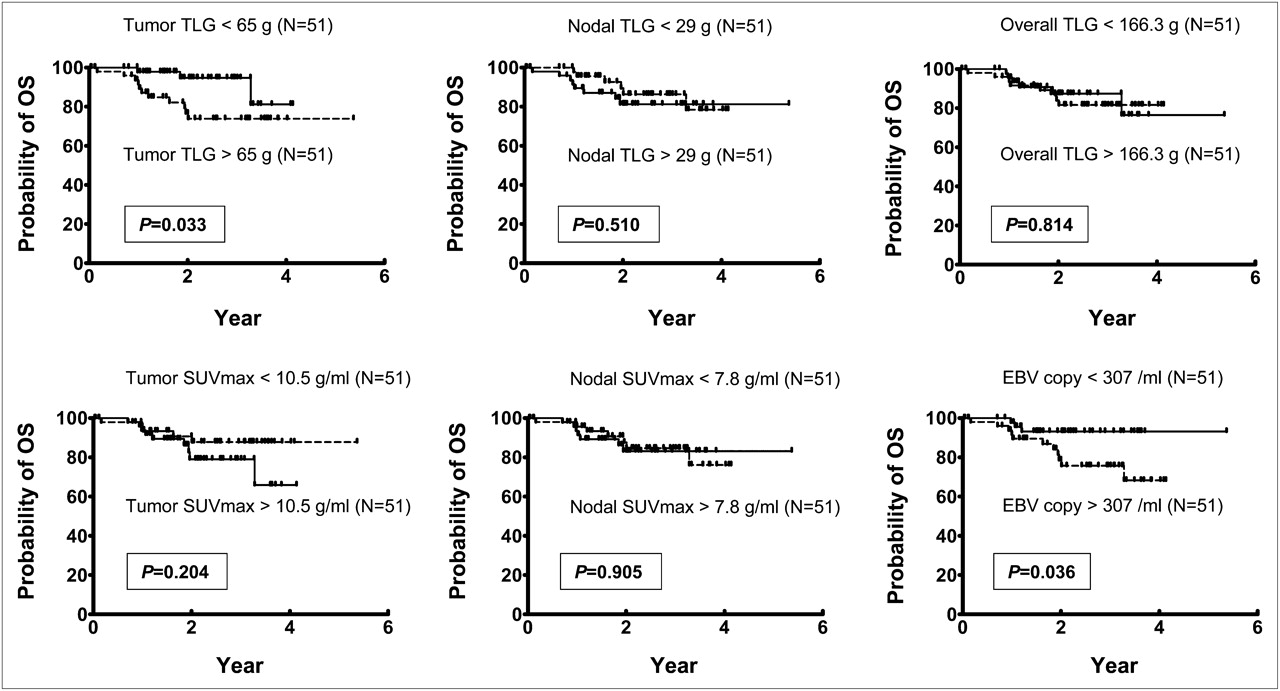
Of the 108 study participants, 102 had complete standard treatment and routine follow-ups. These patients were divided into 2 equal groups (n = 51 each) on the basis of the median values of each 18F-FDG PET parameter and EBV DNA load. As shown in Figure 2, Kaplan–Meier survival curves for OS did not differ significantly when patients were stratified according to the median value of nodal TLG, total TLG, tumor SUVmax, and nodal SUVmax. However, patients with higher values of tumor TLG and EBV DNA load had a significantly poorer OS (P = 0.033 and 0.036, respectively), although the longest follow-up period for higher tumor TLG subgroup was only 4.13 y. Tumor TLG was the only parameter statistically significantly associated with LRFS (P = 0.014). Compared with patients who had a tumor TLG less than 65 g (LRFS, 88.0%), those with tumor TLG greater than the median had an LRFS of 66.2%. Kaplan–Meier survival curves for NRFS did not differ significantly when patients were stratified according to the median value of all 18F-FDG PET parameters and EBV DNA load (data not shown). As shown in Figure 3, tumor TLG was the only parameter significantly associated with DFS (P < 0.001). Compared with patients who had a tumor TLG less than 65 g (DFS, 79.9%), those with TLG greater than the median had a DFS of 37.4%. Kaplan–Meier survival curves for DMFS did not differ significantly when patients were stratified according to the median value of nodal TLG, total TLG, tumor SUVmax, and nodal SUVmax. However, as shown in Figure 3, tumor TLG and EBV DNA load were significantly associated with DMFS (P = 0.023 and 0.036, respectively). Compared with patients who had a tumor TLG less than 65 g (DMFS, 72.3%), those with a tumor TLG greater than the median had a DMFS of 60.5%. In addition, patients with an EBV DNA load less than 307/mL (DMFS, 83.7%) had a better DMFS than those with an EBV DNA load greater than the median (DMFS, 55.8%). Furthermore, when we stratified the patients by both tumor TLG and EBV DNA load, we found that the patients with higher levels of both tumor TLG and EBV DNA load had significantly worse prognosis in OS, DFS, and DMFS (P = 0.007, 0.015, and 0.012, respectively) but not in LRFS and NRFS (P = 0.082 and 0.505, respectively).

Kaplan–Meier estimates of OS rates for patients with NPC stratified according to median values of distinct 18F-FDG PET functional parameters and EBV DNA load. Statistically significant differences by log-rank test are given.

Kaplan–Meier estimates of DFS and DMFS rates for patients with NPC stratified according to median values of TLG measurement by 18F-FDG PET and EBV DNA load. Statistically significant differences by log-rank test are given.
To determine whether various 18F-FDG PET parameters and EBV DNA load can be used as independent predictors of different outcomes, we conducted a multivariate analysis of OS, LRFS, NRFS, DFS, and DMFS with Cox proportional regression models. Adjustment was also performed for age at onset, sex, and overall clinical stage. Our results indicated that higher values of tumor TLG (P = 0.045) and EBV DNA load (P = 0.035) retained their independent prognostic significance for poorer OS. Cox regression analysis also showed that a higher value of tumor TLG was also an independent prognostic factor for poorer DFS (P = 0.006, Fig. 4).

Multivariate Cox regression analyses of OS, DFS, and DMFS for patients with NPC stratified according to median values of distinct 18F-FDG PET functional parameters and EBV DNA load. Multivariate model included age, sex, overall stage, tumor TLG, nodal TLG, total TLG, tumor SUVmax, nodal SUVmax, and EBV DNA load as covariates. Results showed that tumor TLG values and EBV DNA load were independent predictors of OS, whereas tumor TLG independently predicted DFS. CI = confidence interval; HR = hazard ratio.
DISCUSSION
Evidence suggests that plasma EBV DNA is a prognostic marker in NPC patients, but its clinical utility has not been fully established (28–32). Our previous studies have also indicated the value of serum levels of MIP-3α, cystatin A, vascular endothelial growth factor, and IL-8 for predicting outcomes in this malignancy (26,27,33). In addition, we have recently shown that the plasma EBV DNA copy number was significantly correlated with concentrations of these blood markers, further strengthening the concept that EBV DNA load is the core biomarker in the setting of NPC tumorigenesis (27). Notably, Ma et al. have recently reported that the level of circulating EBV DNA was significantly associated with NPC tumor volume as assessed by MRI as well as SUV of the primary tumor and the metastatic lymph nodes (23), but they did not demonstrate the measurement of other 18F-FDG PET functional parameters. Wang et al. addressed the potential utility of posttreated plasma EBV DNA and 18F-FDG PET in detecting tumor relapse after treatment, but they did not evaluate any pretreated measurement of EBV DNA load and 18F-FDG PET as described in the current study (34).
We have previously shown that 18F-FDG PET is more sensitive than skeletal scintigraphy for the detection of bone metastases in patients with NPC at the initial staging (16). In addition, 18F-FDG PET is superior to MRI for identifying lower neck nodal metastases from NPC before treatment (35,36) and ensures an improved detection of tumor relapse in the primary site, cervical lymph nodes, and distant sites after treatment (15,36–38). For these reasons, 18F-FDG PET is increasingly used in the clinical staging, treatment planning, and monitoring of patients with NPC. Although evaluation of SUVmax by 18F-FDG PET has been shown to predict prognosis after treatment of NPC (39), the relationships between different 18F-FDG PET functional parameters and EBV DNA load has not been described before. The results from this study suggest that tumor TLG, nodal TLG, total TLG, tumor SUVmax, and nodal SUVmax were all significantly associated with plasma EBV DNA load. The highest degree of correlation was obtained between total TLG and EBV DNA load, suggesting a close association between this blood biomarker and the MTV and activity as assessed by 18F-FDG PET.
We found that an association existed between tumor TLG and SUVmax with more advanced tumor stages as assessed by MRI. Similarly, nodal TLG values and SUVmax were found to be related to more advanced nodal stages. However, only total TLG and EBV DNA load were consistently and significantly associated with tumor, nodal, and overall clinical stages. Taken together, these results indicate that total TLG as assessed by PET in patients with NPC is closely associated with TNM stages as defined by MRI. In addition, the current study shows that there were no differences between the pathologic classifications of NPC tumors and the MTV and activity as quantified by various functional 18F-FDG PET parameters. In keeping with previous data (12,13,26,27,40), this study confirms the prognostic value of baseline EBV DNA load for predicting OS. We also found that tumor TLG values were higher than the median predicted poor rates of OS, LRFS, DFS, and DMFS by univariate analysis, and they were independently associated with OS and DFS after multivariate Cox regression analysis. These findings suggest that pretreatment primary tumor TLG values may be used to predict the prognosis of NPC treatment, whereas total TLG had the highest degree of correlation with EBV DNA load and TNM clinical stages. This apparent discrepancy may be explained, at least in part, by the fact that tumor relapse in the cervical lymph nodes is relatively unusual after current NPC treatment, compared with relapses at either primary or distant sites (41,42). In addition, relapse at the cervical lymph nodes can be generally managed by salvage surgery (e.g., with radical neck dissection) (6). In this context, the adverse prognostic impact of nodal recurrence is generally lower than that of tumor or distant relapse. This may also account for the observation that nodal TLG, nodal SUVmax, and even total TLG (which partially depends on nodal TLG values) did not predict certain survival endpoints.
CONCLUSION
This study conducted in patients with NPC suggests that total TLG values are mainly associated with tumor burden and clinical stage, whereas tumor TLG is the best predictor of rates of OS, DFS, and DMFS after treatment. These findings provide additional evidence supporting the use of 18F-FDG PET in the clinical management of patients with NPC. Further studies are needed to clarify whether the combined assessment of 18F-FDG PET functional parameters and EBV DNA level can improve patient outcomes through an optimized biomarker-guided and imaging-guided treatment strategy.
DISCLOSURE STATEMENT
The costs of publication of this article were defrayed in part by the payment of page charges. Therefore, and solely to indicate this fact, this article is hereby marked “advertisement” in accordance with 18 USC section 1734.
Acknowledgments
This study was supported by grants NSC99-2314-B-182A-034-MY3 from the National Science Council; DOH99-TD-C-111-006 from the Department of Health; and CMRPG390641 and CMRPG390642 from Chang Gung University and Chang Gung Memorial Hospital, Taiwan. No other potential conflict of interest relevant to this article was reported.
- © 2012 by the Society of Nuclear Medicine, Inc.
REFERENCES
- Received for publication March 18, 2011.
- Accepted for publication August 17, 2011.


Jump to section
Related Articles
Cited By...
- Relationship of 18F-FDG PET/CT metabolic, clinical and pathological characteristics of primary squamous cell carcinoma of the cervix
- 18F-FDG PET/CT of Non-Small Cell Lung Carcinoma Under Neoadjuvant Chemotherapy: Background-Based Adaptive-Volume Metrics Outperform TLG and MTV in Predicting Histopathologic Response
- [18F]-Fluorodeoxyglucose Positron Emission Tomography Standardized Uptake Value as a Predictor of Adjuvant Chemotherapy Benefits in Patients With Nasopharyngeal Carcinoma
- Prognostic Value of Metabolic Tumor Volume and Total Lesion Glycolysis in Head and Neck Cancer: A Systematic Review and Meta-Analysis
- Textural Features of Pretreatment 18F-FDG PET/CT Images: Prognostic Significance in Patients with Advanced T-Stage Oropharyngeal Squamous Cell Carcinoma