


Abstract
The purpose of this study was to measure the errors introduced by regular calibration of PET/CT scanners and to minimize the effect of calibration error on standardized uptake value measurements. Methods: Global calibration factors from 2 PET/CT scanners were recorded for 3.5 and 1.8 y, comparing manufacturer-recommended protocols with modified protocols to evaluate error contributions due to operator-influenced procedures. Dose calibrator measurements were evaluated using National Institute of Standards and Technology–traceable sources. Results: Dose calibrator variability was less than 1%, although there was a consistent bias. Global scaling variability was reduced from 6% to 4% for scanner 1 and from 11% to 4% for scanner 2 when quality assurance and quality control procedures were applied to the calibration protocol. When calibrations were done using a 68Ge/68Ga phantom, the variability for both scanners was reduced to approximately 3%. Conclusion: Applying quality assurance and quality control procedures to scanner calibration reduces variability, but there is a still a residual longitudinal scanner variability of 3%–4%. The procedures proposed here reduce the impact of operator error on scanner calibration and thereby minimize longitudinal variability in standarized uptake value measurements.
Imaging of cancer with combined PET and x-ray CT scanners has become a standard component of oncology diagnosis and staging ( 1, 2). With lung cancer, for example, PET/CT of 18F-FDG uptake allows a more accurate detection of both nodal and distant forms of metastatic disease ( 3), and tumor stage is still the most important prognostic factor for predicting the survival of patients with non–small cell lung cancer ( 4). In addition, metabolic activity of cancerous cells may prove a more reliable indicator of therapeutic response than changes in tumor size ( 5). In light of an increasing need for effective diagnostic tools, and more accurate assessment of treatment response, PET/CT is becoming more important as a quantitative monitor of individual response and an evaluation tool for new drug therapies ( 6– 8).
Quantitatively accurate images of tracer uptake are possible with PET, but there is often an unknown global bias and variance ( 9). In the primary application of PET for clinical diagnosis and staging of cancer, qualitative image fidelity is of paramount importance and accurate global quantification is not necessary ( 10). However, inaccuracies in image quantification measures can significantly affect successful evaluation of therapeutic response ( 11).
The goal of PET scanners is to measure radioactive concentration—for example, units of kBq/mL in a volumetric PET image. The measured concentration depends on the amount of activity injected and distribution inside the patient. The standardized uptake value (SUV) has become the commonly reported unit of uptake in clinical PET (
12). The SUV is defined as
The measured radioactivity concentration, R, is calculated as
In principle, measuring g corrects for global sensitivity variations. However, scanner calibrations typically occur quarterly or semiannually and so cannot compensate for variations in g that occur on a time scale shorter than months. There is little information available on the time-varying behavior of g. Studies by Doot et al. show that over a period of minutes to a few hours, the global efficiency variation is less than 0.5% ( 15). We report on scanner variability over longer periods (e.g., quarterly), which, to our knowledge, has not been reported previously.
Figure 1 illustrates the effect of incorrect global calibration on SUVs estimated from a patient scan. In this case, the calibration factor of Equation 3 deviated by 19.8% above the subsequently determined true value. The scan was reconstructed with the erroneous scale factor and was also processed again after the calibration procedure was repeated to correct the known error. The images show that the SUV in the scan reconstructed with the erroneous scale factor deviates from the SUV of the corrected scan by 19.8%.
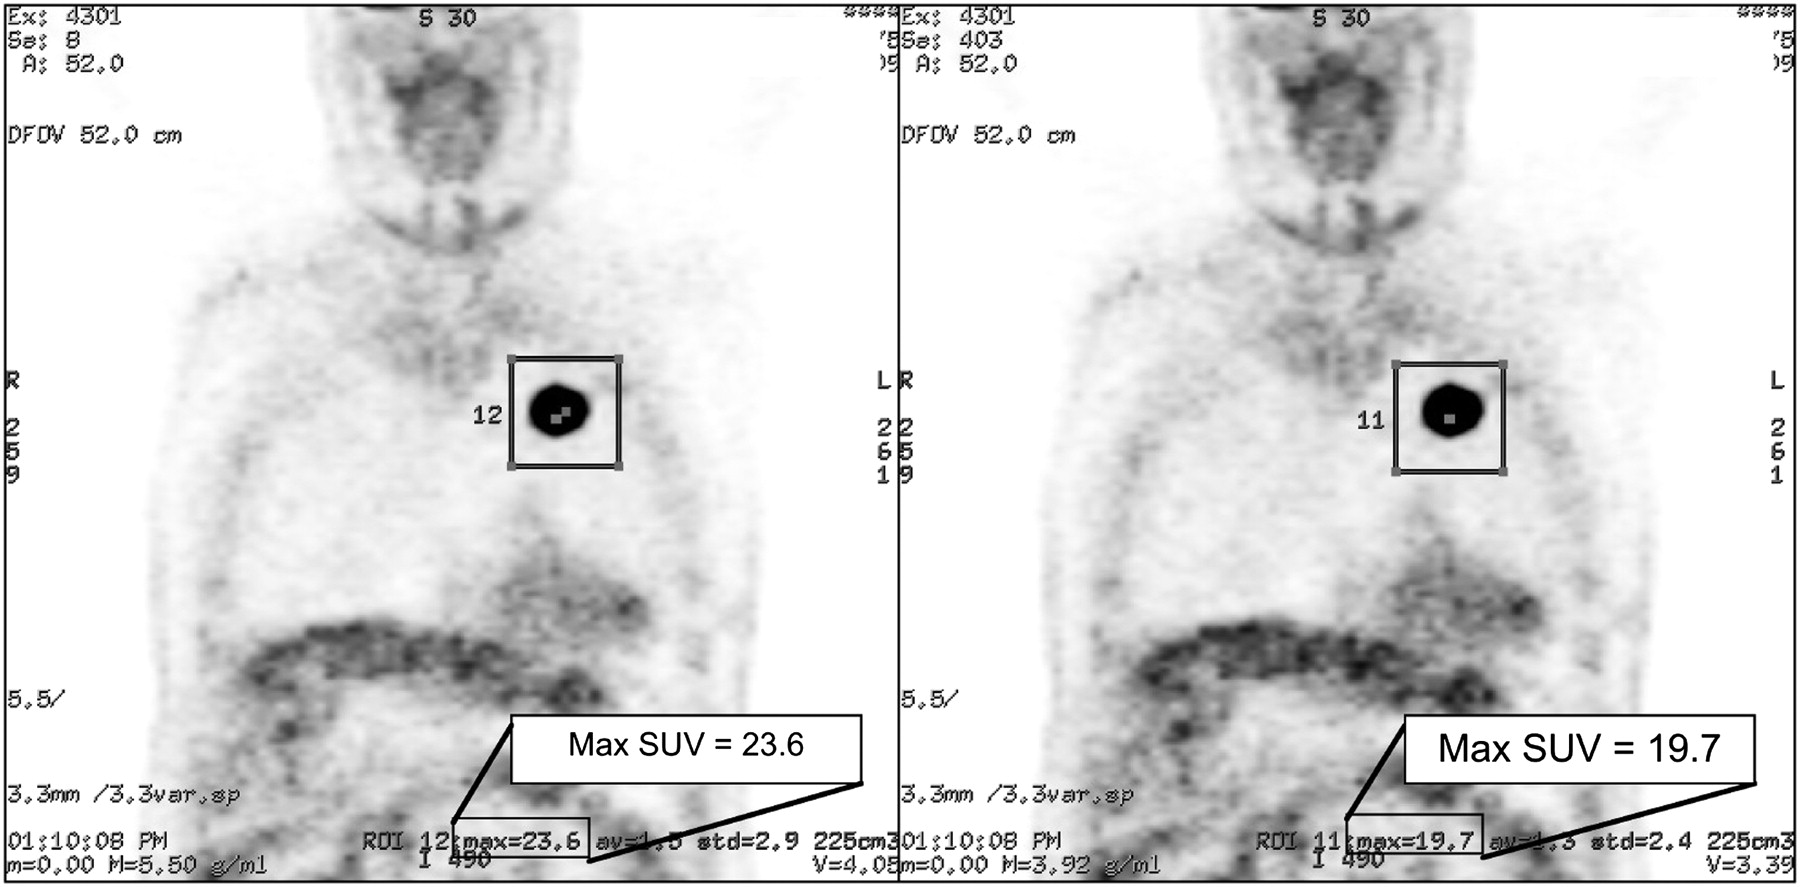
Patient scan reconstructed with erroneous scanner calibration scale factor (left) and again with corrected calibration (right). There is no visual difference between images, but erroneous SUV is 19.8% higher than corrected SUVs for highlighted region of interest (box). Max = maximum; ROI = region of interest.
The dose calibrator is another potential source of error in global scaling of PET image values. A National Institute of Standards and Technology (NIST)–traceable standard for 18F was recently developed as a means of monitoring accuracy and precision in dose calibrator measurements of 18F-labeled PET tracers ( 16). As much as a 10% shift in absolute calibration has been observed when comparing dose calibrator models from the 2 predominant manufacturers of dose calibrators ( 17). This intercalibrator variability is important for multisite studies and comparisons. To understand the significance of intracalibrator variability, we note that the dose calibrator is used to obtain 2 of the values in Equation 1: the scale factor g and the patient dose (d′); therefore, any constant bias in the dose calibrator measurements will cancel out. The 2 dose calibrator readings, however, are performed on different days. Thus, it is important to understand the longitudinal variability of an individual dose calibrator used for both scanner calibration and patient SUV measurements and any potential differences in longitudinal drift of measurement biases between the dose calibrator and PET scanner.
As a third source of error, inspection of Equations 1 and 3 indicates many radioactivity, time, and weight values that need to be measured and recorded properly for proper SUV quantification of PET images. In other words, there is a substantial opportunity for operator errors. A survey of procedures finds 9–15 operator-dependent steps for both Equation 1 and Equation 3. Errors made in the estimation of the global scale factor g ( Eq. 3) will affect all subsequent patient images—for example, Figure 1.
In this paper, we investigate the sources of error in instrument calibration and explore a new procedure to minimize the effect that human procedural inconsistencies have on scanner stability and calculated activity-correction factors. We evaluated the precision of activity-correction factors over a multiyear period on 2 PET/CT scanners and implemented a new procedure to detect and correct errors in the calibration process. The goal was to preclude erroneous patient SUV measurements such as the ones shown in Figure 1.
MATERIALS AND METHODS
We evaluated the sources of calibration error on 2 of the same model of PET/CT scanner (Discovery STE; GE Healthcare) located in 2 different medical imaging centers. On these scanners, the global calibration factor, g in Equations 2 and 3, is called the activity-calibration factor. The calibration factor variability for these scanners was evaluated using uniform cylinders filled with either 18F in water or 68Ge/68Ga in epoxy matrix.
Scanner Calibration Measurements
The manufacturer-recommended protocol comprises quarterly estimation of the calibration factor using a water-filled phantom (diameter, 20 × 20 cm) containing 18F ( 18) (half-life, 110 min ( 19)). In addition, we added a modified procedure using a phantom of the same size, with the longer-lived cylindric source (diameter, 20 cm) containing 68Ge/68Ga in epoxy. In all cases with scanner measurements, the actual isotope used (either 18F or 68Ge/68Ga) was entered into the examination acquisition parameters for appropriate compensation of the branching ratio ( 20). The half-life of 68Ge is 270.8 d, which decays to 68Ga—a positron emitter (half-life, 68.3 min). The manufacturer of the 68Ge/68Ga phantom (Sanders Medical) reports an activity level accuracy of ±10%. The use of a 68Ge/68Ga phantom allowed us to calibrate the scanner with exactly the same source over the course of many months and thus eliminate variability of calibration source activity. Although a bias in the activity level exists, that bias remains the same while using the same phantom. We adhered to the manufacturer-recommended protocol, except that we used an increased frequency of measurement and added the 68Ge/68Ga phantom measurements, which were not used to calculate the calibration factors used for patient scans. Activity-correction factors were calculated and recorded for both 2-dimensional (2D) and 3-dimensional (3D) acquisition modes on the same day using the same calibration phantom.
An activity check was performed using the same 68Ge/68Ga calibration phantom. In this case, a slightly modified patient protocol, with a shorter scan time than prescribed clinically, was used to scan and reconstruct the phantom images. A cubic region of interest (ROI) was placed in the center of the image, sized as large as reasonably possible while remaining away from the edges of the active source volume to avoid resolution loss. From these ROI values, the activity concentration as measured by the scanner was recorded and compared with the reported value. If the reported activity was more that 5% different from the expected value, the calibration factors were recorded but not used for patient scans, and the calibration procedure was repeated.
The calibration factors were recorded over a 3.5-y period for scanner 1 and at 21 mo for scanner 2. Several calibration factors were identified as incorrect because of operator error and were rejected before any patient scans were obtained. The data were analyzed both with and without the known erroneous calibration factors.
Dose Calibrator Measurements
Serial dose calibrator measurements were taken using a NIST-traceable dose calibrator standard 68Ge/68Ga solid-matrix aliquot configured for measurements using the 18F setting with a typical dose calibrator syringe holder (as specified by the manufacturer, RadQual, Inc.). The same dose calibrator (Capintec-127R) was used for all 18F dose assays injected into the calibration phantom. Measurements were recorded with dose calibrator settings for both 68Ge/68Ga and 18F (using the 68Ge/68Ga source) and compared with the expected values calculated from standard exponential decay (half-life, 270.8 d) from a known initial value of 19.5 MBq ± 1.31%. In addition to the serial measurements using the NIST-calibrated 68Ge/68Ga aliquot, daily constancy measurements performed by nuclear medicine technologists were extracted for 3 y as another measure of dose calibrator variation over time. The daily measurements were done using a NIST-traceable 137Cs standard source placed in the syringe holder of the dose calibrator. We evaluated the percentage deviation from the expected value using the decay rate of the radioactive source from the nominal initial value provided by the manufacturer.
RESULTS
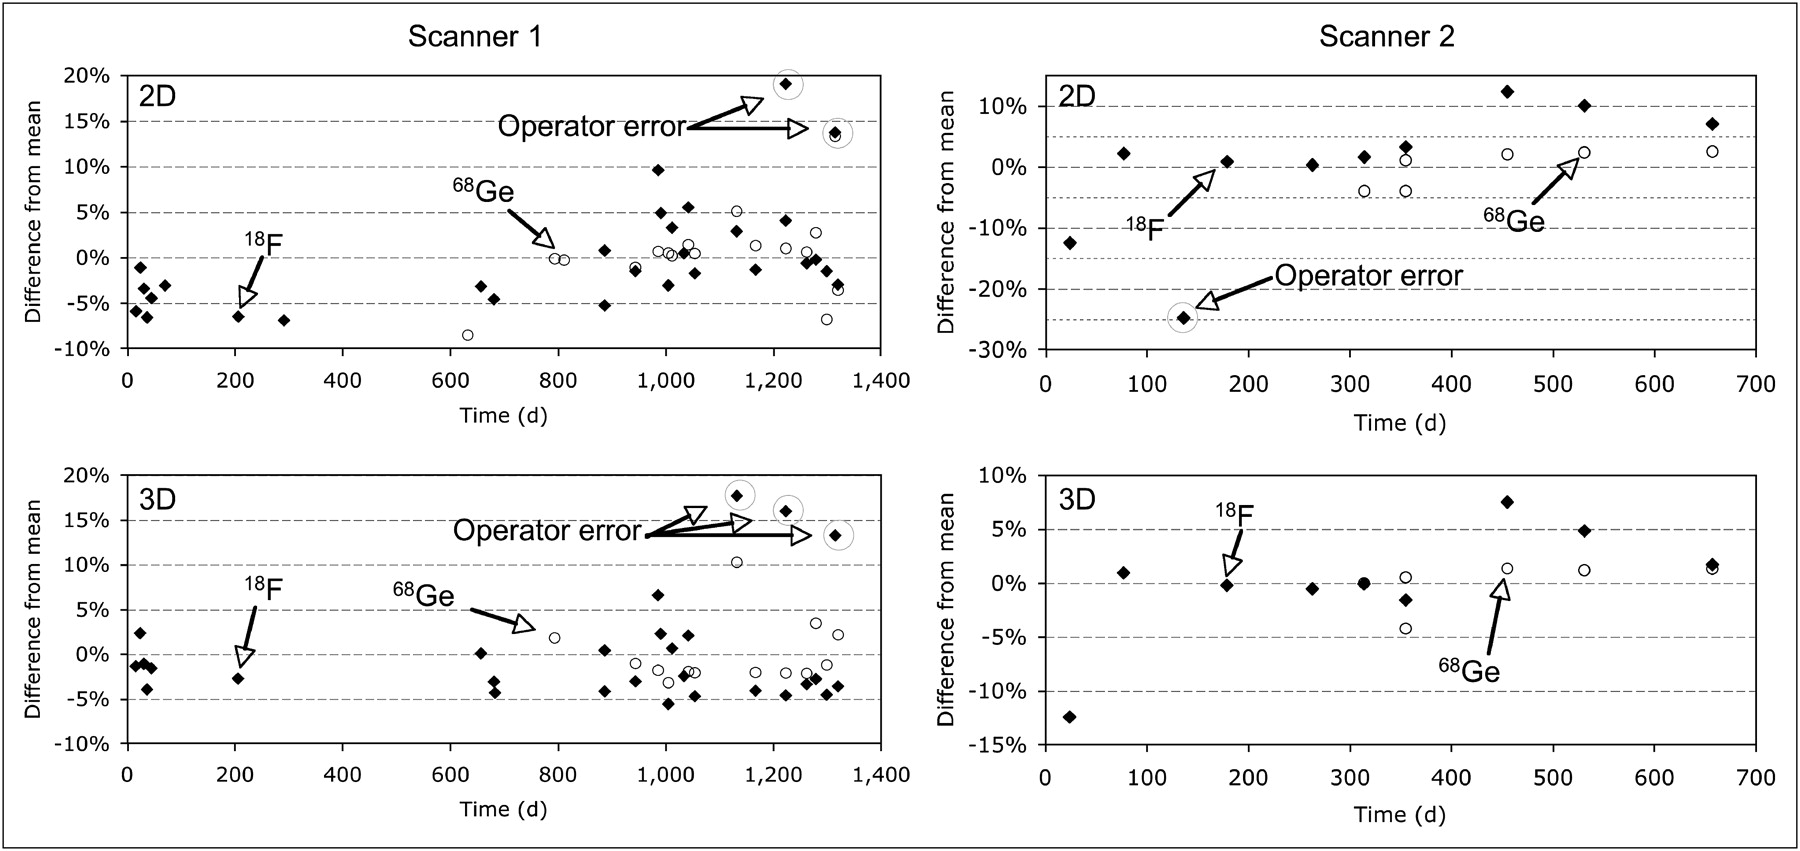
Figure 2 shows variations in the scanner calibration values generated using both 18F and 68Ge/68Ga source cylinders collected from 2 scanners in 2D and 3D modes. Outlier values due to identified operator error are highlighted. The operator errors were distributed throughout all steps in the process of measurement, data recording, and data entry that are involved in scanner calibration. Histograms of all scanner calibration values are shown in Figure 3 for scanner 1.

Percentage deviation of scanner calibration values for 2D and 3D activity-correction factors for 2 scanners with both 18F and 68Ge/68Ga sources.

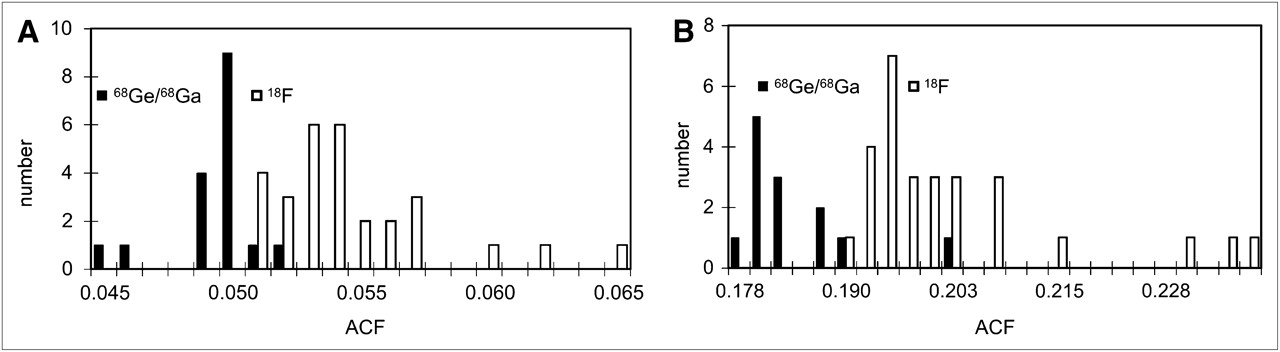
Histograms of scanner calibration values for scanner 1 generated using 18F and 68Ge/68Ga for 2D (A) and 3D (B) acquisition modes. ACF = activity-correction factor.
Figure 3 shows the distribution of measured calibration factors from scanner 1. The mean calibration factors differ between 18F and 68Ge/68Ga by approximately 8.5% for both 2D and 3D calibration scans. This is most likely due to a bias in the manufacturer-reported activity value of the 68Ge/68Ga source. Means, SD, and coefficients of variation were calculated with and without known outlier values for both scanners ( Table 1). The 95% confidence interval for the coefficient of variation for each system was calculated assuming a normal distribution. In addition, the maximum observed change in the scanner calibration value between 2 consecutive calibrations was reported to illustrate the maximum potential change before and after calibration.
Statistical Analysis of Calibration Values for 2 Scanners, With and Without Outliers Due to Known Operator Error
Activity-correction factors for manufacturer-recommended 18F-based calibration scans vary by approximately 6% for scanner 1 and approximately 11% for scanner 2, when outlying points due to known operator error are included in the data. By removing the known erroneous points, shown in Figure 2, the variability is reduced to approximately 4% for both scanners. When the protocol is performed with a 68Ge/68Ga phantom, eliminating the phantom loading steps required with the 18F water phantom, the variability is reduced to approximately 2%–3% in all cases.
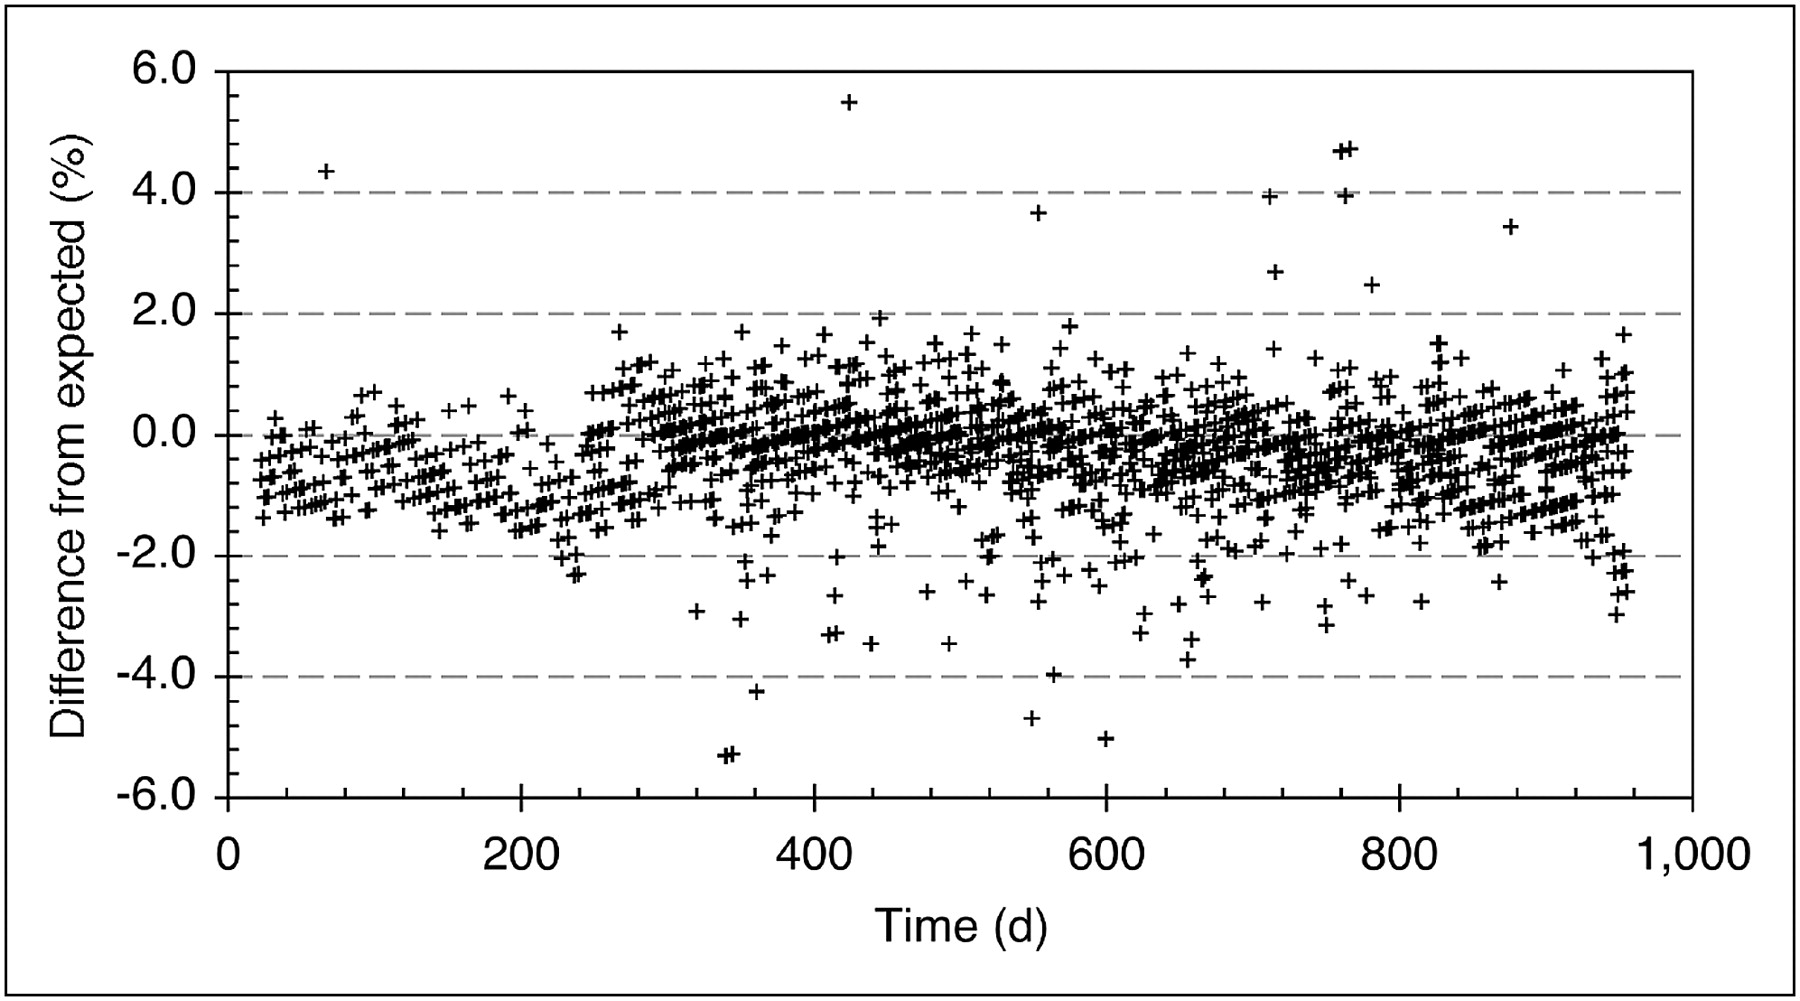
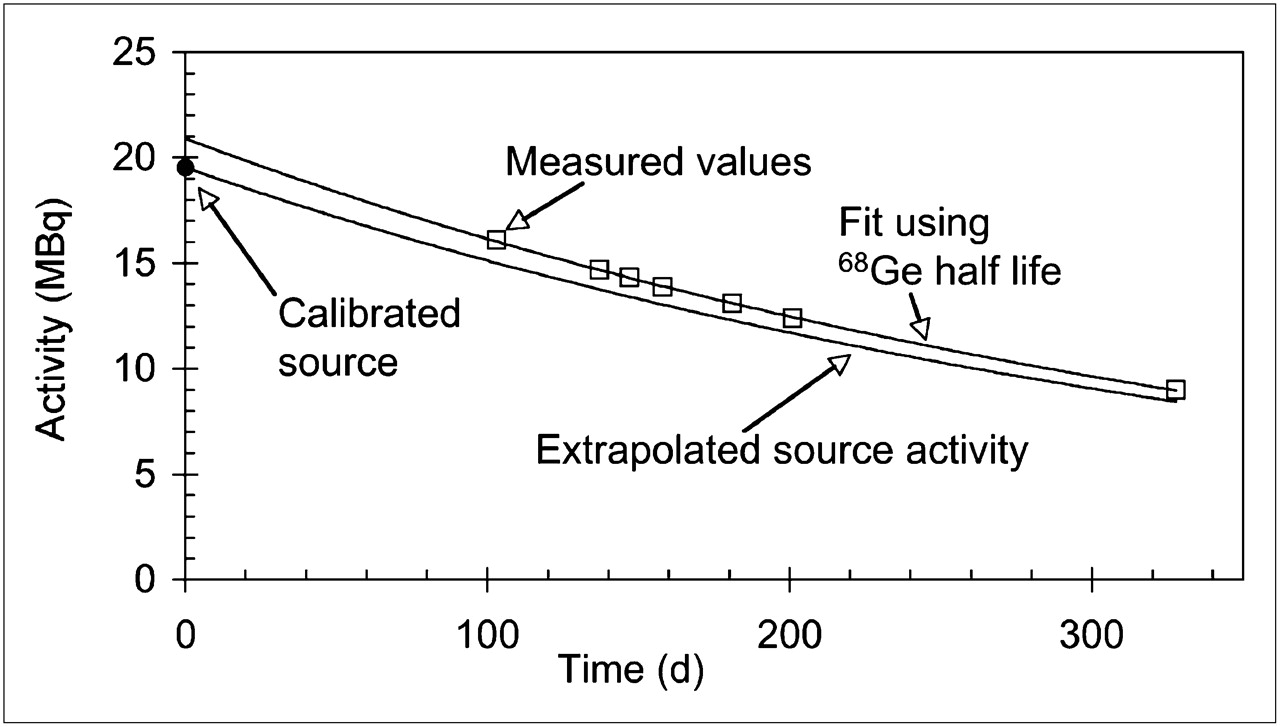
Activity concentration measured using a 68Ge/68Ga phantom with a protocol similar to a standard patient scan were compared with the expected activity concentration based on calculated exponential decay. In all cases, activity concentrations for both 2D and 3D scans were consistently greater than the expected value based on the manufacturer-quoted nominal value of the 68Ge/68Ga phantom. Visually, the scanner measurements appear to trend generally with the expected decay of 68Ge as shown in Figure 4.

Results of activity check for scanner 1 compared with expected decay based on nominal value quoted by manufacturer. Mfrs = manufacturers.
Another potential source of calibration error is from variability in the dose calibrator. Figure 5 shows serial measurements of the NIST-traceable 68Ge/68Ga aliquot in the syringe holder of the dose calibrator.

Dose calibrator measurements of NIST-traceable 68Ge/68Ga aliquot used for 18F dose calibration. Curve through measured data points is exponential fit. Expected curve is based on manufacturer's recommended settings for 18F sources for dose calibrator used.
The expected value was calculated using the standard exponential decay of 68Ge from a known nominal value provided by the manufacturer. Activity present in the 68Ge/68Ga aliquot was measured in the dose calibrator and compared with calculated values on the same date. The measured values have a positive bias but appear to follow a consistent trend over time and do not change significantly over the life of the aliquot source, consistent with a fixed bias.
Dose calibrator variability was evaluated using daily constancy measurements with a NIST-traceable 137Cs calibration source ( Fig. 6). The measurements recorded over the past 3 y have an SD of 0.90%.
Daily constancy values measured using NIST-traceable 137Cs calibration source with dose calibrator used for clinical PET dose assay. Sample SD is less than 0.90% over 3-y period.
DISCUSSION
The SUV is a measure of relative radiotracer uptake in tissue. In PET, SUV is increasingly used to monitor the effects of treatment or to evaluate serial patient studies in single-center and multicenter trials. Several studies have shown that the best-case short-term test–retest SUV variability was approximately 10% in patients ( 21– 26). Geworski et al. evaluated the accuracy of a group of PET scanners at a single time point ( 27). To our knowledge, however, there have been no studies evaluating long-term variability of the PET SUVs due to instrumentation effects and operator error.
Our results show that there is an approximately 3% additional long-term variability that is intrinsic to the PET scanners (based on the 68Ge/68Ga phantom data). The long-term variability increases to approximately 4% when 18F-filled phantoms are used. Calibration factors were calculated for both 2D and 3D acquisition modes on the same day, using the same calibration phantom, and the associated variability in these factors was consistent (within 95% confidence intervals).
A first-order evaluation of error propagation in
Equation 1 yields the uncertainties, adding in quadrature (
28)
At present, the manufacturer's recommended calibration procedures typically require periodic calibration. In our study, the detected errors were distributed over the steps of the scanner calibration process with no consistent pattern. These steps include phantom preparation, data measurement, data recording, and data entry. There are no data we are aware of on the frequency and magnitude of these types of errors in general practice, but anecdotal evidence indicates that such errors do occur at many PET centers.
The calibration procedure to generate the activity-correction factors involves human interaction, suggesting a greater potential for error and leading to variability in scanner performance. The overall variability in activity-correction factors for both scanners is reduced when the 68Ge/68Ga phantom is used instead of an operator-prepared 18F water phantom, suggesting that either operator error or error in dose calibration may account for 1%–3% of the overall variability, after known errors are removed. However, we do not recommend the use of a 68Ge/68Ga phantom instead of a standard 18F water phantom, because this would not compensate for changes in the dose calibrator measurements. A fixed 68Ge/68Ga phantom is useful, however, as a calibration source that is independent of the scanner-calibration procedure. In other words, a postcalibration activity check should not be performed with the same source used to generate the calibrations.
The SD of dose calibrator measurements in our study is less than 1%. There is an overall bias in the measured activity, and a similar bias has been seen in all dose calibrators tested ( 17). As noted, however, a constant bias will not affect SUV measurements if the same dose calibrator is used for scanner calibration and patient scans. However, recent studies by Zimmerman et al. ( 17) and Doot et al. ( 29) have indicated that dose calibrator bias is not always constant. In addition, if different dose calibrators are used, or if a 68Ge/68Ga phantom is used for scanner calibration, then consistent reference sources should be used with the dose calibrators ( 17).
Recommendations
On the basis of this work, we recommend adding the following 2 QA/QC procedures to routine clinical calibration:
-
Verifying that the scanner's global calibration factor does not change by more than a small amount (e.g., 5%).
-
Testing the scanner performance by repeating a scan of a known source (e.g., test phantom) after the scanner calibration process, and verifying that the measured value also does not change by more than a small amount (e.g., 5%).
However, it is possible that the scanner's true efficiency might change by more than, for example, 5%. In this case, the scanner calibration factor should shift by the same relative amount. This should be verified by repeated testing.
In principle, either procedure 1 or procedure 2 would be sufficient. Both are recommended, however, because procedure 1 determines the global calibration factor directly, whereas procedure 2 is a more direct measure of the impact on clinical images. A summary of the enhanced calibration process flow of measurements with QA/QC checks is listed in Table 2.
Typical Calibration Procedure and Recommended Additions
The results presented here are for 2 PET/CT scanners of the same type. Each manufacturer (or even different scanners from the same manufacturer) will have variations of the calibration procedures used in this study. However, the main results (long-term variability > 3% and the value of QA/QC procedures applied to calibration) apply equally to all PET scanners.
CONCLUSION
SUV variability and bias may be introduced by global scale factors due to inherent system variability, human procedural error, and inconsistencies in the dose calibrator used to assay calibration radioactivity doses. We presented a procedure whereby the operator-filled 18F phantom is augmented by a similar cylinder containing a long-lived isotope of 68Ge/68Ga. This addition checks for operator errors from the dose assay and phantom-filling steps and was shown to reduce variations in global scale factors. This process, however, does not include cross-calibration with a dose calibrator.
The protocol presented here is designed to identify errors before they can be perpetuated through patient scans. Our data suggest that even by following the protocol as consistently as possible, and correcting any errors before they are incorporated into clinical scans, there is a 3%–4% variability introduced by activity-correction factors over time, reflecting the typical long-term variability of the scanner if QA/QC procedures are applied to scanner calibration. If QA/QC procedures are not applied, which is common practice, then SUV variability can be much larger.
Acknowledgments
We thank Drs. Jay Williams and Steve Ross (GE Healthcare) for their help with data analysis, Dr. Osama Mawlawi (MD Anderson Cancer Center) for help with data extraction from the systems under study, and the nuclear medicine technologists from University of Washington Medical Center and Seattle Cancer Care Alliance for their patience and support. This study was supported by NCI (SAIC) contract 24XS036-004; NIH grants R01-CA74158, R01-CA115870, and U01-CA148131; and a research contract from GE Healthcare.
- © 2011 by Society of Nuclear Medicine
REFERENCES
- Received for publication October 3, 2010.
- Accepted for publication October 26, 2010.


Jump to section
Related Articles
Cited By...
- Hot Spot Imaging in Cardiovascular Diseases: An Information Statement from SNMMI, ASNC, and EANM
- Quantifying Operator Subjectivity within Flow Cytometry Data Analysis as a Source of Measurement Uncertainty and the Impact of Experience on Results
- Prospective Study of Serial 18F-FDG PET and 18F-Fluoride PET to Predict Time to Skeletal-Related Events, Time to Progression, and Survival in Patients with Bone-Dominant Metastatic Breast Cancer
- Measuring Tumor Metabolism by 18F-FDG PET Predicts Outcome in a Multicenter Study: A Step Off in the Right Direction
- The Precision and Sensitivity of 18F-Fluoride PET for Measuring Regional Bone Metabolism: A Comparison of Quantification Methods