


Abstract
Imaging of the glial activation that occurs in response to central nervous system trauma and inflammation could become a powerful technique for the assessment of several neuropathologies. The selective uptake and metabolism of 2-18F-fluoroacetate (18F-FAC) in glia may represent an attractive strategy for imaging glial metabolism. Methods: We have evaluated the use of 18F-FAC as a specific PET tracer of glial cell metabolism in rodent models of glioblastoma, stroke, and ischemia–hypoxia. Results: Enhanced uptake of 18F-FAC was observed (6.98 ± 0.43 percentage injected dose per gram [%ID/g]; tumor-to-normal ratio, 1.40) in orthotopic U87 xenografts, compared with healthy brain tissue. The lesion extent determined by 18F-FAC PET correlated with that determined by MRI (R2 = 0.934, P = 0.007). After transient middle cerebral artery occlusion in the rat brain, elevated uptake of 18F-FAC (1.00 ± 0.03 %ID/g; lesion-to-normal ratio, 1.90) depicted the ischemic territory and correlated with infarct volumes as determined by 2,3,5-triphenyltetrazolium chloride staining (R2 = 0.692, P = 0.010) and with the presence of activated astrocytes detected by anti–glial fibrillary acidic protein. Ischemia–hypoxia, induced by permanent ligation of the common carotid artery with transient hypoxia, resulted in persistent elevation of 18F-FAC uptake within 30 min of the induction of hypoxia. Conclusion: Our data support the further evaluation of 18F-FAC PET for the assessment of glial cell metabolism associated with neuroinflammation.
Glial cells are the main effector cells of innate immune responses to neuronal damage in the central nervous system (CNS). Microglia and astrocytes are strongly activated in response to neuronal damage, producing an array of inflammatory mediators and performing phagocytic functions (1). Therefore, selective imaging of glial cell activity may be a valuable method to determine the extent and progress of disease and to assess a therapeutic intervention (2). Several approaches to estimate glial cell activity in vivo have been explored in the last 15 years.
In the CNS, the peripheral benzodiazepine receptor (PBR) is localized preferentially in microglia and is strongly activated on neuronal damage (2–4). The selective ligand for PBR (11C-PK11195), recently reviewed in the studies of Banati (2) and Venneti et al. (5), was evaluated for PET of glial activity in several cerebral disorders including Alzheimer disease, refractory epilepsy, multiple sclerosis, stroke-induced brain injury, and glioma. Several 18F-radiolabeled PBR ligands were evaluated for imaging PBR in human patients and animal models of neuronal disorders and reviewed in the study of Chauveau et al. (6).
Because the medium-sized monocarboxylic acids easily cross the blood–brain barrier, 1-11C-octanoate and 1-14C-octanoate were evaluated to selectively image the glial function in a cerebral ischemia model. In this model, the uptake of radiolabeled octanoate decreased in the areas irreversibly affected by ischemia (7,8).
Previous reports showed that radiolabeled acetate, 3H-acetate, and its fluoro analog, 3H-fluoroacetate, accumulated selectively in glial compartments and were proposed as potential tracers of glial oxidative metabolism (9). 2-14C-acetate was used to label glial and meningeal tumors in a rat model. The uptake of 2-14C-acetate increased in the lesions and provided better contrast than did 14C-deoxyglucose (10). Recently, 1-11C-acetate was successfully used for PET detection and characterization of gliomas (11,12). 2-Fluoroacetate, a metabolic poison also known as compound 1080, has attracted considerable attention as a specific inhibitor of glial cell metabolism, and it has been extensively used in brain metabolism studies (13–15). 2-Fluoroacetate is selectively transported to the glial metabolic compartment (9) and converted to fluroacetyl-CoA and then to 2-fluorocitrate in the Krebs cycle (16). 2-Fluorocitrate acts as an inhibitor of aconitase (17). More specifically, the (−)-erythro diastereomer of 2-fluorocitrate is first converted to fluoro-cis-aconitate, followed by the addition of hydroxide and defluorination to form 4-hydroxy-trans-aconitate, which binds tightly to aconitase. The (+)-erythro diastereomer undergoes defluorination and conversion to nontoxic oxalosuccinate and α-ketoglutarate (18,19). In the normal rat brain, both acetate and 2-fluoroacetate cross the blood–brain barrier at the same rate; however, the subsequent metabolism of acetate has been found to be considerably faster than that of 2-fluoroacetate (14).
Although radiolabeled 2-fluoroacetate was proposed as a metabolic tracer for the CNS more than 20 years ago (9), and its toxicity is not an issue when a minute amount of no-carrier-added (n.c.a.) radiotracer is used, to the best of our knowledge no successful in vivo imaging data with 2-18F-fluoroacetate (18F-FAC) in the CNS has been reported. Several synthetic procedures for 18F-FAC were fully automated (20,21), making 18F-FAC easily available at many clinical sites; however, 18F-FAC has been evaluated only as an alternative to 1-11C-acetate for the imaging of prostate carcinomas in a mouse model (22) and in human patients (23). On the basis of the recent PET data obtained with radiolabeled 1-11C-acetate in glial tumors and the well-accepted mechanism of 2-fluoroacetate metabolism (13,15,18,19,24), we decided to test the original hypothesis (9) that 18F-FAC can be used as a specific PET tracer for glial metabolism. The increased glial metabolism may result in increased 18F-FAC consumption and lead to the accumulation of its radioactive metabolites in glial cells in proportion to their oxidative metabolism. In this report, we have evaluated the potential use of 18F-FAC as a specific PET tracer of glial metabolism in rodent models of neurologic insults including ischemia–hypoxia, focal ischemia, and glioblastoma. Comparisons to conventional readouts of neurologic damage, including markers of neurodegeneration (2,3,5-triphenyltetrazolium chloride [TTC]), astroglial activation (anti–glial fibrillary acidic protein [GFAP]) MRI, and other PET metabolic tracers such as 18F-FDG and O-18F-fluoroethyl l-tyrosine (18F-FET), are presented.
MATERIALS AND METHODS
General
Solvents and chemicals were purchased from Aldrich. Reversed-phase high-performance liquid chromatography (HPLC) systems were used to analyze and purify the products (system A: Zorbax Eclipse XDB-C18 [Agilent Technologies] [150 × 4.6 mm, 5 μm], 10% ethanol, 0–12 min, 1 mL/min; system B: Zorbax Eclipse XDB-C18 [150 × 4.6 mm, 5 μm], 0.05% trifluoroacetic acid + 10%−90% acetonitrile, 0–15 min, 90% acetonitrile, 15–20 min, 1 mL/min). 18F-fluoride and 18F-FDG were purchased from PETNET Solutions, Oasis HLB Plus cartridges were obtained from Waters, and 18F Trap & Release columns were purchased from ORTG, Inc.
Animal care and treatment followed protocols approved by Genentech's Institutioned Animal Care and Use Committee, which is accredited by the Association for Assessment and Accreditation of Laboratory Animal Care.
Synthesis of 18F-FAC
18F-FAC was synthesized with the following modification of published procedures (21,22). 18F-fluoride was eluted from Trap & Release cartridges using 1 mL of a solution of 4,7,13,16,21,24-hexaoxa-1, 10-diazabicyclo[8.8.8]-hexacosane (5 mg) and potassium carbonate (2 mg) in 80% acetonitrile. Water was azeotropically removed by heating to 100°C under a stream of argon with subsequent addition of anhydrous acetonitrile (4 × 1 mL). Ethyl O-mesylglycolate (5 mg) in acetonitrile (0.5 mL) was added, and the mixture was heated to 100°C in a closed vial for 10 min. The reaction mixture was allowed to cool to room temperature, withdrawn into a syringe preloaded with water (10 mL), and passed through 2 Oasis HLB cartridges connected in series and preconditioned with ethanol (10 mL), water (10 mL), and air. The trapped ethyl 18F-fluoroacetate was washed with water (2 × 10 mL), gently dried with argon, hydrolyzed on-cartridge with 0.5N sodium hydroxide (0.5 mL) for 10 min, and eluted with 100 mM sodium phosphate (500 μL). The product was neutralized with 0.5N hydrochloric acid (0.5 mL) and diluted with water for injection. The product was analyzed on HPLC system A (retention time, 2.1 min). The total preparation time was 72 min, with a decay-corrected yield of 56% ± 12% (n = 3).
Synthesis of 18F-FET
18F-FET was synthesized according to a previously published procedure (25), with only minor modifications. The product was analyzed on HPLC system B (retention time, 10.9 min). The 18F-FET was obtained with a decay-corrected yield of 24% ± 3%, within 116 min (n = 3).
Glioblastoma Model
Male athymic CD-1 nude mice (age, 6–8 wk) (Charles River Laboratories) were anesthetized with 2% isoflurane in 1 L/min of air and placed into a stereotactic apparatus. A midline incision was made, and then the underlying frontal and parietal bones were exposed and scraped clean of periosteal membrane. The U87 cells (2.5 × 10⁵ in 5 μL) were injected stereotactically into the right striatal area using a 10-μL Hamilton microsyringe equipped with a 28-gauge stainless steel cannula. The cannula was left in place for 3–5 min, then slowly retracted. The wound was cleaned with povidone-alcohol and the incision closed with tissue glue and sutures. Animals were allowed to recover on a heated blanket until ambulatory, and then they were returned to the cage.
Focal Ischemia Model
The focal ischemic stroke model, based on transient middle cerebral artery occlusion (MCAO), was described previously (26,27). Briefly, male Wistar rats (weight, 260–300 g) (Harlan Sprague–Dawley) were anesthetized using 2%−2.5% isoflurane in 1 L/min of air and maintained at 37°C with a heated blanket. Under the operating microscope, the right common carotid artery was exposed, isolated, and ligated distally through a midline incision. After the external carotid artery was ligated at the bifurcation, a 4-0 silicone-coated occluding filament was inserted in the lumen of the external carotid artery and advanced into the internal carotid artery, 16–18 mm beyond the carotid bifurcation until mild resistance indicated that the tip was lodged in the anterior cerebral artery, thus blocking blood flow to the middle cerebral artery. The incision was closed with tissue glue and sutures. Animals were allowed to recover on a heated blanket until ambulatory, and then they were returned to the cage. The occluding filament was removed 90 min after MCAO to restore the blood flow. PET was performed at 24 h after surgery, if not stated otherwise.
Ischemia–Hypoxia Model
Cerebral ischemia–hypoxia was induced by permanent occlusion of the common carotid artery, followed by transient hypoxia as described previously (28). Briefly, male homozygous wild-type mice C56/BL6 (age, 8–12 wk) (Charles River Laboratories Inc.) were anesthetized using 1%−2% isoflurane in 1 L/min of air and maintained at 37°C with a heated blanket. A midline neck incision was made to isolate the right carotid artery from surrounding fascia. Then 2 lengths of 6-0 silk suture were passed under the carotid artery and tied in parallel square knots, creating a permanent ligation. The midline neck incision was closed with 6-0 silk. Animals were allowed to recover on a heated blanket until ambulatory and then returned to the cage. Animals were challenged with a hypoxic environment (7.5% oxygen, 92.5% nitrogen, with 0.8% isoflurane) for 35 min, 0–3 h after surgery, and maintained at 37°C in an induction box on a heated blanket. PET was performed at 24 h after surgery, if not stated otherwise.
PET
The PET images were acquired on microPET Focus 120 scanners (Siemens Preclinical Solutions). Animals were anesthetized with 3% sevoflurane in air, and the eyes were covered in ophthalmic ointment. The animals were placed head first, in the prone position, on the scanner bed. Body temperature was measured by a rectal probe and maintained with a warm air flow supplemented by a heating lamp. The animals were injected intravenously via a tail vein catheter with approximately 3.70–9.25 MBq (mouse) or 37–55 MBq (rat), respectively, of 18F-radiolabeled probe in isotonic solution as PET scans were initiated. For 18F-FAC and 18F-FDG, dynamic 30-min scans were acquired. For 18F-FET, static 30-min scans were acquired after a 60-min period of conscious uptake. Full-body iterative image reconstructions were obtained using a maximum a posteriori algorithm (MAP) (hyperparameter β, 0.05), and projections were created with ASIPro software (Siemens Preclinical Solutions). Maximum a posteriori–reconstructed images (voxel size, 0.4 × 0.4 × 0.8 mm) were used to obtain quantitative activity levels in each organ of interest. These measurements were obtained with region-of-interest analysis using ASIPro software or Analyze 8.1 (Biomedical Imaging Resources). The tissue uptake for dynamic scans was calculated as average uptake over the last 20 min of the scan.
MRI
Animals were anesthetized and maintained on 1.5%−2% isoflurane in air. Body temperature was closely monitored and maintained near 37°C using a rectal temperature probe and warm air, respectively, while also monitoring respiration. After a pilot scan to confirm positioning, a fast spin-echo sequence (field of view, 20 mm2; slice thickness, 0.8 mm; matrix, 1282 zero-filled to 2562; repetition time, 4 s; effective echo time, 36 ms; echo train length, 8; echo spacing, 9 ms; number of excitations, 8) was used to acquire coronal datasets at 9.4 T (Direct Drive console; Varian Inc.), using a 4-cm-inner-diameter radio frequency transmit or receive volume coil (Millipede; Varian Inc.). Images were analyzed using Analyze 8.1 (Biomedical Imaging Resources).
Histology and Immunohistochemistry
TTC staining was performed on 2-mm-thick sections, and digital micrographs were obtained using a CanoScanLIDE50 desktop scanner (Canon Inc.). The hematoxylin and eosin (H&E) and immunohistochemical stainings were performed on 5-μm-thick paraffin sections. Primary anti-GFAP rabbit polyclonal antibody was purchased from DAKO. The H&E digital micrographs were obtained with an Ariol SL50 Slide Scanning System (Applied Imaging) at 2.5× magnification, and the immunohistochemical images were obtained on a Leica DMRB with a Nikon DXM1200F digital camera at 2.5× and 20× magnifications. The affected tissues in the ipsilateral hemisphere were directly compared with the unaffected tissues in the contralateral hemisphere.
Statistical Analysis
The graphs were constructed with R software, version 2.4.1. (R Foundation for Statistical Computing). Statistical significance was determined using the Student t test, and P values of less than 0.05 were considered significant. Data are presented as mean ± SEM.
RESULTS
Glioblastoma Model
Neither 18F-FET nor 18F-FAC was able to detect U87 xenografts at 9 or 10 d after implantation. The data obtained at day 20 (18F-FET PET), day 21 (18F-FAC PET), and day 22 (18F-FDG PET and MRI) after surgery are summarized in Supplemental Table 1 (supplemental materials are available online only at http://jnm.snmjournals.org). For all tested tracers, the uptake in the tumor was higher than the uptake in healthy brain tissue. Because of the high brain uptake of 18F-FDG, the tumor detection thresholds were set to mean background uptake plus 3 times SD of background uptake for 18F-FAC and 18F-FET and to mean background uptake plus 2 times SD of background uptake for 18F-FDG. Although 18F-FET provided the best tumor-to-background ratio (1.86) with tumor uptake (2.61 percentage injected dose per gram [%ID/g]), only 20% (1/5) of tumors were detected; the tumor size did not correlate with MRI (Supplemental Table 1). 18F-FAC detected correctly 100% (5/5) of tumors (uptake, 6.98 ± 0.43 %ID/g; tumor-to-background ratio, 1.40). The tumor size correlated well with MRI measurements (R2 = 0.934, P = 0.007, Fig. 1C). 18F-FDG correctly detected 100% (5/5) of lesions (uptake, 7.62 ± 0.77 %ID/g; tumor-to-background ratio, 1.22), and the lesion size only weakly correlated with MRI measurements (R2 = 0.416, P = 0.240, Fig. 1D). The orthotopic U87 xenografts were clearly delineated on H&E–stained tissues (Fig. 1H), and the tumor area correlated well with that determined by MRI (R2 = 0.990, P = 0.0004) (Supplemental Table 2).

Orthotopic glioblastoma xenograft in mice. Time–activity curves for 18F-FAC (A) and 18F-FDG (B). Correlation of tumor volumes determined by MRI with 18F-FAC (R2 = 0.934, P = 0.007) (C) and 18F-FDG (R2 = 0.416, P = 0.240) (D). Representative coronal section of whole head (animal 5), with brain tumor detected in vivo by 18F-FAC (E), 18F-FDG (F), MRI (G), and corresponding brain section stained with H&E (H).
The time–activity curves for 18F-FAC and 18F-FDG in tumor and healthy brain tissue for 30 min after intravenous injection are shown in Figures 1A and 1B. The uptake of 18F-FAC stabilized within 5 min after injection and remained unchanged for the duration of the scan. The uptake of 18F-FDG reached a plateau at 20 min after injection.
Focal Ischemia Model
The ischemic cerebral stroke model was based on the transient MCAO (26,27,29,30) and was used to assess the feasibility of imaging the glial activation using 18F-FAC or 18F-FDG after a focal ischemic insult. The animals were imaged with 18F-FAC or 18F-FDG 24 h after the MCAO surgery, and the immunohistochemical analysis for activated astrocytes using anti-GFAP antibody was performed at the same time point with a different set of animals. In the immunohistochemistry assay, the acutely infarcted tissue in the cortex and striatum were diffusely stained where neuronal and glial cell integrity had been lost. Around these areas, intact astrocytes were visible and were focally more intensely stained around the infarcted tissue than on the control side (Supplemental Fig. 1). Normal uptake of PET tracers was defined as the mean contralateral uptake. For 18F-FAC, the infarct volume was determined as the sum of voxels with uptake level higher than 3 SDs above the normal uptake. For 18F-FDG, the infarct volume was determined as the sum of voxels with uptake level lower than 2 SDs below the normal uptake. The 18F-FAC uptake was strongly elevated in the ischemic region (1.00 ± 0.03 %ID/g, n = 8), compared with the contralateral hemisphere (0.53 ± 0.01 %ID/g; lesion-to-normal ratio, 1.90). In contrast, the 18F-FDG uptake in the ischemic region was lower (0.66 ± 0.03 %ID/g, n = 7) than the uptake in the contralateral hemisphere (1.03 ± 0.04 %ID/g; lesion-to-normal ratio, 0.64). The infarct volume as determined by PET was compared with the infarct volume determined by TTC staining performed at 48 h after infarct. The volume determined by 18F-FAC correlated well with the volume determined by TTC (R2 = 0.692, P = 0.010; Fig. 2C). In contrast, the volume determined by 18F-FDG did not correlate with the volume determined by TTC stain (R2 = 0.295, P = 0.208; Fig. 2D).
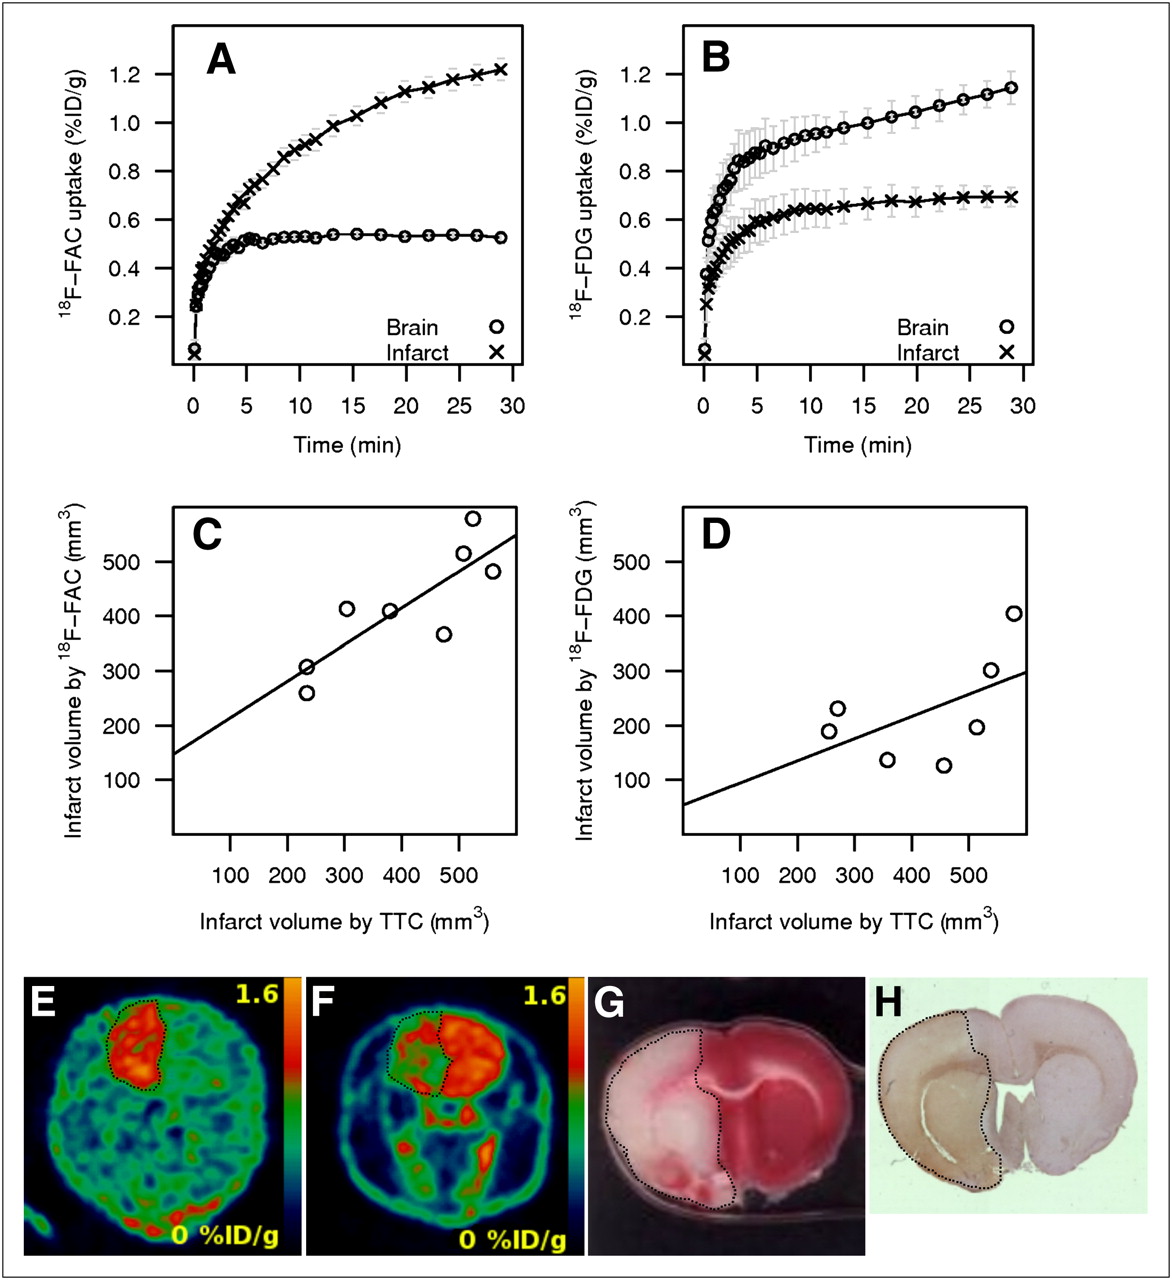
Cerebral focal ischemia model in rat. Time–activity curves for 18F-FAC (A) and 18F-FDG (B). Correlation of infarct volume determined by TTC with volumes determined by 18F-FAC (R2 = 0.692, P = 0.010) (C) and by 18F-FDG (R2 = 0.295, P = 0.208) (D). Representative coronal section of whole rat head with ischemic brain injury (dotted line) detected in vivo by 18F-FAC (animal 79) (E), 18F-FDG (animal 66) (F), and corresponding brain section from animal 79 stained by TTC (G) and anti-GFAP (H).
Time–activity curves for uptake of 18F-FAC and 18F-FDG in the focal ischemia model shown in Figures 2A and 2B are substantially different. The 18F-FAC uptake in the damaged tissues did not plateau but kept increasing, whereas the uptake of 18F-FAC in the healthy hemisphere stabilized in 10 min after an intravenous injection of the tracer. The 18F-FDG uptake in the stroke-damaged hemisphere reached a plateau in 10 min, but the uptake of 18F-FDG in the healthy hemisphere did not plateau during the 30-min period of the scan.
The ischemic injury was visualized using TTC postmortem (48 h after surgery and 24 h after PET). Necrotic areas were detected in the cortex and striatum of the injured hemisphere (Fig. 2G), and the infarct volume was calculated. The necrotic area detected by TTC also showed visible GFAP reactivity (Fig. 2H).
In a subsequent experiment, 3 animals with MCAO-induced ischemic injury were injected with 18F-FDG, and the dynamic scan data were acquired over 30 min; then 18F-FAC was administered without disturbing the animal, and another 30-min dynamic scan was acquired. The time–activity curves obtained in the dual-tracer experiment are depicted in Figure 3A. The hemisphere affected by focal ischemia initially showed low 18F-FDG uptake in the first 30 min, but then the injured areas showed high 18F-FAC uptake, resulting in an average infarct–to–normal ratio of 1.5 at the end of image acquisition. The 18F-FDG image (Fig. 3B) was obtained as a sum of the last 20 min of the first 30-min scan. Then the 18F-FAC image (Fig. 3C) was obtained after the subtraction of the 18F-FDG signal from the cumulative image obtained from the last 20 min of the second 30-min scan.

Time–activity profiles (A) obtained during dual-tracer PET experiment using rat focal ischemia model (n = 3). 18F-FDG was injected at 0 min, followed by 18F-FAC at 30 min. Representative coronal sections of rat brains with MCAO-induced injury: 18F-FDG image obtained in first 30 min (B), and 18F-FAC image (C) obtained after subtraction. For multispectral analysis (D), areas are color-coded as follows: green (18F-FDG low, 18F-FAC low), red (18F-FDG high, 18F-FAC low), yellow (18F-FDG low, 18F-FAC high), and blue (18F-FAC high, 18F-FDG high).
Ischemia–Hypoxia Model
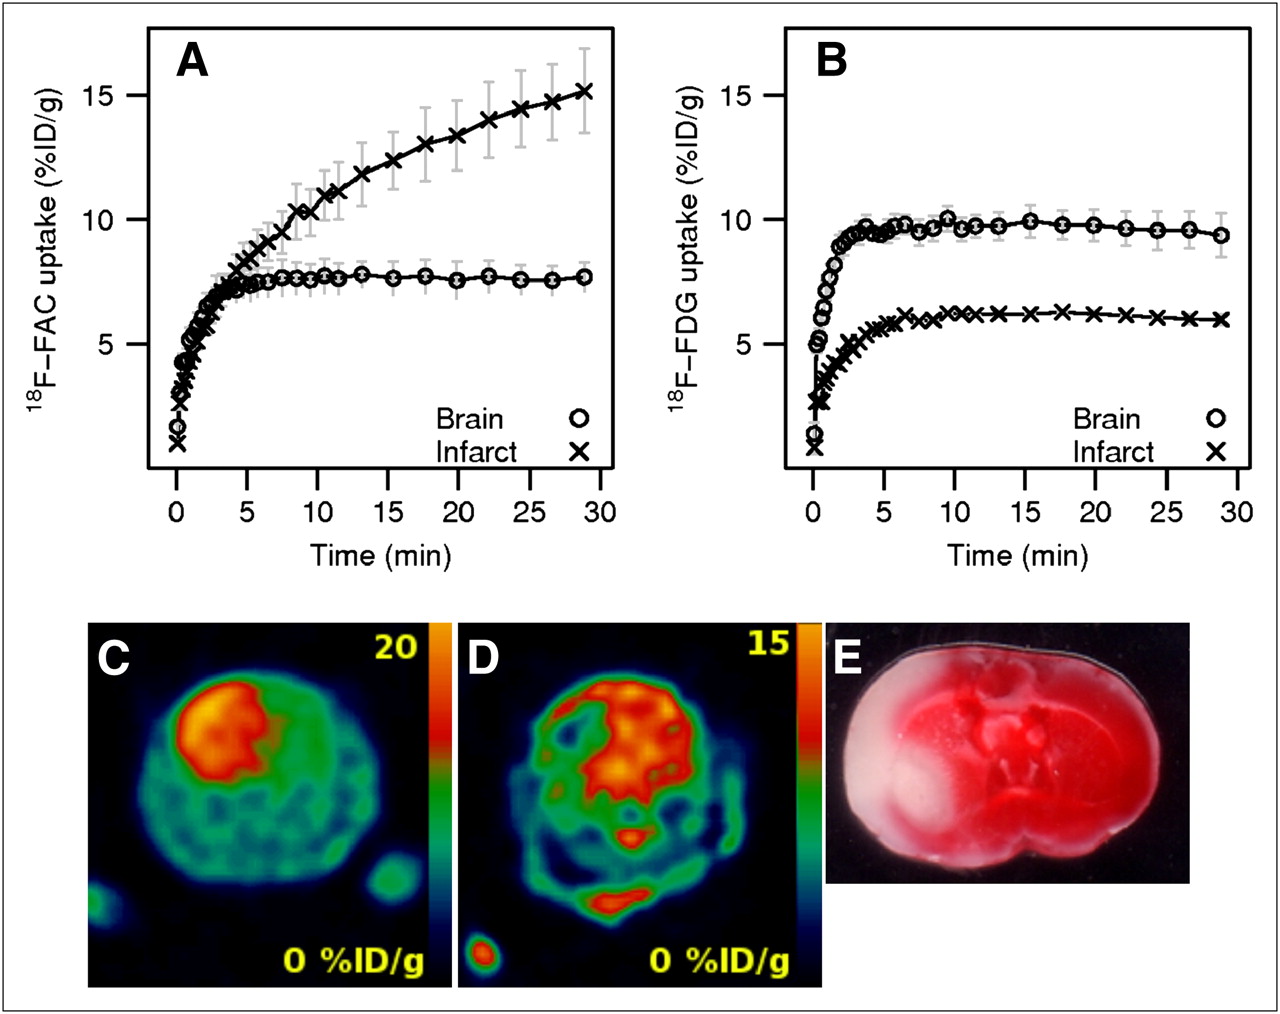
Permanent ligation of the common carotid artery, followed by a period of time in a hypoxic environment, was used to induce cerebral injury in 5 mice (28). At 24 h after surgery, 3 animals were imaged using 18F-FAC, and the remaining 2 animals were imaged with 18F-FDG. The infarct volume was determined using the same thresholds as used in the focal ischemia model. The 18F-FAC uptake (12.22 ± 1.19 %ID/g, n = 3) in the hemisphere affected by ischemia–hypoxia was higher than the 18F-FAC uptake in the opposite hemisphere (7.64 ± 0.62 %ID/g; ratio, 1.59). Conversely, the uptake of 18F-FDG in the injured hemisphere (5.89 ± 0.02 %ID/g, n = 2) was lower than that in the contralateral hemisphere (9.69 ± 0.08 %ID/g; ratio, 0.61).
The time–activity profiles for 18F-FAC and 18F-FDG in the mouse ischemia–hypoxia model are shown in Figures 4A and 4B. As with the rat focal ischemia model, the uptake profiles for 18F-FAC and 18F-FDG are remarkably different. The uptake of 18F-FAC in the damaged hemisphere increased continually for the period of the scan (Fig. 4A) and kept increasing even 2 h after injection (data not shown). The 18F-FAC uptake in the contralateral hemisphere reached a plateau in 7 min. The 18F-FDG uptake in both hemispheres stabilized in 7 min after injection and did not change during the 30-min scan (Fig. 4B).

Cerebral ischemia–hypoxia mouse model. Time–activity curves for 18F-FAC (A) and 18F-FDG (B). Representative coronal section of whole mouse head with ischemia–hypoxia–induced brain injury detected in vivo by 18F-FAC (animal F2) (C), 18F-FDG (animal P2) (D), and corresponding brain section stained with TTC (animal F2) (E).
DISCUSSION
Glioblastoma Model
Imaging of increased glucose metabolism in proliferating malignant tumors by 18F-FDG PET is a widely used diagnostic technique in oncology; however, the high baseline uptake of 18F-FDG in brain tissues warrants the use of other PET tracers for the detection of cerebral tumors. Numerous radiolabeled amino acids have been evaluated for the detection of brain malignancies; for example, the radiolabeled tyrosine analog 18F-FET has been successfully evaluated as an alternative to 11C-methionine (31). Because acetate is selectively metabolized in glia, the radiolabeled 1-11C-acetate has been recently used to detect increased energy metabolism in glial malignancies (11,12). In addition, because the metabolites of 18F-FAC may accumulate in the tumor in proportion to the elevated metabolic activity, in this paper we report the use of 18F-FAC as an alternative to 1-11C-acetate to image elevated metabolic activity in glial tumors.
The uptake of 18F-FAC in the glioblastoma model showed a strong resemblance to time–activity profiles found with 1-11C-acetate in human brain astrocytoma (11). However, the tumor-to-background ratio of 18F-FAC uptake (1.40) was lower than the tumor-to-background ratios found in brain gliomas using 1-11C-acetate (11,12). Lower tumor-to-background ratio might explain the overall lower metabolic rate of 2-fluoroacetate than acetate (14). Although 18F-FDG uptake in astrocytomas can be higher or lower than that in the contralateral gray matter (11), we observed higher 18F-FDG uptake in all orthotopic xenografts, with a tumor-to-background ratio of 1.22. 18F-FET provided the best tumor-to-background ratio of 1.84; however, only the largest tumor was detected. The low metabolic rates of 18F-FAC and 18F-FET in normal brain tissues provided lower background than did 18F-FDG.
Volumetric analysis using 18F-FDG PET has been proposed as a potential method for obtaining prognostic information and defining the target area for radiation therapy; however, the decisions based on 18F-FDG PET volumetric analysis demonstrated no improvement in overall survival or progression-free survival (32,33). Our data obtained with 18F-FAC correlated more closely to the volumes obtained using MRI analysis; therefore, 18F-FAC, like 1-11C-acetate, may provide better volumetric and predictive information than 18F-FDG.
Focal Ischemia and Ischemia–Hypoxia Models
Because 2-fluoroacetate is a selective inhibitor of glial metabolism, we decided to evaluate the use of its radiolabeled analog 18F-FAC as an imaging agent for increased metabolism associated with glial activation. Glial activation and gliosis are natural responses in the brain tissues injured by ischemic stroke (34). Models of acute cerebral ischemia are widely used to induce and study glial activation (35–37). The reduction in the blood flow to the ischemic focus results in a marked reduction in energy metabolism; however, the penumbral region of the infarct experiences less severe ischemia and this is the place in which glial activation will be most abundant. The use of 18F-FAC for monitoring glial metabolism might provide an alternative approach, independent of and complementary to the imaging based on PBR targeting.
In both models, 18F-FAC uptake was higher, whereas 18F-FDG uptake was lower in injured tissues than in the contralateral hemisphere. The lower 18F-FDG uptake presumably reflects depressed glucose metabolic activity due to the ischemia, and the elevated 18F-FAC uptake reflects the increased glial metabolism due to activation as response to the insult. The presence of reactive astrocytes in the ipsilateral hemisphere was confirmed by immunohistochemical analysis (Supplemental Fig. 1). An alternative explanation for the elevated uptake of 18F-FAC in tissues affected by ischemia could be a disruption of the blood–brain barrier, leading to increased distribution volume of the tracer. However, such an explanation contradicts the observed low uptake of 18F-FDG in ischemic tissues. The time–activity curves (Fig. 3A) obtained in the dual-tracer imaging experiment clearly demonstrated that the tissues with low 18F-FDG subsequently showed high 18F-FAC. Such observation cannot be attributed to a nonspecific uptake of the tracers due to the disrupted blood–brain barrier.
We were able to detect the cerebral ischemic region in the ischemia–hypoxia model using 18F-FAC as soon as 30 min after the procedure. Subsequently, we were able to observe the evolution of the lesion at further time points. In one case, the mouse (M2) had an ischemic area detected by 18F-FAC at 30 min, and the neurologic deficit score was 2 (animal persistently walked in large circles toward ipsilateral side) (28,38). However, the injury was not detectable using 18F-FAC at 90 min after the surgery and subsequent TTC stain did not show the brain injury (Fig. 5). Intriguingly, this result suggested the possibility that glial activation and elevated 18F-FAC uptake are reversible. The disappearance of the signal indicated that the radioactive metabolites of 18F-FAC—2-18F-fluorocitrate and 18F-fluoride (18,19)—were trapped in glial cells only temporarily and they were removed from the injured tissues after animal M2 recovered from the acute hypoxia. Our observation could be explained by expected different metabolic rates of 2-fluoroacetate in dormant and activated glia. In the dormant glia, the metabolic rate of 2-fluoroacetate is slow (14), and the efflux rate or further metabolism of 2-fluorocitrate is higher than its production rate. Previously, Clarke detected only low levels of 3H-fluorocitrate as a metabolite of 2-3H-fluoroacetate accumulated in brains of healthy animals (15). However, in the activated glia, the production rate of the radioactive 18F-FAC metabolites 2-18F-fluorocitrate and 18F-fluoride might be higher than their further metabolism or removal, leading to the accumulation of radioactivity in glial cells.
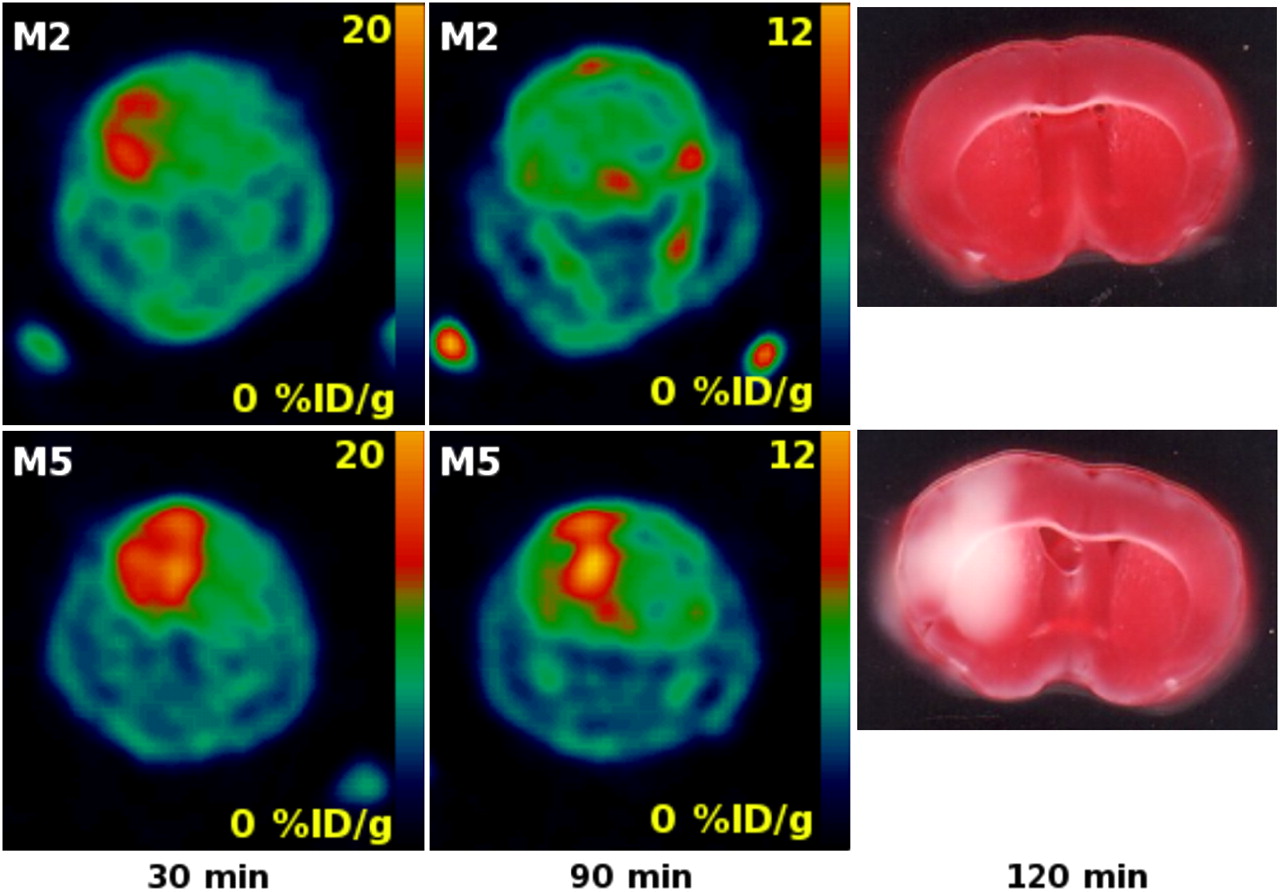
Coronal section of whole mouse head with brain affected by ischemia–hypoxia: 18F-FAC uptake at 30 and 90 min and ex vivo TTC staining at 120 min after common carotid occlusion and hypoxia (animals M2 and M5).
As discussed previously, the final radioactive metabolite of 18F-FAC is 18F-fluoride, produced by defluorination of 2-18F-fluorocitrate. Additionally, it has been shown in rats and mice that 2-fluoroacetate and 2-fluorocitrate undergo enzymatic defluorination by liver enzymes in the presence of glutathione (39). In the previous imaging experiments, the free 18F-fluoride contributed to elevated bone uptake in rodents 2 h after 18F-FAC administration, but little bone uptake associated with defluorination was observed in baboons (22). We observed the elevated bone uptake at 90 min after injection (Fig. 5) but not earlier, which is in good agreement with previous results (22).
The 18F-FAC time–activity curves for the glioblastoma model (Fig. 1A) were different from both those obtained from the focal ischemia model (Fig. 2A) and from the ischemia–hypoxia model (Fig. 4A). The cerebral injury caused by glioblastoma could be considered to be in steady state or slowly evolving; therefore, 18F-FAC uptake in glioblastoma (Fig. 1A) stabilized after the influx of the tracer was equilibrated with removal of metabolites from the cytosol. But in the case of both rapidly evolving acute cerebral ischemic insults, the 18F-FAC uptake did not reach a plateau and kept increasing (Figs. 2A and 4A).
The infarct volume determined by 18F-FAC PET was compared with the volume determined by TTC staining. For the mouse ischemia–hypoxia model, the 2 measures did not correlate well. However, in the rat focal ischemia model 18F-FAC volume correlated closely with that determined by TTC (Fig. 2C). The permanent ligation of the carotid artery in the ischemia–hypoxia model leads to more extensive hypoxia than the transient occlusion of the middle cerebral artery. Therefore, some tissue in the ischemia–hypoxia model might appear viable to the TTC stain, but because the larger portion of brain was hypoxic, glial activations was more extensive. In contrast, the transient MCAO-based induced injury is more focal.
On the basis of the patterns of uptake for 18F-FAC and 18F-FDG, 4 tissue types were identified on the dual-tracer images (Fig. 3D). The first type was the area of low 18F-FAC uptake and high 18F-FDG uptake (Fig. 3D, red) corresponding to unaffected brain tissues found in the contralateral hemisphere. The second and third types were areas with high 18F-FAC uptake and high 18F-FDG uptake (Fig. 3D, blue) and with high 18F-FAC and low 18F-FDG uptake (Fig. 3D, yellow) found in the ipsilateral hemisphere; these areas would correspond to the penumbral region of the infarct. The fourth region was the area of low 18F-FAC uptake and low 18F-FDG uptake (Fig. 3D, green) found in the ipsilateral hemisphere; this region would correspond to the necrotic core of the infarct. We anticipate that such metabolic mapping of brain tissues damaged by ischemic stroke could provide a cerebral metabolism profile potentially useful for assessing the extent and severity of the infarct. A thorough analysis of metabolic maps obtained by 18F-FDG–18F-FAC dual-tracer imaging will be required to confirm this hypothesis and the correlation with histopathologic analysis; however, such work is beyond the scope of this preliminary report.
CONCLUSION
We have evaluated 18F-FAC as a specific PET tracer for glial metabolism and activation in 3 models of neurologic disorder. In the glioblastoma model, the uptake of 18F-FAC was elevated in the lesions and the tumor volume determined by 18F-FAC PET correlated closely with that determined by MRI and histology. In a rat focal ischemia model, the 18F-FAC uptake was strongly elevated in injured tissues, and the volume of ischemic tissue determined by 18F-FAC PET correlated with the size of injury determined by TTC stain. Multispectral classification of the dual-tracer 18F-FDG–18F-FAC PET images provided metabolic maps of the infarct. The strongly elevated 18F-FAC uptake was found in the ischemia–hypoxia mouse model as well, but the lesion size determined by 18F-FAC PET did not correlate with TTC staining. We demonstrated the use of 18F-FAC for the detection of the brain ischemia–hypoxia as early as 30 min after the injury was induced.
We anticipate that 18F-FAC PET may become a useful diagnostic tool, providing additional information to that obtained using other imaging modalities for cerebral pathology.
Acknowledgments
We thank Laszlo Komuves and Jeffrey Eastham-Anderson for assistance with acquiring the Ariol micrographs, Xiaoling Xia for immunohistochemistry support, and Richard Carano for many helpful discussions.
Footnotes
-
COPYRIGHT © 2009 by the Society of Nuclear Medicine, Inc.
References
- Received for publication August 21, 2008.
- Accepted for publication October 21, 2008.


Jump to section
Related Articles
Cited By...
- Increase in [18F]-Fluoroacetate Uptake in Patients With Chronic Hemodynamic Cerebral Ischemia
- Functional pattern of brain FDG-PET in amyotrophic lateral sclerosis
- Metabolism and Quantification of [18F]DPA-714, a New TSPO Positron Emission Tomography Radioligand
- 2-18F-Fluoroacetate: A Useful Tool for Assessing Gliosis in the Central Nervous System?