


Abstract
The aim of the present study was to explore the applicability of an extracerebral reference region for the quantification of cerebral receptors with PET. Methods: Male squirrel monkeys underwent quantitative PET studies of cerebral nicotinic acetylcholine receptors (nAChRs) with 2-18F-fluoro-A-85380 (2-FA). Data from dynamic PET scans were analyzed with various compartment- and non–compartment-based models, including a simplified reference tissue model (SRTM). Nondisplaceable volume-of-distribution (VDnd) values were determined in regions of interest after the blockade of 2-FA–specific binding by nicotine infusion. Binding potential values, estimated with the cerebellum and muscle as reference regions, were compared and the reproducibility of measurements was determined. Results: One- and 2-tissue-compartment modeling and linear graphic analysis provided similar total volume-of-distribution (VDT) values for each studied region. VDT values were high in the thalamus, intermediate in the cortex and midbrain, and low in the cerebellum and muscle, consistent with the distribution pattern of nAChR containing α4 and β2 receptor subunits (α4β2*). The administration of nicotine at 2 mg/kg/d via an osmotic pump resulted in a nearly complete saturation of 2-FA–specific binding and led to very small changes in volumes of distribution in the cerebellum and muscle (−9% ± 4% [mean ± SEM] and 0% ± 6%, respectively), suggesting limited specific binding of the radioligand in these areas. VDT measured in muscle in 15 monkeys was reasonably constant (3.0 ± 0.2, with a coefficient of variation of 8%). VDnd in studied brain regions exceeded VDT in muscles by a factor of 1.3. With this factor and with muscle as a reference region, BP* values calculated for studied brain regions with the SRTM were in good agreement with those obtained with the cerebellum as a reference region. Significant correlations were observed between BP* values estimated with these 2 approaches. The reproducibilities of BP* measurements obtained with the 2 methods were comparable, with coefficients of variation of less than 11% and 13% for the thalamus and the cortex, respectively. Conclusion: These results suggest that the accurate quantification of nAChRs can be performed with 2-FA and a reference region outside the brain, providing a novel approach for the quantification of brain receptors when no suitable cerebral reference region is available.
Current methods for the quantification of cerebral receptors by PET use either a blood input function (invasive approach) or a reference tissue approach (noninvasive approach) (1). However, the use of an arterial input function is not always practical because of the invasiveness of this approach and the limited quantity of blood that can be drawn in small animals. Additionally, the reference tissue approach is also not always feasible because reference tissue either may not be available or may not be useful because of insufficient size, radioactive spillover from adjacent areas, or a pathologic condition changing the brain receptor expression in the reference region. To develop an alternate approach, we evaluated the potential of using an extracerebral reference tissue approach for receptor quantification. For this purpose, we performed a series of PET studies in squirrel monkeys with 2-18F-fluoro-3-(2(S)-azetidinylmethoxy)pyridine (2-18F-fluoro-A-85380; 2-FA), a PET radioligand suitable for the quantification of α4β2* nicotinic acetylcholine receptors (nAChRs) in vivo (2–7).
The volume of distribution (VD) of a specific binding compartment (VDsb), defined as the ratio of the concentration of specifically bound radioligand in tissue to the concentration of free radioligand in blood plasma at equilibrium, is often used for receptor quantification in vivo. At concentrations of radioligand (F) lower than the dissociation constant (Kd), VDsb can be expressed as follows: Eq. 1
Eq. 1
In this equation, SB is specific binding of radioligand and Bmax is the density of receptors available for radioligand binding. If receptor affinity and the percentage of occupancy by an endogenous neurotransmitter are the same, then VDsb can be used to evaluate the densities of receptors. VDsb can be obtained as the difference between the total VD (VDT) and the nondisplaceable VD (VDnd). VDnd can be measured while receptors are saturated with a dose of unlabeled ligand or by measurement of VDT in a reference region, if available. These VD values can also be used to calculate the binding potential (BP*). BP*, defined as the ratio of VDsb to VDnd (8), is a measure of the density of receptors available for radioligand binding and also characterizes the specificity of radioligand binding in vivo; it is expressed as follows: Eq. 2Unlike VDsb, BP* is not sensitive to possible errors from assaying the radioligand concentration in blood plasma (i.e., estimation of free, unbound radioligand). In addition, BP* may be calculated without blood sampling when a reference region is available.
Here, we explored the use of muscle as an extracerebral reference region for the quantification of central receptors. Ideally, a reference region should not express the receptor under investigation and should allow an estimation of VDnd in the target region in the brain. However, it is likely that VDnd in brain tissue will not be equal to VDT in muscle (VDmsl). In this situation, if the ratio of VDnd in brain tissue to VDmsl is constant, the term α, reflecting the relationship between the 2 values, can be introduced, as follows: Eq. 3Equation 2 can be rewritten by substituting αVDmsl for VDnd (Eq. 3), as follows:
 Eq. 4Consistent with Equation 4, if α is known and constant, BP* can be calculated on the basis of VDT in the brain and VDmsl. With Equation 2, BP* calculated with muscle as a reference region (BPmsl) can be expressed as follows:
 Eq. 5
Eq. 5
By substituting Equation 5 for VDT in Equation 4, BP* can be expressed as follows: Eq. 6
Eq. 6
To explore the possibility of using muscle as an extracerebral reference region for the quantification of cerebral receptors, we first evaluated VDmsl and VDT values in various brain areas. The variability of VDmsl values was correlated with 2-FA metabolism. To determine VDnd values in various brain areas and to assess the specific binding of 2-FA in muscle and the cerebellum, blocking and displacement studies with nicotine were conducted. In blocking studies, PET measurements were obtained in monkeys chronically exposed to nicotine. In displacement studies, a bolus infusion paradigm was used, with nicotine being infused intravenously during PET once the equilibrium of the radiotracer was reached. The BP* values obtained with muscle and the cerebellum as reference regions were then compared. The reproducibility of BP* measurements was assessed by performing 2 or 3 PET scans on the same animal. Finally, 2 additional series of PET experiments were performed to investigate the possible influences of the injected mass of 2-FA and of the scanning duration on the observed BP* values.
MATERIALS AND METHODS
Radiochemistry
18F-Fluoride was produced by use of an RDS111 negative-ion cyclotron, and 2-FA was synthesized by use of a modified semiautomated method (9). The final product was formulated as a sterile and pyrogen-free isotonic solution. The radiochemical purity of the product was greater than 98%, and the specific activity was in the range of 120–1,100 GBq/μmol (mean ± SD, 400 ± 200 GBq/μmol).
PET and MRI
The adult male squirrel monkeys (Saimiri sciureus; 730–1,100 g) used in the present study were maintained in facilities fully accredited by the American Association for the Accreditation of Laboratory Animal Care (AAALAC), and all experimentation was conducted in accordance with the guidelines of the Institutional Care and Use Committee of the Intramural Research Program, National Institute on Drug Abuse, National Institutes of Health, and the Guidelines for the Care and Use of Mammals in Neuroscience and Behavioral Research (10).
Overall, 43 PET scans were obtained for 20 animals. Data were acquired with a Siemens Exact ECAT HR+ tomograph (Siemens Medical Solutions; 63 slices, center-to-center spacing of 2.4 mm, in-plane reconstructed resolution, full width at half maximum of 4.7 mm at the center of the field of view, and reconstructed axial spatial resolution of 4.2 mm in 3-dimensional mode). Before each radioligand administration, transmission scans were obtained with 3 rotating 68Ge–68Ga sources and were used to correct for photon attenuation. PET images were reconstructed from the raw data with a standard filtered-backprojection algorithm and a ramp filter.
Because the size of the PET scanner field of view could accommodate 2 squirrel monkey heads, most PET studies were performed with simultaneous acquisition of data from 2 animals. To avoid potential complexity in attenuation and scatter corrections, animals were positioned head to head in the scanner in the same z-axis. Monkeys were initially anesthetized with alfadolone and alfaxolone acetate (1.5 mg/kg; Saffan; Arnolds Veterinary Products), given intramuscularly. Anesthesia was then maintained with 1%–2.5% isoflurane. An individually molded thermoplastic face mask was secured to a custom-made monkey head holder attached to a backboard.
Anatomic MRI brain images were acquired with a 3.0-T Siemens Magnetom Allegra MRI unit (Siemens Medical Solutions). Each MRI scan was performed on a single animal with a continuous intravenous infusion of alfadolone and alfaxolone acetate (8–11 mg/kg/h) to maintain anesthesia.
Vital signs, including heart rate, electrocardiogram (during PET studies only), respiration rate, CO2 levels, and oxygen saturation in the blood (always maintained above 95%), were continuously monitored during the studies.
A total of 38 PET studies with a bolus administration of 2-FA (34 ± 18 MBq/kg injected intravenously in approximately 1 mL of saline over 20 s, followed by a 1-mL saline flush) were performed; 6 of these studies were designed to saturate the receptors. In control studies, the mass of the administered radioligand ranged from 0.03 to 0.32 nmol/kg (average, 0.13 ± 0.06 nmol/kg). For receptor saturation studies, a known amount of nonradiolabeled 2-FA was added to the radioactive compound to achieve a mass in the range of 0.6–6.1 nmol/kg. The acquisition of dynamic PET scans started with the injection of 2-FA and continued for 5 h in most of the experiments. Five PET experiments were performed with 7 h of scanning time. Five additional PET studies were performed with 8 h of scanning time and with a bolus-plus-infusion administration of 2-FA.
Coregistration and Placement of Regions of Interest (ROIs)
ROIs were drawn on the T1-weighted MR images (voxel size, 0.57 × 0.57 × 1.22 mm) of one monkey by referring to a stereotactic atlas (11). To reduce spillover effects, ROIs for the thalamus and the cerebellum (the regions with the highest and the lowest radioactivity accumulations, respectively) were reduced in size by factors of 1.8 and 8, respectively, and placed in the middle of each structure. ROIs for the muscles were placed on the back of the neck, in the area of the semispinalis cervicis, splenius capitis, and obliquus capitis muscles.
The ROI volumes (number of voxels) and the number of planes were 0.15 mL (378 voxels) and 4 planes, 0.12 mL (304 voxels) and 4 planes, 0.28 mL (705 voxels) and 6 planes, 0.13 mL (316 voxels) and 3 planes, and 0.4 mL (1,012 voxels) and 6 planes for the thalamus, cerebellum, temporal cortex, midbrain, and muscle, respectively. This standard ROI template was copied to the MR images for each monkey, and the positions of the ROIs were adjusted, if necessary, without changing the sizes of the ROIs. The final ROIs for each monkey were copied to the coregistered PET images. For coregistration, dynamic PET images for each monkey were resliced to the MRI voxel size (0.57 × 0.57 × 1.22 mm), and average PET images were manually aligned with the corresponding T1-weighted MR images by use of the fusion mode of PMOD v. 2.75 software (PMOD Technologies Ltd.). The obtained transformation parameters were applied to the respective resliced dynamic PET images.
Arterial Plasma Analysis
Arterial blood samples for the measurement of nonmetabolized 2-FA were taken from either saphenous or tail arteries by repeated puncture. Twelve to 20 blood samples (0.1–0.3 mL each) were collected at predetermined intervals that progressed from 2 min to 60 min over the duration of the study. Immediately after collection, samples were dispensed into heparin–lithium fluoride–coated tubes and placed on ice. The plasma was separated by centrifugation for 5 min at 3,000g, and radioactivity was measured with a Cobra γ-counter (Packard Instruments). Separation of nonmetabolized 2-FA from the radioactive metabolites was accomplished by solid-phase extraction as described elsewhere (12). The radioactivity of the parent compound fraction, corrected for decay and protein binding, was used as an input function in PET data analysis.
The binding of 2-FA to plasma proteins was determined with 9 plasma samples obtained from 9 monkeys. The unbound (free) radioligand was separated by ultrafiltration with a Centricon YM-10 filtration device (Millipore Corp.).
Analysis of PET Data
To obtain standardized uptake values (SUVs), (13) radioactivity concentrations (kBq/cm3) were normalized to the injected dose (kBq) per gram of body weight: SUV = tissue radioactivity/dose radioactivity. One- and 2-tissue-compartment kinetic models (1TCM and 2TCM, respectively) were applied for the calculation of VDT values in target and reference regions. Nonlinear least-squares fitting of unweighted time–activity curves was performed with the Marquardt algorithm (14) and an arterial plasma input function. The contribution of fractional blood volume in the brain was fixed at 5% for all brain ROIs (15) and 3% for muscle ROIs (16). In addition, 2-FA VD values were quantified by linear graphic analysis (Logan analysis) (17). A 4-parameter reference tissue model (18,19) and a simplified reference tissue model (1) were used for BP* calculations with either the cerebellum or muscle as a reference region.
Blocking and Displacement Studies with Nicotine
Blocking and displacement studies were performed to determine VDnd values and to assess for 2-FA–specific binding sites in the cerebellum and muscle. PET studies were performed at baseline and during continual exposure to nicotine at 2 mg/kg/d (n = 4). For nicotine exposure, 2 ALZET osmotic pumps (model 2004; DURECT Corp.; delivering 0.25 μL/h for 4 wk), each delivering nicotine at 1 mg/kg/d, were implanted under the skin on the back of each animal under ketamine–isoflurane anesthesia. The pumps were implanted 1 wk apart. PET experiments were conducted 1–2 wk after implantation of the second pump.
For the displacement studies (n = 5), 2-FA–specific binding was displaced by an intravenous nicotine infusion. A bolus infusion paradigm (Kbolus = 380 min) was used, with 2 mL of radioligand solution being administered over 5 min, followed by continuous infusion over the rest of the study (8 h) at a constant rate of 0.316 mL/h. The average rate (mean ± SD) of 2-FA continuous infusion was 0.04 ± 0.01 nmol/kg/h. At 5.5 h after the beginning of 2-FA administration, displacement of the specifically bound radioligand was initiated by the intravenous administration of nicotine at a rate of 0.24 mg/kg/h for the first 15 min, followed by 0.12 mg/kg/h for the rest of the PET study. Nicotine doses were always given as the free base.
Parametric BP* Maps
Parametric BP* maps were constructed by the method of Gunn et al. (20) with PMOD v. 2.75 software. Two types of maps were constructed, one with muscle and another with the cerebellum as a reference region. In both cases, time–activity curves for the thalamus were used as time–activity curves for the receptor-rich regions. Muscle reference region maps were corrected for differences in VDnd and VDmsl values with Equation 6.
RESULTS
Plasma 2-FA Analysis
The nonmetabolized fraction of plasma radioactivity rapidly decreased over the first 2 h after 2-FA bolus administration and later stabilized at 50% (Fig. 1A). The average percentage (mean ± SD) of parent compound observed at 5 h was 54% ± 10% (supplemental Table 1) (supplemental materials are available online only at http://jnm.snmjournals.org). This value is higher than that observed in rhesus monkeys (∼30% at 5 h) (21) and may be attributable to the use of different anesthetics (alfadolone and alfaxolone acetate in rhesus monkeys and isoflurane in squirrel monkeys) (22) or to metabolic differences between species.

(A) Fraction of nonmetabolized 2-FA expressed as percentage of total plasma radioactivity (mean ± SEM; n = 6). (B) Typical time course of elimination of radioactivity from arterial blood plasma after 2-FA administration. Values represent mean ± SEM of total plasma radioactivity (•) and radioactivity from free parent compound in plasma (nonmetabolized 2-FA) (○) measured in 6 different monkeys and expressed as SUVs. To obtain SUVs, mean radioactivity (kBq/cm3) was normalized to injected dose (kBq) per gram of body weight, as follows: SUV = tissue radioactivity/dose radioactivity (13). (C) Dynamics of radioactivity accumulation in different structures after 2-FA administration. SUVs (mean ± SEM) in thalamus (○), midbrain (•), cortex (□), cerebellum (♦), and muscle (⋄) are presented.
The free fraction of 2-FA was 83% ± 5% (mean ± SD) of the total radioactivity in plasma. Data were available from only 9 animals because of the limited quantity of blood that can be taken from squirrel monkeys. Therefore, we assumed that this fraction was constant across studies.
The clearance of 2-FA from plasma was well approximated by the sum of 3 exponential functions (Fig. 1B), and the half-life of terminal elimination from plasma (slowest exponential function) was estimated to be 3.7 ± 0.4 h. This value is approximately 2-fold higher than that in rhesus monkeys (∼2 h) (21), suggesting slow elimination in squirrel monkeys. This factor may contribute to the finding that squirrel monkey brains displayed higher SUVs (Fig. 1C) than rhesus monkey brains (21).
Estimation of VDT and VDnd
The application of 1TCM, 2TCM, and Logan analysis to the estimation of VDT values for 2-FA provided similar results (Fig. 2). The highest VDT values were observed in the thalamus, intermediate values were observed in the temporal cortex and midbrain, and the lowest values were observed in the cerebellum and muscle.

Comparison of VDT values obtained with 1TCM, 2TCM, and Logan approaches in control (CTRL; n = 6) and in blocking (BLK; n = 4) studies. Results are expressed as mean ± SEM of VDT values obtained with different approaches. Note high consistency and similar variability among VDT values.
In contrast, brain VD values measured under chronic nicotine exposure were similar in all studied regions (Fig. 2), suggesting a nearly complete blockade of 2-FA–specific binding and the possibility of using VD estimates from blocking studies as measures of VDnd. For example, the average difference between VDnd values in the thalamus and the cerebellum was only 3.4% ± 1.5% (±SEM). The VD values measured in muscle were slightly lower than those observed in the brain (Fig. 2).
2TCM did not provide identifiable values for VDsb in control experiments. Similar difficulties were previously reported with analogs of 2-FA (23,24) and with other radiotracers (25). Compared with 1TCM, 2TCM provided better fit of the dynamic PET data for all ROIs, including muscle (supplemental Fig. 1). Similarly, 2TCM provided better fit in the nicotine blockade experiments, suggesting that in a compartment of nondisplaceable radioactivity, the 2-FA distribution is more complex than simple diffusion.
In the cerebellum, VDnd values (mean ± SEM) measured during blocking studies were 9% ± 4% lower than VDT values estimated during control studies with the same animals, suggesting limited 2-FA–specific binding in the cerebellum. In comparison, we did not find any specific binding of 2-FA in muscle (the difference was 0% ± 6%), suggesting that both areas may be used as reference regions.
To confirm that specific binding of 2-FA is absent in muscle and limited in the cerebellum, we performed nicotine displacement studies in a single experiment with the bolus infusion paradigm for 2-FA administration (Fig. 3A). Intravenous nicotine infusion resulted in nearly complete washout of specifically bound radioligand from the thalamus and the cortex (the half-lives for washout were 21 and 25 min, respectively) (Fig. 3A). VD values were calculated as the ratio of radioactivity measured in brain tissue to free, nonmetabolized plasma 2-FA. VDT and VDnd values in the cerebellum and muscle were assessed as measures of VD before and after nicotine challenge by averaging the concentrations from 5 to 5.5 h and from 7.5 to 8 h, respectively. VDT and VDnd estimates were very similar to those provided by the blocking studies (Figs. 2 and 3B). Estimated from a displacement study, 2-FA–specific binding in the cerebellum was 7% ± 4% of VDT (mean ± SEM). The VD value in muscle after nicotine administration was slightly higher than that under baseline conditions (3.8% ± 2.3%). These data confirmed the absence of specific binding in muscle and the limited specific binding in the cerebellum.
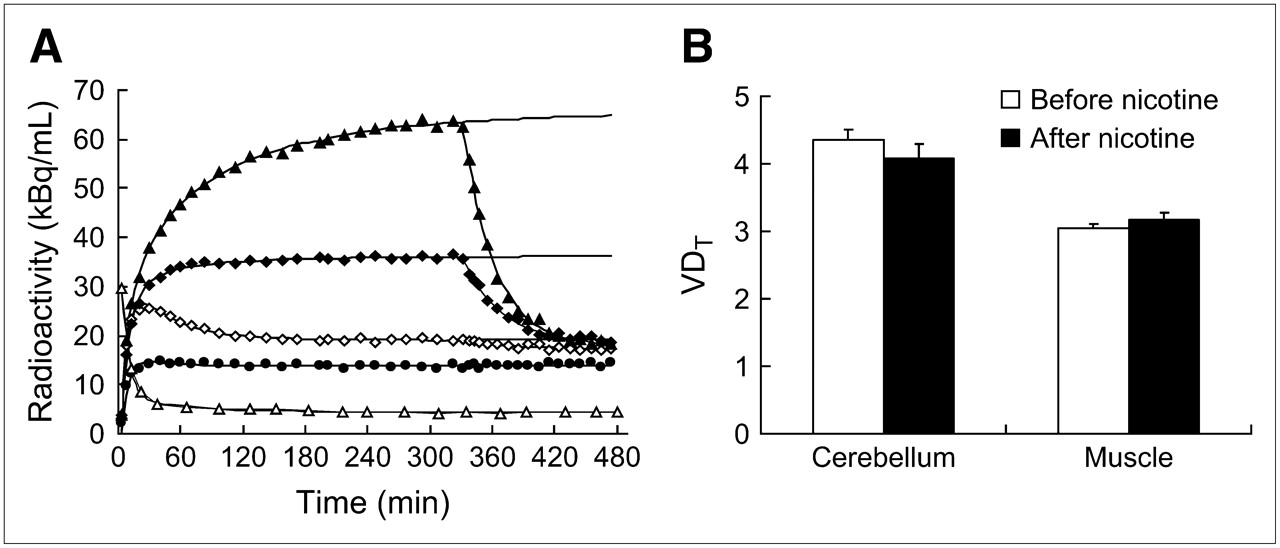
Effect of nicotine infusion during PET studies. (A) Representative dynamics of radioactivity accumulation in different structures after bolus administration of 2-FA. Nicotine infusion was initiated at 330 min. Regions displayed include thalamus (▴), cortex (♦), cerebellum (⋄), muscle (•), and blood (▵). (B) Average displacement induced by nicotine in 5 different experiments. Results are expressed as mean ± SEM of VDT values in cerebellum and muscle structures; data were collected during 1-h periods either before (⋄, ▵) or 2 h after (▴, ♦, •) infusion of nicotine.
The variability of VDT measurements in muscle was determined for 15 subjects. As shown in supplemental Table 1, this parameter is very conservative (coefficient of variation was 8%). To determine whether differences in 2-FA metabolism have an impact on muscle VDT measurements, VDT values were compared with the percentages of nonmetabolized plasma radioligand observed 5 h after injection. Despite the wide range of percentages of nonmetabolized radioligand fraction (40%–70%), there was no correlation between the magnitude of 2-FA metabolism and VDT measurements (r = 0.06; supplemental Table 1), suggesting that metabolite accumulation has no significant effect on VDT measurements in muscle.
The average VDnd values in the thalamus, cortex, and midbrain, obtained in 4 blocking studies, were 4.1 ± 0.2, 4.2 ± 0.3, and 3.8 ± 0.1, respectively (Fig. 2). Using the average of these values (4.06 ± 0.21) and an average VDT value in muscle (3.02 ± 0.24; n = 15), we calculated α (the ratio of VDnd to VDT in muscle; see Eqs. 3, 4, and 6) to be 1.34. This coefficient and Equation 6 were used for the calculation of BP* values with muscle as a reference region.
BP* Values
Four-parameter reference region (18) and simplified reference region (SRTM) (1) approaches were used to calculate BP* values. Both methods are based on the assumption that there is no specific binding compartment in the reference region and therefore that dynamic brain PET data can be described by 1TCM. As mentioned earlier, no 2-FA–specific binding was seen in muscle, and the amount of specific binding seen in the cerebellum was small. Nonetheless, 2TCM provided a better data fit. The clearance constants (k2) measured under control conditions in the 4 animals studied were 0.009 ± 0.001, 0.017 ± 0.004, 0.043 ± 0.008, and 0.031 ± 0.004 in the thalamus, temporal cortex, cerebellum, and muscle, respectively. BP* values calculated with the 4-parameter reference region and SRTM approaches were nearly identical; therefore, only SRTM results are reported in Table 1 and supplemental Table 2. As shown in Table 1, BP* values obtained with the cerebellum or muscle as a reference region or from a direct assessment of VDT and VDnd were similar, suggesting that these reference region approaches are valid for analysis of this set of data.
Comparison of BP* Values in Thalamus and Temporal Cortex, Calculated from VDT and VDnd Values Obtained During Blocking Studies (BP*blk) or Calculated with SRTM Approach and Muscle (BP*msl) or Cerebellum (BP*cb) as Reference Region
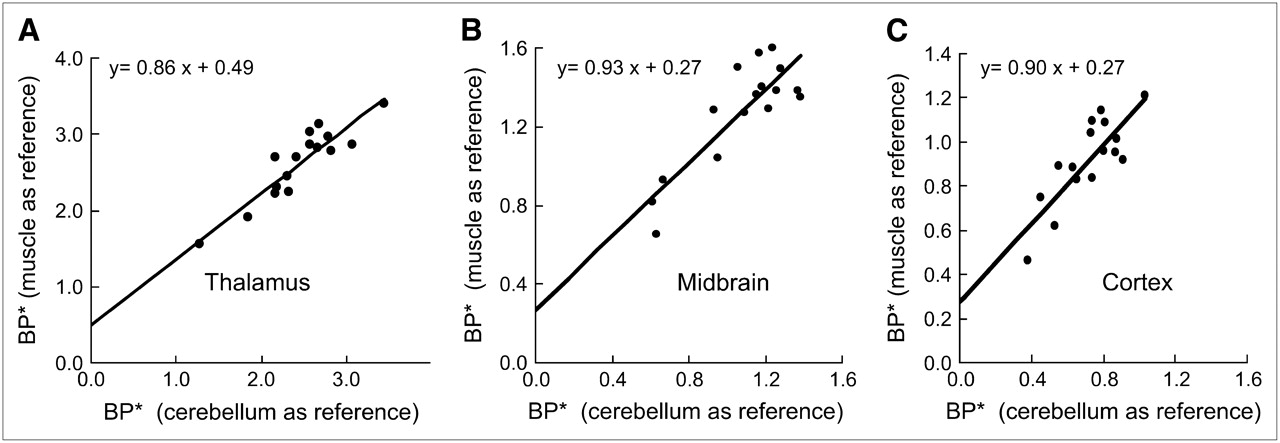
A significant correlation (r = 0.91, 0.85, and 0.82 for thalamus, midbrain, and cortex, respectively; P < 0.0001; n = 16) was found for BP* values estimated with the cerebellum as a reference region and BP* values estimated with muscle as a reference region. The same time–activity curves from each target region in each animal were used for these calculations.
Although there was a linear relationship between the 2 sets of data (parameters are shown in Fig. 4), a small deviation of the intercept from 0 indicates an underestimation of BP* values obtained with the cerebellum as a reference region because of the presence of some specific binding in that structure.

Correlation of apparent BP* values measured with cerebellum (abscissa) or muscle (ordinate) as reference region. Results were obtained from 16 different monkeys. Significant correlations were noted in 3 brain areas (r = 0.91, 0.85, and 0.82 for thalamus, midbrain, and cortex, respectively).
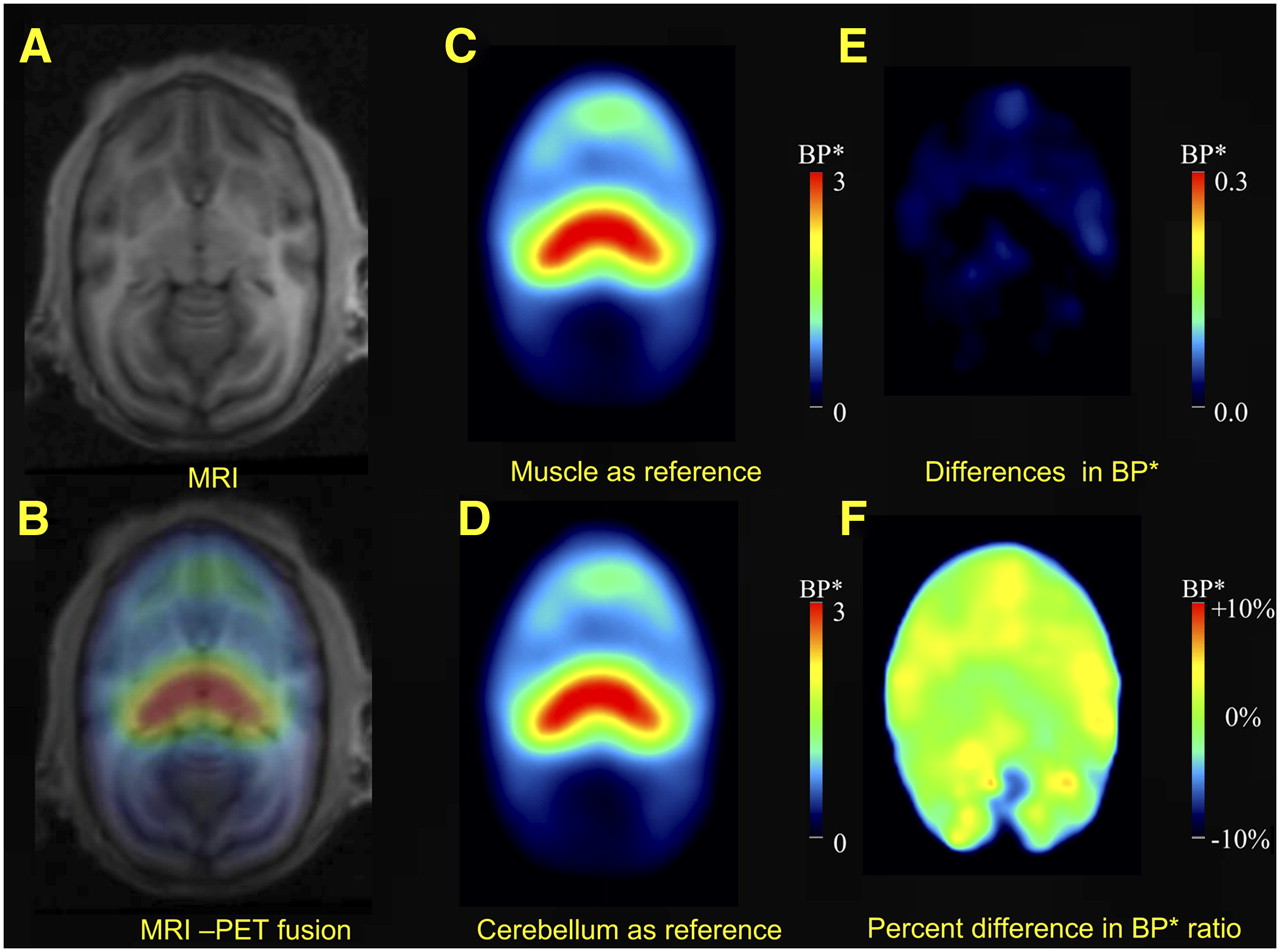
Figure 5 provides a pixel-wise representation of differences between BP* values obtained with muscle as a reference region (Fig. 5C) and BP* values obtained with the cerebellum as a reference region. Differences between these values were negligible (Figs. 5E and 5F).

Images showing that similar BP* values were obtained with cerebellum or muscle as reference region. (A) Representative MRI horizontal section at level of thalamus in squirrel monkey. (B) Fused MRI and PET images. (C and D) Images showing BP* values measured with muscle (C) and with cerebellum (D) as reference regions. (E) Difference between C and D, indicating similar values for whole brain with either muscle or cerebellum as reference region. (F) Same difference as in E but expressed as percentage of values obtained with cerebellum as reference region.
As a final step toward the use of muscle as a reference region, the reproducibility of BP* measurements was evaluated. Similar BP* values and similar coefficients of variation (∼10%) were obtained with both methods (SRTM with cerebellum and SRTM with muscle) (supplemental Table 2).
Influence of Duration of Scanning
To define the minimum data acquisition time required to derive stable BP* values with SRTM, regional time–activity curves were fitted over various time periods ranging from 160 to 420 min (Fig. 6). In the thalamus and the temporal cortex, a minimum of 240 min of scanning was required to obtain stable values (±5% compared with those seen at 420 min).
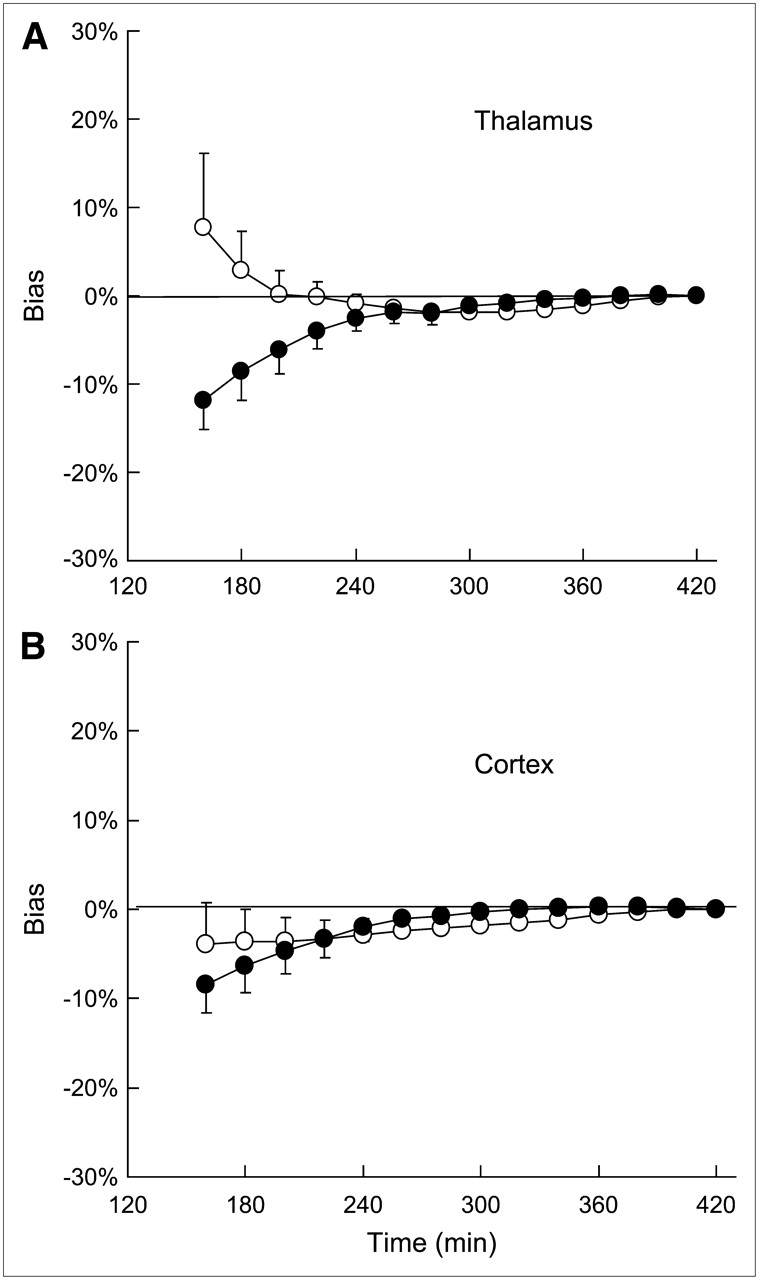
Effect of study duration on stability of BP* values measured with cerebellum (○) or muscle (•) as reference region. BP* values (mean ± SD; n = 5) are expressed as percentage deviation from value obtained with 7-h scanning time. (A) Thalamus. (B) Cortex.
Influence of Mass of Radioligand
The higher the mass of 2-FA administered, the lower the BP* values obtained (Fig. 7). The effective dose (ED50) for this effect (3.2 ± 0.3 nmol/kg) indicates that squirrel monkeys had a higher sensitivity to 2-FA than rhesus monkeys (ED50, ∼7.4 nmol/kg) (21). Therefore, to avoid underestimating BP* values by more than 5%, the mass of the injected radioligand in squirrel monkeys should not exceed 0.17 nmol/kg. The higher sensitivity of squirrel monkeys to 2-FA might be explained by slower 2-FA metabolism and elimination in squirrel monkeys than in rhesus monkeys.
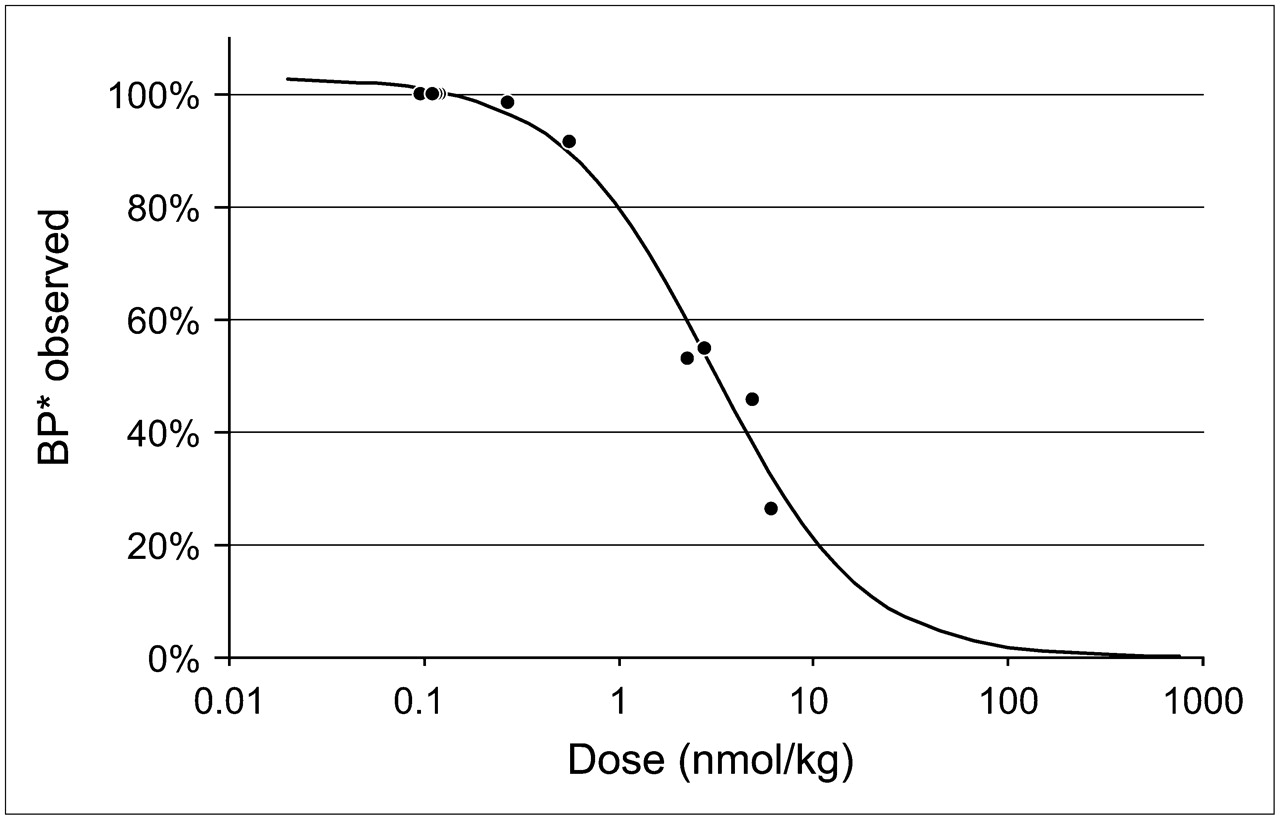
Effect of mass of administered radioligand on apparent BP* values measured in thalamus with cerebellum as reference region. ED50 of this effect (3.2 ± 0.3 nmol/kg) was calculated on basis of results obtained for 4 animals in 9 separate PET studies with bolus administration of 2-FA at doses ranging from 0.1 to 6.1 nmol/kg. Obtained values were expressed as percentage of control values obtained when radioligand was injected at lowest dose (0.1–0.12 nmol/kg). Control BP* values in 4 animals used in this experiment were 3.0, 2.7, 2.5, and 2.4.
DISCUSSION
The present study demonstrates the ability of 2-FA to quantify α4β2* nAChRs in vivo in squirrel monkeys. The regional VDT and BP* values observed were in good agreement with known nAChR distributions. Displacement and blocking studies with nicotine indicated limited specific binding in the cerebellum and the absence of specific binding in muscle. The BP* values calculated from VDnd measured during blocking studies were nearly identical to the BP* values obtained with the cerebellum and muscle as reference regions. These results suggest that it is possible to use an extracerebral area to quantify central receptor expression.
This is the first report of the use of 2-FA in squirrel monkeys. The highest accumulation of radioactivity occurred in the thalamus, consistent with the findings of previous human (26), rhesus monkey (21), baboon (27), and rodent (27) studies. The VD of 2-FA was measured with 1TCM, 2TCM, and Logan analysis; all 3 approaches led to similar results. The relatively large fraction of VDT in the thalamus, cortex, and midbrain of squirrel monkeys was attributable to specific binding, with VDT values in those areas in squirrel monkeys being higher than those in humans and other nonhuman primates but lower than those in rodents (21,26,27).
VDT and VDnd values in the cerebellum were similar, suggesting low specific binding and the possible use of this area as a reference region for BP* calculation. The fact that the BP* values obtained with the cerebellum as a reference region were in good agreement with the values calculated from VDT and VDnd measured during blocking studies further supports this possibility. Interestingly, although nAChR expression in the rhesus monkey cerebellum is also limited (21), significant expression has been found in rodents (27,28), baboons (27,29), and humans (5,26,30). However, because VDnd measured during blocking studies resulted in slightly higher BP* values (Table 1), probably reflecting a small, but reasonable, specific binding compartment, it is likely that in situations that produce the upregulation of nicotinic acetylcholine receptors (e.g., chronic exposure to nicotine (31)), the use of the cerebellum as a reference region will introduce substantial bias.
In contrast, VDT and VDnd values in muscle were nearly identical and were very consistent, indicating the absence of specific binding. VDnd values measured during blocking and displacement studies with nicotine were reasonably constant in the brain, as illustrated by the small variability between animals. From these data, the ratio of VDnd in the brain to VDT in muscle was estimated to be 1.34. Using α in Equation 6, we calculated BP* values in various brain areas with SRTM and muscle time–activity curves as input functions. These values were in good agreement with the values obtained with VDnd measured directly during blocking studies, supporting the use of muscle as a reference region. This conclusion is strengthened by the significant correlation between BP* values measured in 15 animals with the cerebellum and muscle as reference regions. The use of muscle is also supported by the reliability of BP* estimates, as assessed by test–retest analysis performed for 7 monkeys (supplemental Table 2).
To examine the possible underestimation of BP* values, we considered 2-FA dose and scan time as factors. We estimated that BP* values will be underestimated by 50% after 2-FA administration at a dose of 3.2 nmol/kg. This finding suggests that doses of 2-FA should be smaller than 0.17 and 0.35 nmol/kg to avoid underestimation by more than 5% and 10%, respectively. Further, because of the slow kinetics of 2-FA, insufficient PET data acquisition time may also produce an underestimation of BP* values. The results of our control experiments with a data acquisition time of 7 h suggest that 5 h of scanning is adequate for accurate measurements (<5% underestimation) with SRTM and the cerebellum or muscle as a reference region (Fig. 6).
Although the results of the present study suggest that the use of an extracerebral reference region provides accurate BP* measurements, there are several theoretic issues regarding this approach. The first is that the difference in blood flow between tissues is substantial. In squirrel monkeys, resting muscle blood flow averages about 5 mL/min/100 g, whereas the value in the brain is approximately 60 mL/min/100 g (32). Therefore, the extraction fraction of radioligand from blood may be much higher in muscle, and the accumulation of radioligand in muscle could depend on blood flow. K1, a constant defining the rate of radiotracer transfer from plasma to tissue, is a product of regional blood flow and the unidirectional extraction fraction; it is expressed as follows: Eq. 7
Eq. 7
In Equation 7, F is regional blood flow, E is the unidirectional extraction fraction (from blood) and PS is the permeability surface–area product (33–35).
Consequently, to consider K1 as a true constant, it is important that blood flow be reasonably stable during the period of study. If blood flow is stable, differences in blood flow between brain regions and muscle, by themselves, do not create obstacles to the use of muscle as a reference region. The only requirement for conventional reference region analysis is that the ratios of K1 to k2 and K1′ to k2′, which correspond to VDnd and VDT in the target and reference regions, respectively, be equal (20). Because it is possible that the anesthesia used in the present study contributed to the stability of blood flow, further studies are needed to validate this approach in awake animals.
A second theoretic issue is that conventional reference region approaches require that the kinetics of radioligand accumulation in the reference region can be described by 1TCM. As shown in Table 1, BP* values calculated with the cerebellum or muscle as a reference region and from a direct assessment of VDT and VDnd were similar, validating the utility of the reference region approaches for analysis of this set of data.
Third, VDnd values in brain regions and muscle may be different. In the present study, because the ratio of VDnd to VDmsl was constant and known, we were able to measure BP* in the target region by applying Equation 6.
Finally, most radiotracers are metabolized in the body, and the level of accumulation of radioactive metabolites outside the brain might be higher than that in brain tissue, resulting in an overestimation of VDmsl values and introducing bias in BP* measurements. In the present study, we found no correlation between 2-FA metabolism and VDT measurements in muscle (supplemental Table 1), suggesting that this factor does not contribute to problems in analysis. 2-FA metabolism is relatively slow in squirrel monkeys and is comparable to that in humans (12), suggesting that a muscle reference region may also be appropriate in human studies. The higher rates of metabolism in other species may introduce more bias. This limitation could be reduced by use of a bolus infusion radioligand administration paradigm, because the fraction of plasma metabolites in such a scenario will be much smaller. Additional studies should be performed to validate this requirement in different species and, especially, with other radioligands.
CONCLUSION
The results of the present study demonstrate that 2-FA can accurately quantify nAChRs with a reference region outside the brain. These results suggest that the accurate quantification of central receptors is feasible with extracerebral reference regions, providing a novel approach for the quantification of brain receptors when no suitable brain reference region is available or when the assessment of the free fraction of the parent compound in the blood is difficult.
Acknowledgments
This study was supported by the Intramural Research Program, National Institute on Drug Abuse, National Institutes of Health, U.S. Department of Health and Human Services.
Footnotes
-
COPYRIGHT © 2007 by the Society of Nuclear Medicine, Inc.
References
- Received for publication January 18, 2007.
- Accepted for publication May 31, 2007.


