


Abstract
The use of myocardial perfusion 82Rb PET/CT studies continues to increase but its accuracy using database quantification methods for the diagnosis of coronary artery disease (CAD) has not been established. Methods: A sex-independent normal database and criteria for abnormality for rest–stress 82Rb PET/CT myocardial perfusion imaging were developed and validated by evaluation of 281 patients (136 females: mean age ± SD, 63.3 ± 13.3 y; 145 males: mean age ± SD, 63.9 ± 12.8 y) who underwent a rest–adenosine stress 82Rb PET/CT study. These patients were divided into 3 groups: (a) healthy group: 30 patients, with <5% likelihood of CAD (low likelihood [LLK]) based on sequential Bayesian analysis; these patients were used to generate the normal distribution; (b) pilot group: 174 patients; these patients were used to determine the optimal criteria for detecting and localizing the perfusion abnormality; and (c) validation group: 76 patients (23 with LLK of CAD and 53 who underwent coronary angiography; these patients were used for prospective validation. Results: Of the 53 patients who underwent coronary angiography, 8 had <50% stenosis and 45 patients had at least one stenosis ≥50% in one major artery. Fifteen patients had single-vessel disease, 17 had double-vessel disease, and 13 had triple-vessel disease. The prospective validation shows a normalcy rate of 78% (18/23) for global CAD. The analyses by individual arteries show a normalcy rate of 96% (22/23) for the left anterior descending coronary artery, 96% for the left circumflex coronary artery (22/23), and 100% for the right coronary artery (23/23). The overall sensitivity for detection of CAD (≥50% stenosis) was 93% (42/45). The overall specificity for detection of the absence of CAD (≤50% stenosis) was 75% (6/8). Also, the positive predictive value for global CAD was 95% (42/44), the negative predictive value was 67% (6/9), and the accuracy was 91% (48/53). Conclusion: The quantitative 82Rb PET/CT database created and validated in this study is highly accurate for the detection and localization of CAD. Physicians should consider using the quantitative output of these algorithms as decision support tools to aid with image interpretation.
Rest–stress 82Rb myocardial perfusion PET is widely regarded as a clinically accurate imaging modality for diagnosing and managing patients with coronary artery disease (CAD) (1,2). The reasons given for this high diagnostic performance are (a) the kinetic properties of 82Rb, (b) the high sensitivity of a ring PET system, (c) the high-contrast resolution of PET scanners, and (d) the accurate attenuation correction used in PET (1–4). With the advent and wide dissemination of PET/CT scanners for cardiac imaging, high-quality transmission scans are generated by the CT scanner for attenuation correction.
Although these PET/CT scanners yield high imaging performance, misregistration of the CT transmission and PET emission scans is often seen because of the different temporal resolution of the 2 modalities. Moreover, the transmission scan used for attenuation correction generated from the CT scan uses low-energy x-rays rather than the 511-keV photons from the 68Ge ring sources. These protocol differences raise the concern for increased variability of normal 82Rb perfusion images, potentially degrading image quality and decreasing the diagnostic accuracy for detecting CAD by quantification methods.
Previous studies have reported the development of methods for incorporating clinically validated database quantification to analyze planar (5) and SPECT myocardial perfusion studies (6–8) and, to a lesser degree, PET perfusion studies (9). This study was undertaken to objectively test the diagnostic accuracy of database quantitative analysis for the detection and localization of CAD using rest–stress 82Rb PET studies with CT-based attenuation correction and a newly developed normal database and criteria for abnormality applied to a prospective population.
MATERIALS AND METHODS
Study Population
Two hundred eighty-one patients (136 females [48%]: mean age ± SD, 63.3 ± 13.3 y; 145 males [52%]: mean age ± SD, 63.9 ± 12.8 y) comprised the study population. These patients underwent electrocardiographically (ECG) gated rest–ungated stress 82Rb PET/CT myocardial perfusion studies. The studies were obtained from 2 institutions: Brigham and Women's Hospital (Boston, MA) and Emory University Hospital (Atlanta, GA). The study population was divided into 3 groups: a healthy group, a pilot group, and a prospective validation group.
Healthy Group
The normal limits for 82Rb PET/CT myocardial perfusion studies were developed by evaluation of 30 patients (16 females: mean age ± SD, 63.8 ± 12.5 y; 14 males: mean age ± SD, 63.3 ± 17.2 y) defined by having a <5% (low) likelihood of CAD based on sequential Bayesian analysis of age, sex, and symptom classification (10). Also, these patients had a normal baseline ECG, no induced ECG changes after pharmacologic stress, no major risk factors for CAD, or a history of previous cardiac events. All patient studies in this healthy group came from Brigham and Women's Hospital.
Pilot Group
The pilot group consisted of 174 patients (85 females [49%]: mean age ± SD, 64.6 ± 12.0 y; 89 males [51%]: mean age ± SD, 63.1 ± 14.2 y). These patients were used to determine the optimal criteria for detecting and localizing perfusion abnormalities. All patient studies in this pilot group came from Emory University Hospital.
Validation Group
The normal limits and criteria for detection of perfusion abnormalities were prospectively validated in a group of 76 patients (34 females, 42 males: mean age ± SD, 66.8 ± 11.2 y). This group was composed of 23 low-likelihood patients and 53 patients with known or suspected CAD who underwent coronary angiography within 18 ± 19 d of imaging. The 53 patients (24 females, 29 males) who underwent catheterization consisted of 8 patients with normal or 50% stenosis and 45 with at least ≥50%-diameter stenosis in one of the major coronary arteries. Fifteen patients had single-vessel disease, 17 had double-vessel disease, and 13 had triple-vessel disease. The 53 patients who underwent coronary angiography had a high prevalence of risk factors for CAD: 44 (85%), hypertension; 23 (44%), diabetes mellitus; 43 (83%), hyperlipidemia; and 6 (13%), smoking. Also, 29 (56%) of these patients had prior revascularization and 14 (27%) had prior myocardial infarction.
The 23 prospective, low-likelihood patients were used to assess normalcy. This prospective validation consisted of the comparison of quantitative results and the results of coronary angiography and the likelihood of CAD. This analysis was performed totally objectively without using any subjective visual assessment of the perfusion distribution or left ventricular function data. All patient studies in this validation group came from Emory University Hospital.
82Rb PET Scan Protocols
All scans were acquired using a Discovery ST PET/CT scanner (GE Healthcare), comprised of a full 6.3 × 6.3 × 30-mm bismuth germanate block detector ring of 157-mm field of view operating in the 2-dimensional mode. The CT uses a 16-slice detector array with a tube current range of 10–440 mA, peak kilovoltage with a range of 80–140 kVp, and maximum gantry rotation speed of 3 Hz. The scanner is equipped with a cardiac gating input, which receives a forward R-wave trigger pulse supplied by an ECG. The images were acquired after conventional methodology (11). Briefly, patients were asked to stop taking nitrates for 6 h, calcium-channel blockers for 24 h, and β-blockers for 48 h before the cardiac PET/CT scan. Also, the patients were instructed not to consume caffeine-containing products for 24 h before the test.
The images were acquired as follows: a scout CT was done to check the patient position. After that, a slow CT attenuation scan was performed with the lowest pitch (0.562:1) allowed by the scanner, covering the chest cavity in 16 s on patients under shallow breathing. Then a 1,480- to 2,220-MBq (40–60 mCi) dose of 82Rb was injected, and a 7-min dynamic rest 2-dimensional emission scan followed by a 7-min rest gated scan were acquired. Pharmacologic stress was then started using adenosine (140 μg/kg/min × 6 min). A 1,480- to 2,220-MBq (40–60 mCi) dose of 82Rb was injected at the end of the second minute of the pharmacologic infusion. A 7-min dynamic stress 2-dimensional emission scan was acquired (11).
Emission data were corrected for attenuation, scatter, and random events and reconstructed using the manufacturer-supplied ordered-subsets estimation maximization (OSEM) algorithm (2 iterations, 28 subsets) with a Butterworth postprocessing filter of cutoff frequency 0.45 and power 10. The studies were analyzed by summing all frames after the left ventricular cavity counts dropped to half of the cardiac tissue concentration. The magnitude of misalignment was assessed using the ImagenPro PET QC program (Cardiovascular Imaging Technologies). Briefly, the misalignment was determined by visual inspection of the superimposition of the emission and transmission images. When misalignment was detected visually by the technologist from fused CT and myocardial perfusion imaging (MPI) images as the MPI myocardium encroaching the lung field, the MPI images were manually realigned 3-dimensionally to be in the pericardial sac and not intersecting the lung. Manual realignment of the transmission image was required in approximately 30% of patients to ensure proper registration before image reconstruction (11).
Quantitative Analysis
The automatic image-processing technique found in the Emory Cardiac Toolbox (ECTb; Syntermed, Inc.) was used to identify left ventricular landmarks from short-axis slices that were then verified by an operator. The following parameters were determined: the apical and basal short-axis slices, the central axis of the left ventricular chamber, and a limiting radius (from the left ventricular center) for the myocardial count search.
Normal Limits
ECTb was used to extract the 3-dimensional left ventricular myocardial perfusion distribution. To determine whether there were sex differences, the normal distributions of male and female attenuation-corrected (AC) studies were first generated separately. The distribution from male and female PET/CT studies was combined and averaged to produce a single file of mean normal-count regional distribution (sex-independent normal database). This is different from what has been done with the previously developed normal databases from uncorrected studies, in which sex-matched files were created separately for male and female subjects. The mean ± 1 SD was generated for each of 12 myocardial segments from apex to base. These 12 segments are maximal-count distributions from apex to base. The patients that constitute the low-likelihood (LLK) group may not all have 12 slices from apex to base but they are interpolated (normalized in size) to 12 slices so that normal files would always be the same number of slices. This is part of our standard normal file development methodology (7).
Generation of Thresholds of Normal Limits and Criteria for Abnormality
A sex-independent normal database was generated by use of the PET/CT studies from the LLK healthy male and female subjects. For each patient's study in the pilot group, oblique slice images and raw polar maps produced by ECTb software were interpreted visually by 2 experts. Myocardial perfusion was scored for each of the 20 segments on a 5-point scale: 0, normal; 1, equivocal; 2, mildly reduced; 3, moderately reduced; and 4, severely reduced. The experts' 20 segment scores were compared with the 12 myocardial-segment profile generated from the normal group by regrouping the 20-segment model in 7 regions as previously described (7). These scores were then compared with quantitative results to generate receiver-operating-characteristic (ROC) curves from which the criteria for abnormality were determined for each vascular territory by use of previously reported procedures (7). After definition of a sex-independent PET/CT normal database and criteria for abnormality, the prospective group was submitted to quantitative analysis. These quantitative results were compared with the stenosis observed at angiography and with the likelihood of CAD (7).
Coronary Angiography
Coronary angiography was performed by standard percutaneous techniques. Clinical angiographic reports, based on visual interpretations of at least 2 experienced angiographers, were used for correlation with PET/CT findings. The criterion for a significant stenosis was set at 50% and 70% or greater obstruction in one major coronary artery. For comparisons with the perfusion study, left main coronary lesions (≥30% for 50% threshold and 50% for 70% threshold, respectively) were recorded as left anterior descending coronary artery (LAD) and left circumflex coronary artery (LCX) disease. Diagonal lesions were considered LAD, and obtuse marginal arteries were considered LCX. Lesions of the posterior descending branch were recorded as right coronary artery (RCA).
Statistical Analysis
Continuous data were expressed as mean ± SD. Paired t tests were used to compare differences in the continuous data. For determining abnormality in each of the 7 myocardial regions, a range of SD thresholds (1.0, 1.5, 2.0, 2.5, 3.0) and region percentages (6%, 8%, 10%, 12%, 14%, 16%, 18%, 20%) was submitted to the ROCFIT program (University of Chicago, Chicago, IL) along with the patients' segmental visual perfusion scores. The output of the program consisted of sensitivity and specificity values for each threshold percentage combination. These values were listed in table format and also plotted as ROC curves. Optimal SDs to be used as thresholds of abnormality for the 7 regions of the myocardium were determined by analyzing the output of the ROCFIT program. Decisions on optimal criteria for abnormality are made in each of 7 myocardial segments (apex, anterior, anteroseptal, inferoseptal, inferior, inferolateral, high lateral). The actual sensitivity and specificity values from the ROC curve and the percentage of segmental hypoperfused area associated with each sensitivity/specificity pair are considered when selecting each regional threshold as abnormality criteria. For rubidium, our general approach was to choose the best sensitivity/specificity pair for 10% extent of perfusion defect in each vascular territory.
For detection of individual coronary arteries, only patients who underwent catheterization were evaluated. Vessel sensitivity was defined as the proportion of vessels with diameter stenosis of ≥50% or ≥70% having an abnormality in the corresponding location on the stress polar map. Vessel specificity was defined as the proportion of vessels with <50% having a normal territory in the corresponding location of the polar map. The ECTb polar map artery distribution was used to define the myocardial perfusion segments (ECTb; Syntermed, Inc.).
RESULTS
Distribution of Normal Limits
Figure 1 shows polar maps of the normal mean and SD stress and rest 82Rb myocardial distributions obtained from all patients with LLK of CAD. Figure 2 shows the 20-segment models of the mean and the SD values for stress and rest myocardial perfusion images. The stress and rest images show a similar distribution pattern in which the higher percentage (100%) values are located in the lateral wall and the lower percentage values are located in the basal septum. The smallest SD corresponds to the lateral wall and the largest SD corresponds to the basal septum for both stress and rest myocardial images.

Sex-independent polar map for rest and stress PET/CT mean normal myocardial distribution and SD of all patients with LLK of CAD. (A) Stress normal mean polar map. (B) Stress SD polar map. (C) Rest normal mean polar map. (D) Rest SD polar map. In these polar maps, colors can be used to visually assess relative count distribution within each map. However, because the maps are normalized independently, color cannot be used to compare absolute differences between them. Stress and rest mean normal polar maps show homogeneous myocardial perfusion distribution for left ventricular mid-myocardium, with slight count reduction at apex. SD polar maps show a similar distribution for stress and rest SD. SD polar maps show low variability for most of ventricular myocardium with exception of the basal septal region.
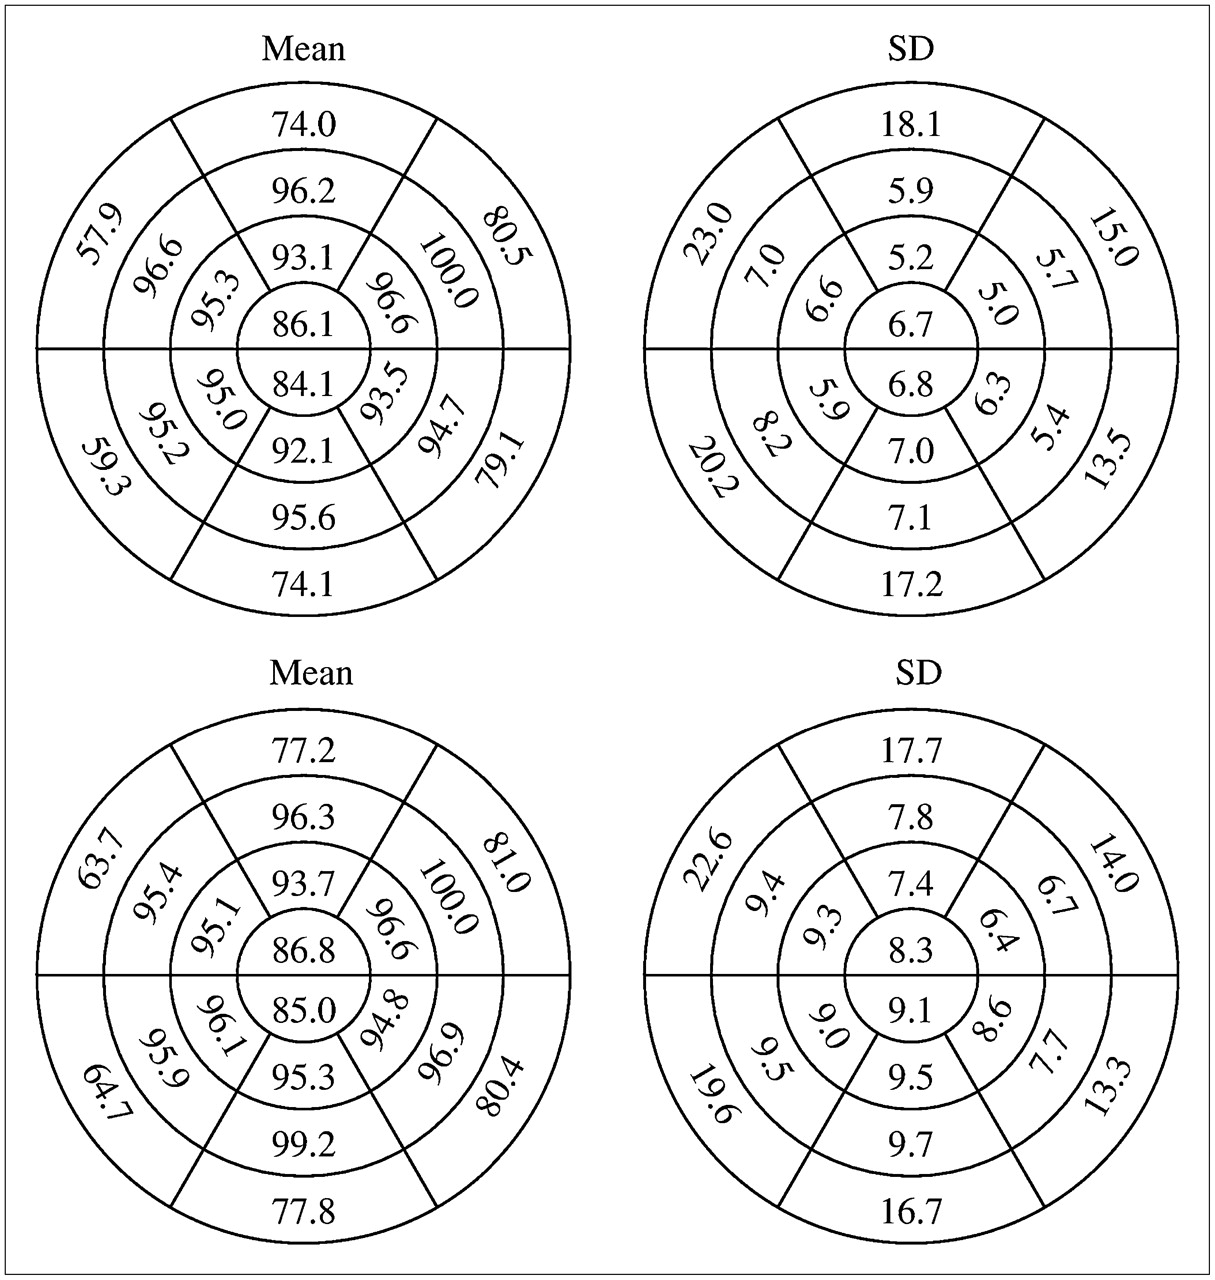
Sex-independent 20-segment model mean and SD distribution for rest and stress 82Rb PET/CT. Mean values for each polar map are scaled to a maximum value, which is set to 100.0. Maximum occurs in mid-anterolateral segment for both stress and rest. Homogeneity of mid-myocardium, seen visually in Figure 1, is reflected in these values with, again, slight reduction at apex. Myocardial base shows more reduction in counts, and greater variability on SD map, due to slight attenuation misregistration, variable size of heart from patient to patient, and presence of membranous septum.
Determination of Criteria for Stress Abnormality
Criteria for abnormality thresholds are a combination of the number of SDs below the mean normal distribution and the global and regional extent of hypoperfusion. The determined criteria for stress abnormality expressed in terms of SDs below the mean normal limit were established as 3 SDs for anterior, high lateral, inferolateral, and apex regions and 2.5 SDs for inferior, inferoseptal, and anteroseptal regions. The determined criteria in terms of global and regional extent are listed in Table 1. Profiles were compared with mean normal, and optimum criteria for abnormality were determined by ROC analysis in each of 7 myocardial wall segments: anteroseptal, anterior, high lateral, inferolateral, inferior, inferoseptal, and apex. These SD and extent thresholds for stress abnormality were determined as the criteria that yielded the optimal sensitivity/specificity tradeoff in the pilot group.
Regional Hypoperfusion Criteria for Abnormality
Prospective Validation
The prospective validation of perfusion defect detection and localization was performed by use of the optimal criteria established as described.
Normalcy Rate.
Five of the 23 patients with LLK of CAD had a perfusion defect of >3% of the left ventricular myocardium, and they were classified as abnormal, as shown in Figure 3 (normalcy rate, 78%). The analysis by individual arteries shows a normalcy rate of 96% (22/23) for LAD, 96% for LCX (22/23), and 100% for RCA (23/23) (Fig. 3).

Performance of 82Rb PET/CT database in patients with <5% likelihood of CAD. Quantitative criteria for abnormality reported in Table 1 were used to calculate normalcy rate.
Performance of 82Rb Quantitative Database in Comparison with Coronary Angiography.
The overall sensitivity for detection of CAD (≥50% stenosis) was 93% (42/45). The overall specificity for detection of the absence of CAD (≤50% stenosis) was 75% (6/8), as shown in Figure 4. Also, the positive predictive value (PPV) for global CAD was 95% (42/44), the negative predictive value (NPV) was 67% (6/9), and the accuracy was 91% (48/53), as shown in Figure 4.
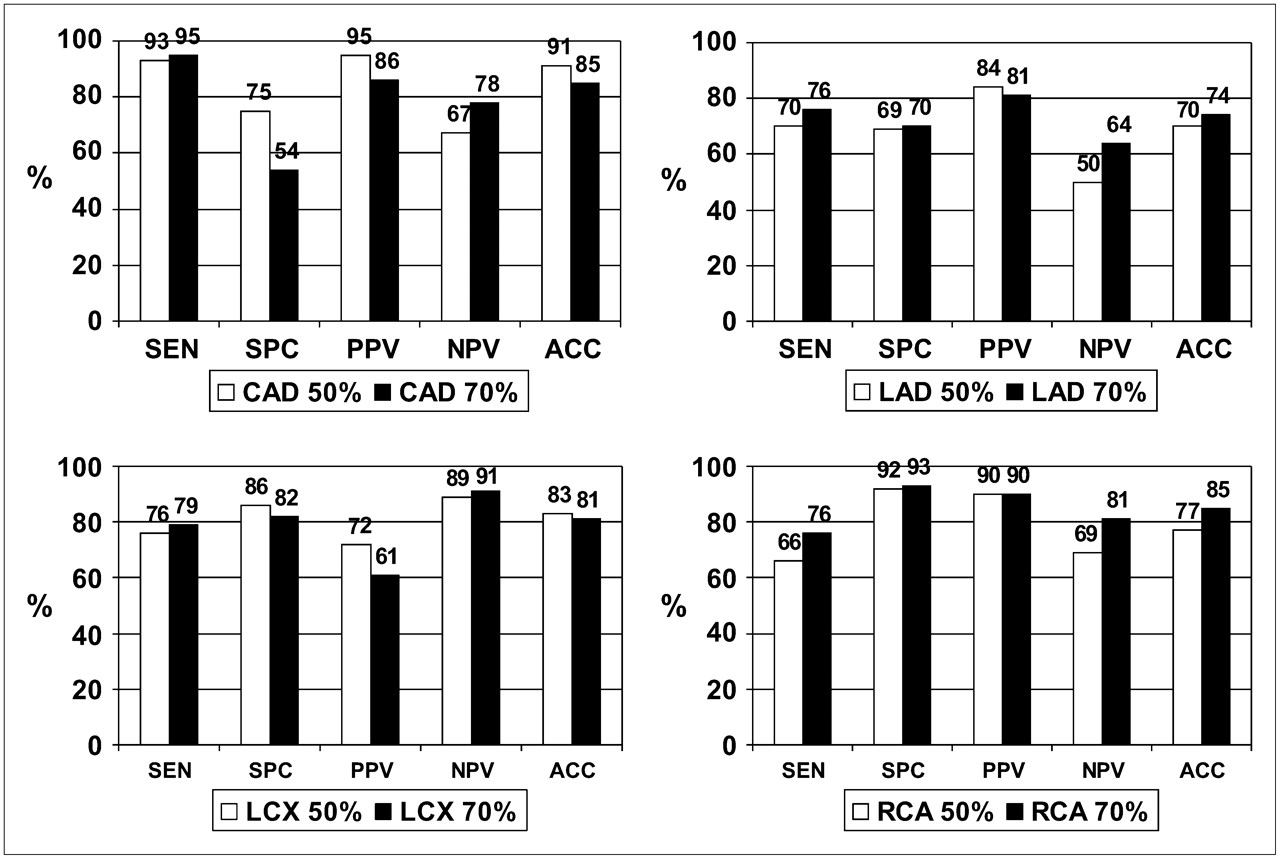
Performance of 82Rb PET/CT database in detection of global and individual vessel CAD using 50% (white bar) and 70% (black bar) stenosis as threshold for a significant disease. Quantitative criteria for abnormality reported in Table 1 were used to assess performance of the 82Rb PET/CT database. There was no statistically significant difference on performance of the 82Rb PET/CT database either for global CAD or for individual vessel CAD when 50% or 70% luminal stenosis was used as threshold for CAD. SEN = sensitivity; SPC = specificity; PPV = positive predictive value; NPV = negative predictive value; ACC = accuracy.
Sensitivity, specificity, PPV, NPV, and accuracy for the localization of individual diseased coronary arteries are shown in Figure 4. The results for detecting disease in the LAD were sensitivity, 70% (26/37); specificity, 69% (11/16); PPV, 84% (26/31); NPV, 50% (11/22); and accuracy, 70% (37/53). The results for detecting disease in the LCX were sensitivity, 76% (13/17); specificity, 86% (31/36); PPV, 72% (13/18); NPV, 89% (31/35); and accuracy, 83% (44/53). The results for detecting disease in the RCA were sensitivity, 66% (19/29); specificity, 92% (22/24); PPV, 95% (19/21); NPV, 69% (22/32); and accuracy, 77% (41/53).
Also, the performance of the 82Rb database was calculated using the threshold for CAD as diameter stenosis of ≥70%. The overall sensitivity for detection of CAD (≥70% stenosis) was 95% (38/40). The overall specificity for detection of the absence of CAD (<70% stenosis) was 54% (7/13) (Fig. 4). Also, the PPV for global CAD was 86% (38/44), the NPV was 78% (7/9) and the accuracy was 85% (45/53), as shown in Figure 4.
The sensitivity, specificity, PPV, NPV, and accuracy for the localization of individual diseased coronary arteries are shown in Figure 4. The results for detecting disease in the LAD were sensitivity, 76% (25/33); specificity, 70% (14/22); PPV, 81% (25/31); NPV, 64% (14/22; and accuracy, 74% (39/53). The results for detecting disease in the LCX were sensitivity, 79% (11/14); specificity, 82% (32/39); PPV, 61% (11/18); NPV, 91% (32/35); and accuracy, 81% (43/53). The results for detecting disease in the RCA were sensitivity, 76% (19/25); specificity, 93% (26/28); PPV, 90% (19/21); NPV, 81% (26/32); and accuracy, 85% (45/53).
Statistical analysis using a χ2 and 2 × 2 table shows that the differences in the performance of the database using the 50% or 70% threshold were not statistically significant (P > 0.05) for any of the parameters (sensitivity, specificity, PPV, NPV, accuracy).
DISCUSSION
This study was performed to develop and validate the stress normal limits and criteria for abnormality for quantitative rest–stress 82Rb PET/CT studies by use of a sex-independent normal database. Validation was performed with coronary arteriography as a gold standard to determine the accuracy of PET/CT quantitative analysis for the detection and localization of CAD.
Distribution of Normal Limits
A single sex-combined normal database and criteria for abnormality were developed and applied to all PET/CT studies. Other authors have had a similar experience using database quantification in AC myocardial perfusion SPECT studies (12,13). In contrast, with non-AC SPECT studies, various authors have reported statistically significant differences when normal left ventricular myocardial perfusion distributions in women are compared with normal distributions in men. (13,14).
The mean normal myocardial distribution generated from the population with <5% likelihood of CAD shows a homogeneous myocardial count distribution for the entire left ventricular myocardium for the rest and stress images with a reduction at the apex (∼86% uptake). This reduction can be related to the higher imaging performance using PET combined with apical thinning. This pattern of myocardial distribution is similar to the pattern generated by the sex-independent AC 99mTc-sestamibi SPECT (13). This finding suggests that with better imaging performance the normal morphology of the left ventricular myocardium is better delineated, showing a better anatomic picture in which the apex of the left ventricular myocardium is thinner than the left ventricular walls.
The greatest variability in the normal distribution was obtained for the base of the septum, which can be explained by the reduction of counts due to the membranous septum. The variability at the septum base had been reported earlier using the database quantification with multiple SPECT tracers (sestamibi, 201Tl, and tetrofosmin) (5–8,13).
Criteria for Abnormality and Prospective Validation
The extent of hypoperfusion criteria for abnormality established in this research (Table 1) match those of our previously developed criteria for the database quantification using SPECT radiotracers (sestamibi, 201Tl, tetrofosmin, and others) (5–8,13). The main difference with the previous database is in the SD used for the different segments of the myocardium (Fig. 3).
The application of the developed criteria to a prospective population with <5% likelihood of CAD shows a normalcy rate of 75% (18/24). The analysis per vascular territory shows higher values: LAD, 92%; LCX, 96%; and RCA, 100%. The reason for these differences is that most of these LLK patients had small perfusion defects (3% < LV extent < 10%), which did not fulfill the quantitative criteria for individual coronary arteries (LAD > 10%, LCX > 10%, RCA > 12%).
Comparison of the prospective quantitative results with coronary angiography for detection of global CAD shows a high sensitivity (93%) and PPV (95%) and a reasonable specificity (75%) and NPV (67%) with a high accuracy (91%) for the detection of stenosis ≥ 50%. A secondary analysis using 70% stenosis as the threshold for CAD shows the same trend of high sensitivity (95%) and PPV (86%). Nevertheless, there is a lower specificity for the detection of global CAD. These differences are not statistically significant either for global CAD or for individual vessel CAD.
The slight reduction in global specificity and normalcy rate reported in this study could be related to the misalignment between the emission and the transmission map. Manual alignment of emission and transmission maps had to be done in approximately 30% of the studies, as a reliable automatic program for realignment was not used in this study.
Importantly, it is expected that—like any other established diagnostic test—in the future the specificity of the PET/CT will artificially decrease because of physician referral bias. As the referring physicians' faith in the technique increases, only patients with abnormal myocardial perfusion will be sent for coronary angiography, making it difficult to find patients with normal coronary and normal myocardial perfusion.
The results of the quantitative analysis show a very high sensitivity and PPV for the detection and localization of CAD. The PET/CT database quantification results reported here compare favorably with the studies using 82Rb and PET in the literature (1,15–20), in which the sensitivity ranges from 83% to 95% and the specificity ranges from 82% to 100%. We were unable to find any prior publication using quantitative 82Rb database analysis with PET/CT. The summary of the literature (Table 2) shows that 946 patients have been studied using 82Rb. Most of these studies (844 patients) were acquired using attenuation maps with 68Ge ring sources, dipyridamole as a pharmacologic stressor, and stand-alone PET scanners (1,15–19). More recently, a study has been published using a hybrid scanner (PET/CT), as in the present research, but using dipyridamole, adenosine, and dobutamine as pharmacologic stressors (20). The present study was performed using adenosine for the pharmacologic challenge.
Summary of Previous Publications Using 82Rb and Stand-alone PET (Not Hybrid) or Hybrid PET/CT Scanners
Importantly, all false-negative patients for global CAD had single-vessel disease and were not patients with multivessel (2 or 3 vessels with stenosis ≥ 50%) CAD who were classified as normal. Nevertheless, the analysis per vascular territory in comparison with coronary angiography (50%) shows that 12 of the 17 patients with double-vessel CAD were classified as single-vessel CAD by ECTb. In the13 patients who had triple-vessel disease, 2 were classified as single-vessel CAD, 6 as double-vessel CAD, and only 5 as triple-vessel CAD. Therefore, this new 82Rb PET/CT database quantification approach has proven to be reliable for identifying patients with CAD but still has limitations in the assessment of the extension of CAD. Indeed, 14 of the 30 patients (47%) with multivessel CAD were classified as having single-vessel disease. This is a known limitation of database quantification in which the algorithm must normalize the perfusion distribution to the most normal myocardial segment, even when the segment is hypoperfused. It is expected that the clinical implementation of quantitative myocardial flow reserve measurements with 82Rb should overcome this limitation and increase the accuracy of detecting multivessel disease.
CONCLUSION
The quantitative 82Rb PET/CT database created and validated in this study is accurate for the detection and localization of CAD. Physicians should consider using the quantitative output of these algorithms as decision support tools to aid with image interpretation.
Acknowledgments
This work was funded in part by Bracco Diagnostics and by the National Institutes of Health, NHLBI grant K01 HL70422. Russell D. Folks and Ernest V. Garcia receive royalties from the sale of the Emory Cardiac Toolbox related to the research described in this article. The terms of this arrangement have been reviewed and approved by Emory University in accordance with it is conflict-of-interest practice.
Footnotes
-
COPYRIGHT © 2007 by the Society of Nuclear Medicine, Inc.
References
- Received for publication January 19, 2007.
- Accepted for publication April 17, 2007.


Jump to section
Related Articles
Cited By...
- Left Ventricular Strain from Myocardial Perfusion PET Imaging: Method Development and Comparison to 2-Dimensional Echocardiography
- Quantitative Clinical Nuclear Cardiology, Part 1: Established Applications
- Effect of Outflow Tract Contributions to 82Rb-PET Global Myocardial Blood Flow Computations
- Does Rubidium-82 PET Have Superior Accuracy to SPECT Perfusion Imaging for the Diagnosis of Obstructive Coronary Disease?: A Systematic Review and Meta-Analysis
- Comparison of Myocardial Perfusion 82Rb PET Performed with CT- and Transmission CT-Based Attenuation Correction
- Current issues in nuclear cardiology