


Abstract
Several studies have described nonuniform blurring of myocardial perfusion imaging (MPI) due to respiration. This article describes a technique for correcting the respiration effect and assesses its effectiveness in clinical studies. Methods: Simulated phantoms, physical phantoms, and patient scans were used in this study. A heart phantom, which oscillated back and forth, was used to simulate respiration. The motion was measured on a γ-camera supporting list-mode functionality synchronized with an external respiratory strap or resistor sensor. Eight clinical scans were performed using a 1-d 99mTc-sestamibi protocol while recording the respiratory signal. The list-mode capability along with the strap or sensor signals was used to generate respiratory bin projection sets. A segmentation process was used to detect the shift between the respiratory bins. This shift was further projected to the acquired projection images for correction of the respiratory motion. The process was applied to the phantom and patient studies, and the rate of success of the correction was assessed using the conventional bull's eye maps. Results: The algorithm provided a good correction for the phantom studies. The shift after the correction, measured by a fitted ellipsoid, was <1 mm in the axial direction. The average motion due to respiration in the clinical studies was 9.1 mm in the axial direction. The average shift between the respiratory phases was reduced to 0.5 mm after correction. The maximal change in the bull's eye map for the clinical scans after the correction was 6%, with a mean of 3.75%. The postcorrection clinical summed perfusion images were more uniform, consistent, and, for some patients, clinically significant when compared with the images before correction for respiration. Conclusion: Myocardial motion generated by respiration during MPI SPECT affects perfusion image quality and accuracy. Motion introduced by respiration can be corrected using the proposed method. The degree of correction depends on the patient respiratory pattern and can be of clinical significance in certain cases.
During cardiac SPECT, the myocardial wall is constantly moving relative to the scanner detectors. Patient motion, respiration, and myocardial contraction are among the major contributors to this motion. Acquired projections are therefore blurred, image resolution is decreased, and artifacts can be introduced. Each of these 3 sources of motion needs to be addressed according to its unique characteristics.
The reported range of myocardial respiration motion is between 4 and 18 mm in the cranial–caudal direction and has a much lower magnitude in the horizontal and vertical directions (1,2). Several articles have attempted to measure the respiration-related myocardial motion for several imaging modalities (1–10), including SPECT (9,11,12) and PET (13,14). In PET all projections are acquired simultaneously, whereas in SPECT they are acquired sequentially. Therefore, respiratory-gated SPECT acquisition may result in inconsistency between projections. Correction by comparison and correlation of projections may not be robust enough in low-count studies because of relatively noisy projections.
This article describes a novel technique for correcting perfusion image distortions stemming from respiration motion using a list-mode acquisition, which implies collection of the spatial and temporal information for each detected photon. The acquisition is synchronized with the respiratory signal measured using an elastic strap placed on the patient's torso, which is later used to generate the respiratory bins. 3-Dimensional (3D) motion is detected on the short-axis slices' domain and is used to correct the original projections. The proposed technique was validated in computer simulations and a physical moving phantom, and it was further applied to patient studies.
MATERIALS AND METHODS
This research included 4 stages: (i) development of the algorithm for correction of computer-simulated respiratory motion, (ii) acquisition of a moving physical phantom using the list-mode option, (iii) recording the respiratory signal of volunteers during a “blank” SPECT acquisition (i.e., without administration of radiopharmaceuticals), and (iv) acquisition of patient studies using the list-mode option synchronized with the respiratory strap sensor signal.
Binning List-Mode Data
The list-mode option was integrated into the Infinia γ-camera (GE Healthcare). The list data were rebinned retrospectively to generate projections. A respiratory elastic strap (BIOPAC Systems Inc.) was used to acquire the respiratory signal at a rate of 10 Hz. The amplitude of the respiratory signal changes as a function of the strap tightness. The amplitude of the digital signal is normalized to values from 0 to 500 corresponding to a range from no tension to maximal tension, respectively. Although the respiratory signal was written to a separate file and not embedded in the list file, the time written in both files has allowed retrospective synchronization. The respiratory signal histogram (Fig. 1) was generated using a 64-slot model, with the horizontal axis defining the respiration amplitude and the vertical axis depicting the percentage from the total acquisition time at the specific amplitude. The list data were then rebinned into 4 or 5 respiratory bins using the entire respiration signal. The number of respiratory bins was defined on the histograms shown in Figure 1 to generate bins with a sufficient number of counts while maximizing temporal resolution. A “hill” or “cluster” in the histogram designates a “bin” consisting of counts from the adjacent respiration phase (amplitude). The list file was subsequently retrospectively divided into respiratory bins according to the cluster selection on the histogram.

Respiratory signal histograms of 8 clinical studies (patient numbers designated on left side of each histogram). x-Axis represents strap tension amplitude (normalized from 0 to 500 units). y-Axis shows percentage (%) of total time in specified amplitude. Amplitude is lowest in end-expiration phase. Pattern of end-expiration dominates all other phases and is apparent in most patients. STR = stress; RST = rest.
Algorithm Description
Detection of the shifts between respiratory bins was performed in the short-axis domain and applied back to the projections' domain according to the following sequence of steps:
(a) A group of projections, defined as a set corresponding to a selected respiratory bin, is normalized along the angular dimension to ensure consistency between projections. This step is needed because of the nonuniform breathing pattern, which often causes most of the differences between projections (seen as flickering) and introduces the reconstruction distortion.
(b) The normalized group of projections is reconstructed using a filtered backprojection (FBP) algorithm (Butterworth; cutoff frequency, 0.4; power, 10) on the Xeleris workstation (GE Healthcare), yielding a set of transaxial slices.
(c) The transaxial slices are reformatted to generate the standard slices in the vertical, horizontal long, and short axis.
(d) The set of short-axis slices is segmented using a process that fits the 3D information to an ellipsoid (15). The code for the elliptical fit was extracted from the Myovation segmentation algorithm (GE Healthcare). A set of ellipsoids corresponding to each of the respiratory bins is obtained at the end of this process, with the vectors connecting the ellipsoids' centers defining the motion shift between the respiratory bins in the 3D space.
(e) With the first bin serving as a reference, vectors corresponding to the shifts between the respiratory bins are projected onto the transaxial frame of reference using the image position and orientation of the transaxial and short-axis slices. The vertical component of the transaxial vector is used to shift the projections vertically, whereas the horizontal component is used to shift the projections horizontally considering the rotation geometry of the detectors.
(f) Each projection is shifted in the horizontal and vertical directions using the information obtained. At this point, all bins are aligned and motion due to respiration is expected to be removed.
Computer Simulations
A preliminary evaluation of the algorithm was performed using a Cardiac Insert phantom (Data Spectrum Corp.), acquired using a matrix of 128 × 128, 60 projections, an angular range of 180°, and a pixel size of 4.42 mm. Projections were deliberately shifted in the axial direction. Two sets of 5 phases each were generated to simulate a 6 × 12 mm shift of the heart. This represents a “worst-case scenario” as there is no dominant phase and it therefore simulates maximal smearing of the heart due to axial motion. This step was used to validate the algorithm and to understand the resulting effect of motion on perfusion slices.
Physical Phantom Studies
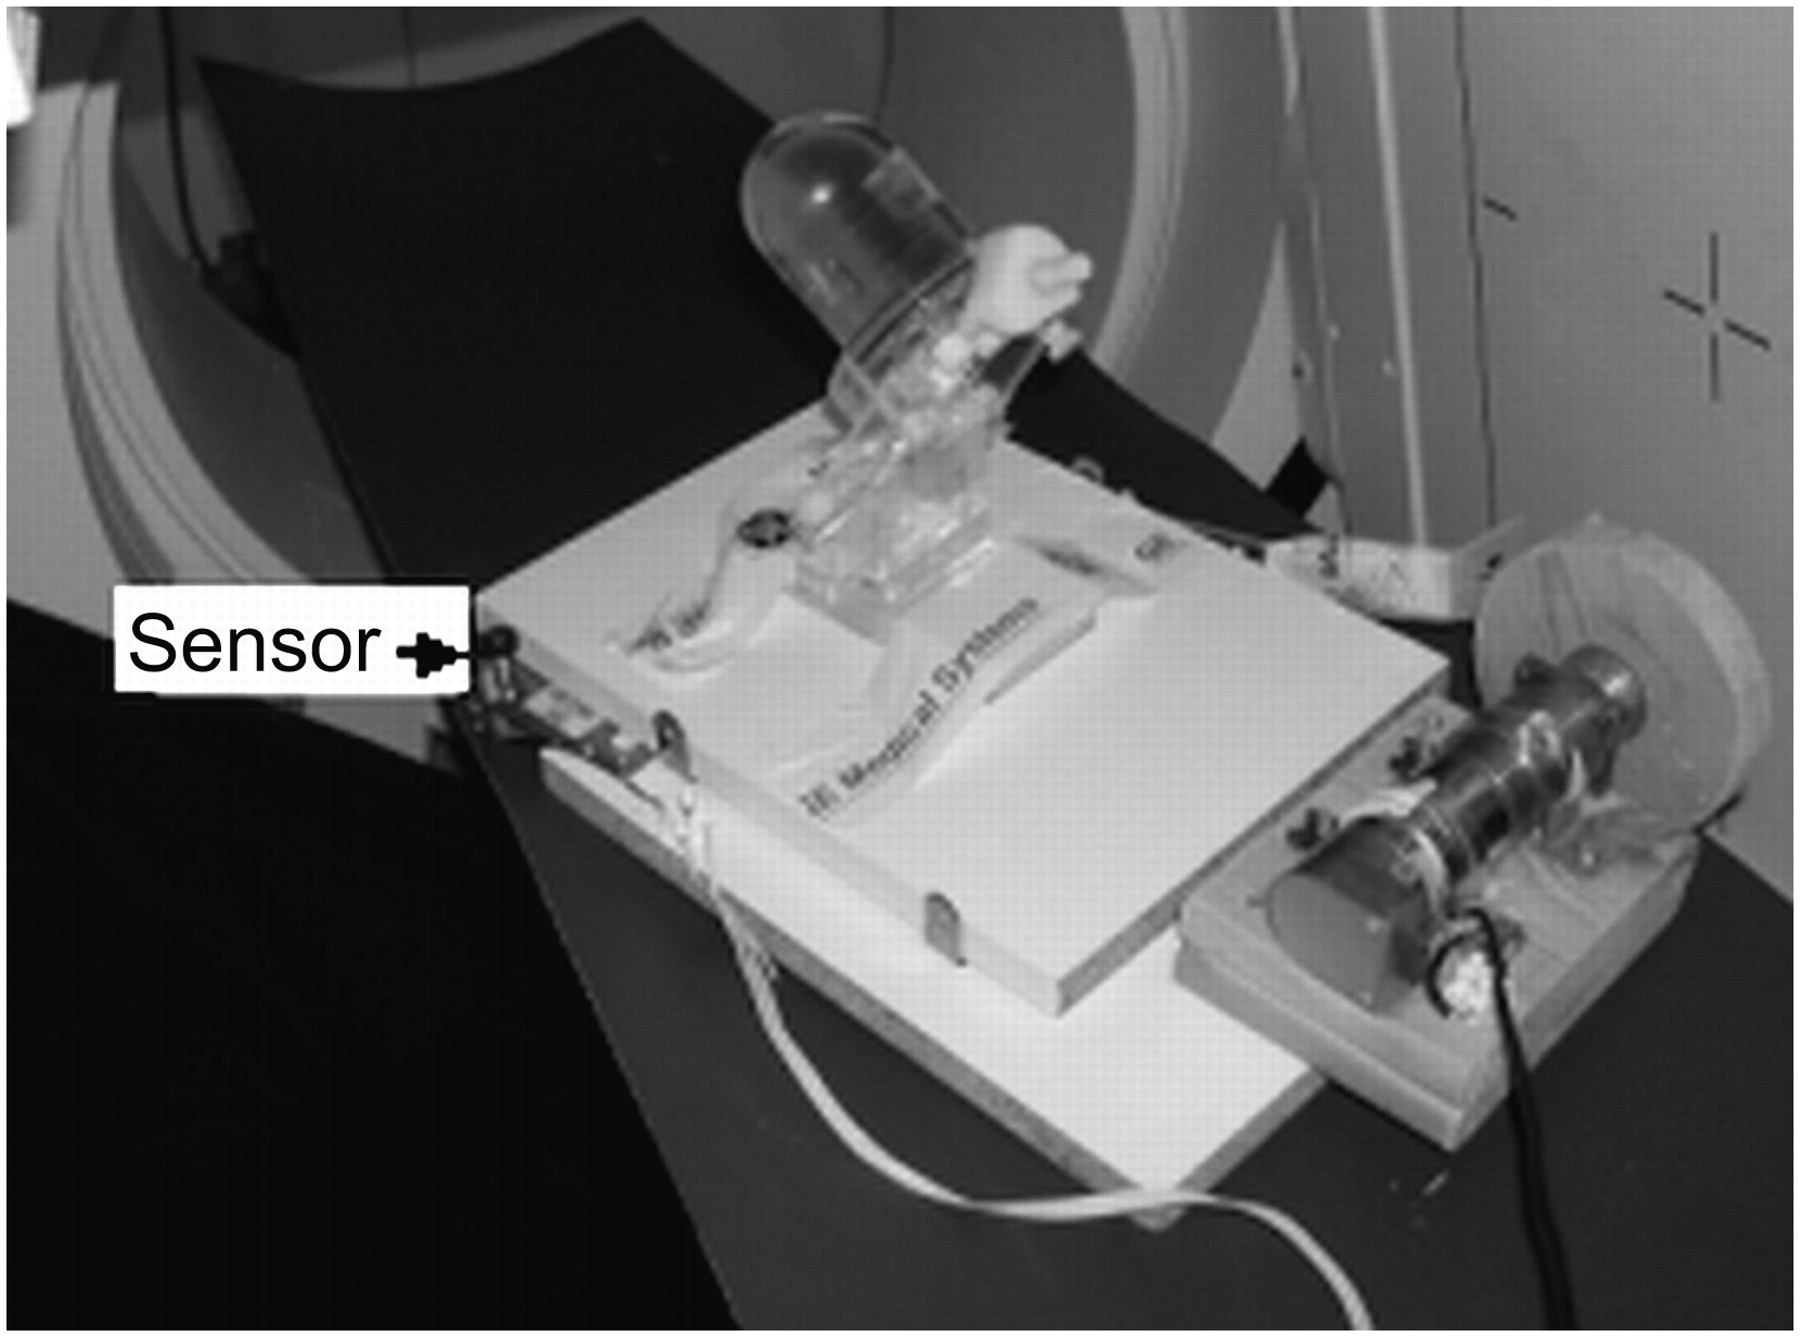
The correctness of the algorithm was further validated using physical phantom studies. The Cardiac Insert phantom was filled with 27.5 MBq of 99mTc to simulate a high-dose clinical cardiac SPECT acquisition protocol. The phantom was placed on a plate oscillating in a predefined range and speed (Fig. 2). The phantom was placed in an oblique orientation to simulate axial and horizontal shifts. A stationary phantom acquisition was initially obtained for reference; this was followed by acquisitions of 5-, 8-, and 18-mm motion shifts. Because the respiratory strap could not be placed around the oscillating phantom, a wheel-based resistor sensor was attached to the plate and was used to measure the oscillation signal (Fig. 2). The motion-correction algorithm described earlier was applied to correct for the artificial movement.

Cardiac Insert phantom on top of plate that was oscillated in predefined range and speed during SPECT acquisition.
Respiratory Signal Analysis in Humans
In contrast to phantom studies, which assume a repetitive oscillation pattern, the respiration pattern in humans is not uniform during the acquisition; this results in inconsistencies between projections. Therefore, algorithms that perform well on phantom studies may be unsuitable in the clinical setting. To better understand the respiration pattern, the respiration signal of 14 human volunteers was recorded while performing a “blank” SPECT protocol—that is, without prior administration of radiopharmaceuticals. Their respiratory signal pattern was further analyzed, including review of the signal per projection; monitoring the change in numbers of respiratory cycles per projection; calculating the average amplitude, histogram, and fluctuations between projections; and optimizing bin selection. After this preliminary analysis, the correction algorithm was optimized by applying projection normalization before reconstruction to handle nonuniform, fluctuating respiration patterns. This analysis provided the opportunity to train the technical staff before starting the clinical trial.
Clinical Acquisitions and Correction
Eight myocardial perfusion imaging (MPI) SPECT acquisitions were performed. A single-day rest–stress cardiac gated 99mTc-sestamibi protocol was performed on 1 male and 2 female patients. In addition, a stress cardiac gated study was performed on 2 male patients. The following parameters were used: 64 × 64 matrix, 60 projections, angular range of 180°, pixel size of 6.8 mm, 25 s per step for rest, and 20 s per step for stress. The injected dose was 370 MBq for rest and 740 MBq for stress studies. Although CT-based attenuation maps were acquired, they were not used in this study as the acquisition of the CT maps was neither cardiac nor respiratory gated. The respiratory signal was recorded using the respiratory strap, the signal histogram was created, and respiratory bins were generated as described earlier. The above algorithm was applied to remove respiration-related motion.
Evaluating Correction Success
To evaluate the effectiveness of the algorithm to detect and correct respiratory motion, the segmentation algorithm described earlier was used (15). The shift between the centers of the corrected bins' ellipsoids represented the accuracy of the correction. Theoretically, a perfect correction would result in no shift. However, the Poisson nature of the acquisition, scanner resolution, partial volume, or nonhomogeneous uptake would result in mild shifts of the ellipsoids' centers.
Measuring Correction Effect
To measure the effect of the respiratory motion correction, bull's eye maps were created from the sum of the phases of the original and that of the corrected short-axis slices. The bull's eye map was divided into a 20-segment model, and a score was set for each segment based on its average uptake relative to the maximal value in the bull's eye map (16). The difference between the segmental scores before and after correction was calculated. This comparison was performed for the computer simulations, physical phantom acquisitions, and clinical studies.
RESULTS
Phantom Studies: Motion Detection and Correction Success
Table 1 outlines the motion in the axial and in-plane directions detected by the correction algorithm after the addition of the artificial shift. The detected shift was 5.9 mm for the 6-mm and 12.0 mm for the 12-mm artificial shift. The detected shift for the 8-mm oblique shift was 4.4 mm in the x-axis and 5.3 mm in the axial direction. Using the basic Pythagoras' formula, the oblique shift was therefore 6.9 mm, comparable to the added 8-mm artificial shift. After the correction, there was no shift between the bins of the simulated scans (0.0 mm), implying a perfect correction. The shift between the bins of the 8-mm oblique scan after correction was 0.01 and 0.22 mm in the x- and z-directions, respectively, implying an excellent correction.
Axial and In-Plane Motion Detected Before and After Correction for Artificial Shift Addition*
Phantom Studies: Measuring Effect of Correction
The maximal and mean change in the 20-segment bull's eye maps of simulated and phantom acquisitions is outlined in Table 2. As expected, the maximal and mean change is greater for the 12-mm shift compared with the 6-mm shift. Note that in the 12-mm shift, the maximal change in percentage uptake is 10%, with a mean of 3.2%. When no prefilter was applied in the FBP reconstruction step, these values increased to 12% and 4.3%, respectively. For the physical phantom, which oscillated at a distance of 8 mm, the maximal change in uptake of the bull's eye maps was 4%, with a mean of 1.1%.
Maximal and Mean Change in 20-Segment Bull's Eye Maps of Simulated and Phantom Acquisitions
Patient Studies: Analyzing Respiratory Signal
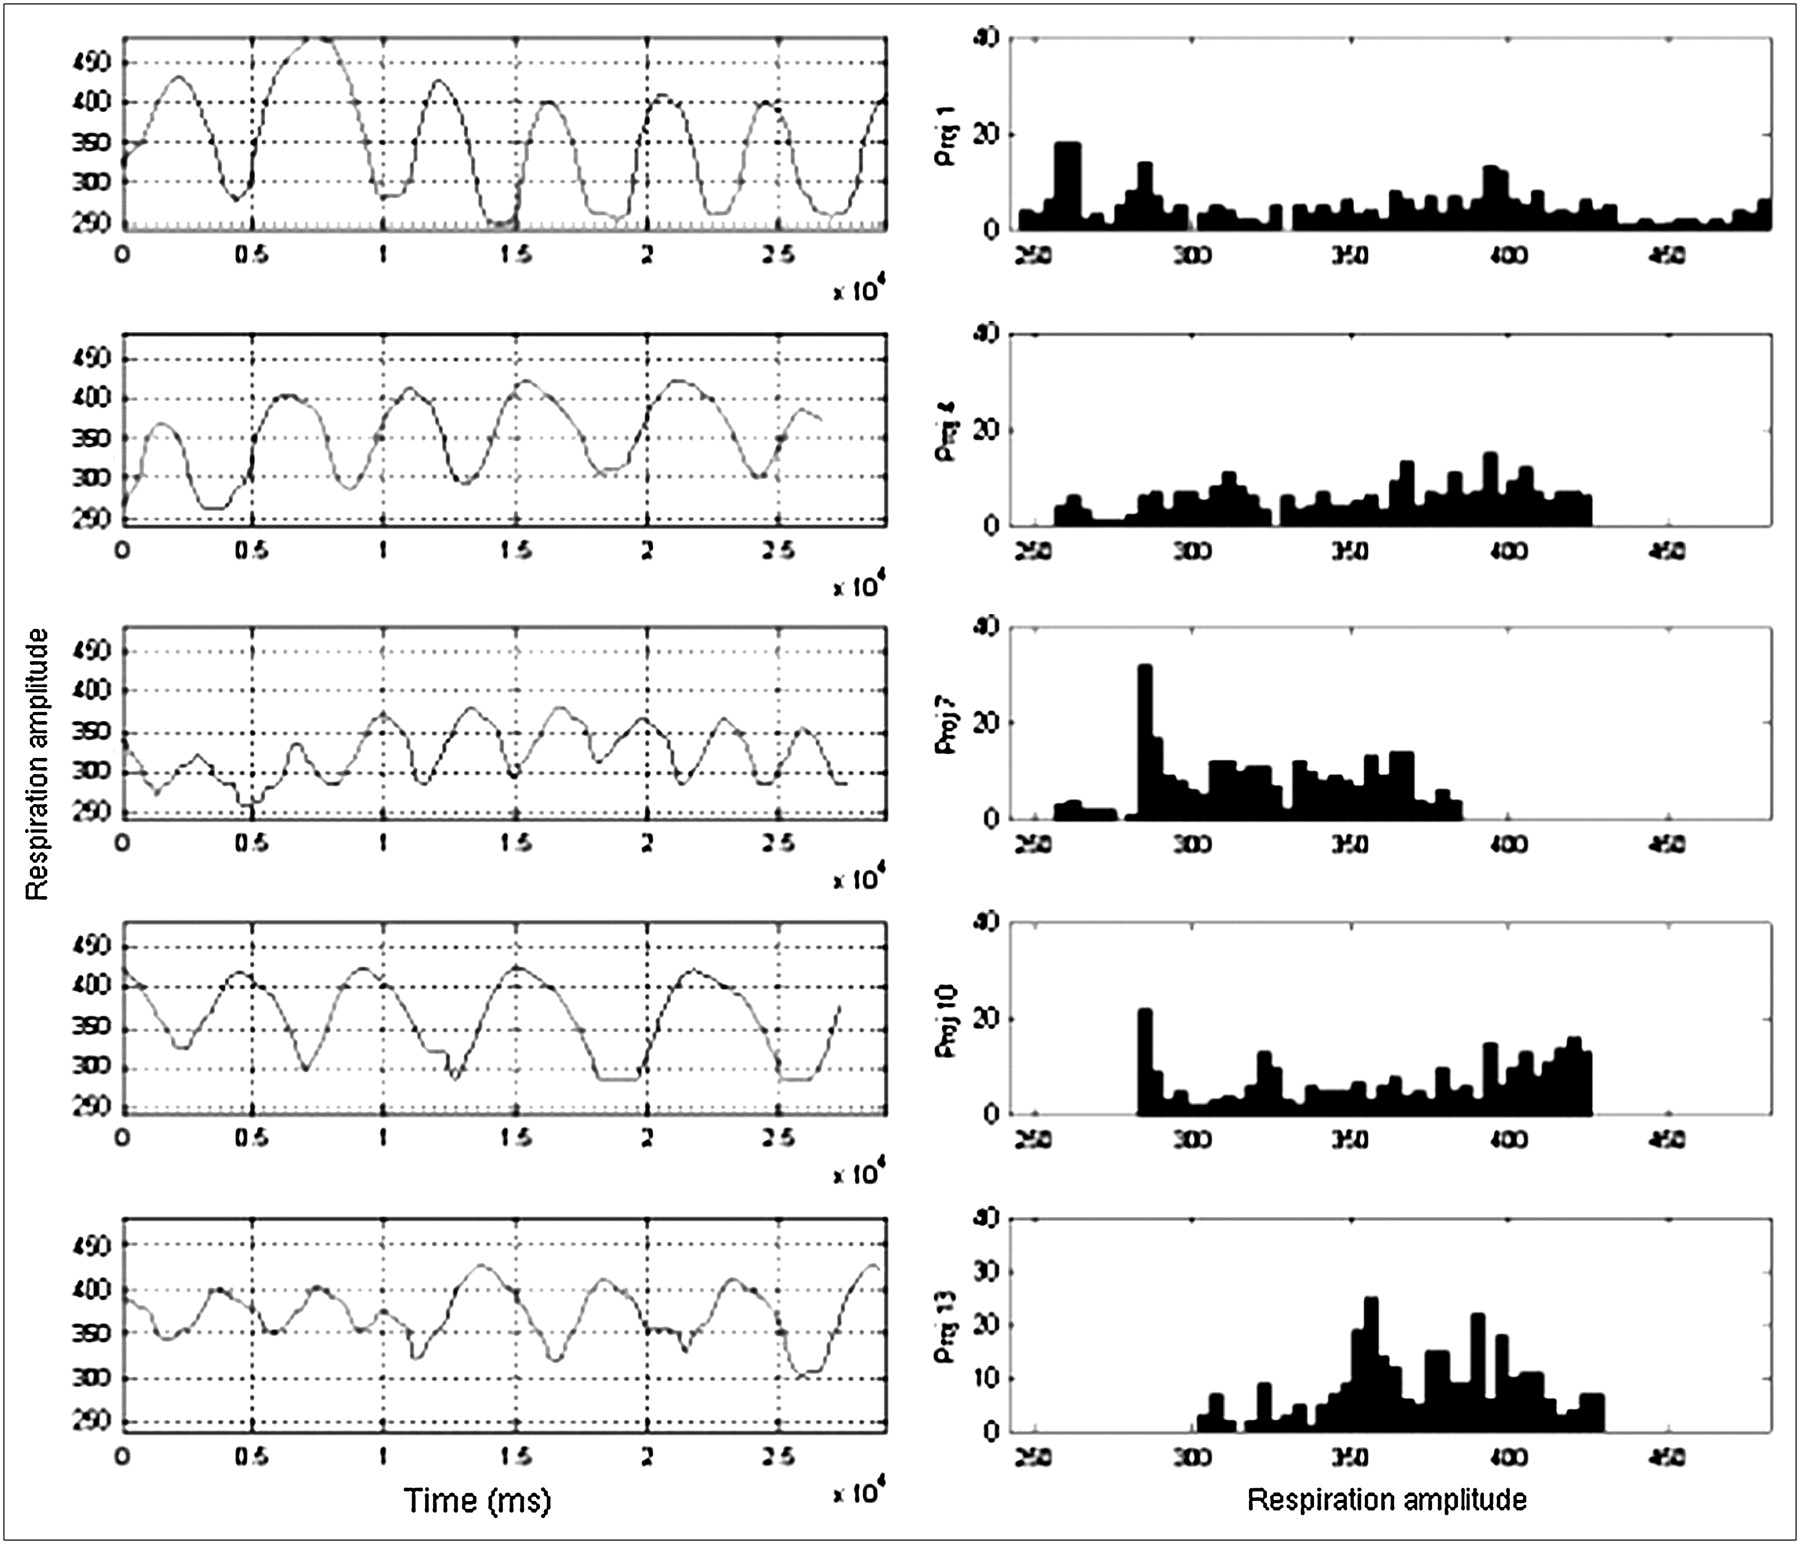
Figure 1 shows the respiratory signals' histograms, with the horizontal axis representing the amplitude of the strap and the vertical-axis showing the percentage of total time in the specified amplitude. Most patients depicted a pattern of dominant end-expiration phase. Figure 3 displays the respiratory signals and their corresponding histograms for a set of projections obtained for 1 patient. As can be noted, the respiration pattern changes drastically, leading to an inconsistency between projections.

Respiratory signals (left) and histograms (right) of projections (Proj) 1, 4, 7, 10, and 13 (sorted top to bottom). Histogram is generated by using respiration signal per projection. Note how respiratory signal pattern changes between projections and its effect on histogram.
Patient Studies: Measuring Motion Detection and Correction Success
Table 3 outlines the motion in the axial and in-plane direction detected by the algorithm before correction. The axial shift (average, 9.1 mm) is higher compared with the in-plane shifts (x-direction, 1.8 mm; y-direction, 2.3 mm). The average postcorrection axial shift was 0.5 mm and the average in-plane shifts were 1.0 and 1.4 mm in the x- and y-directions, respectively. The axial shift is greatly reduced, whereas the in-plane shifts remained in the same order of magnitude. The 3D shape resulting from the endocardium segmentation of the end-expiration and the end-inspiration phase in 1 patient is shown in Figures 4A and 4B, demonstrating the shift between these phases in the axial direction. The shift between the phases is no longer apparent after correction.
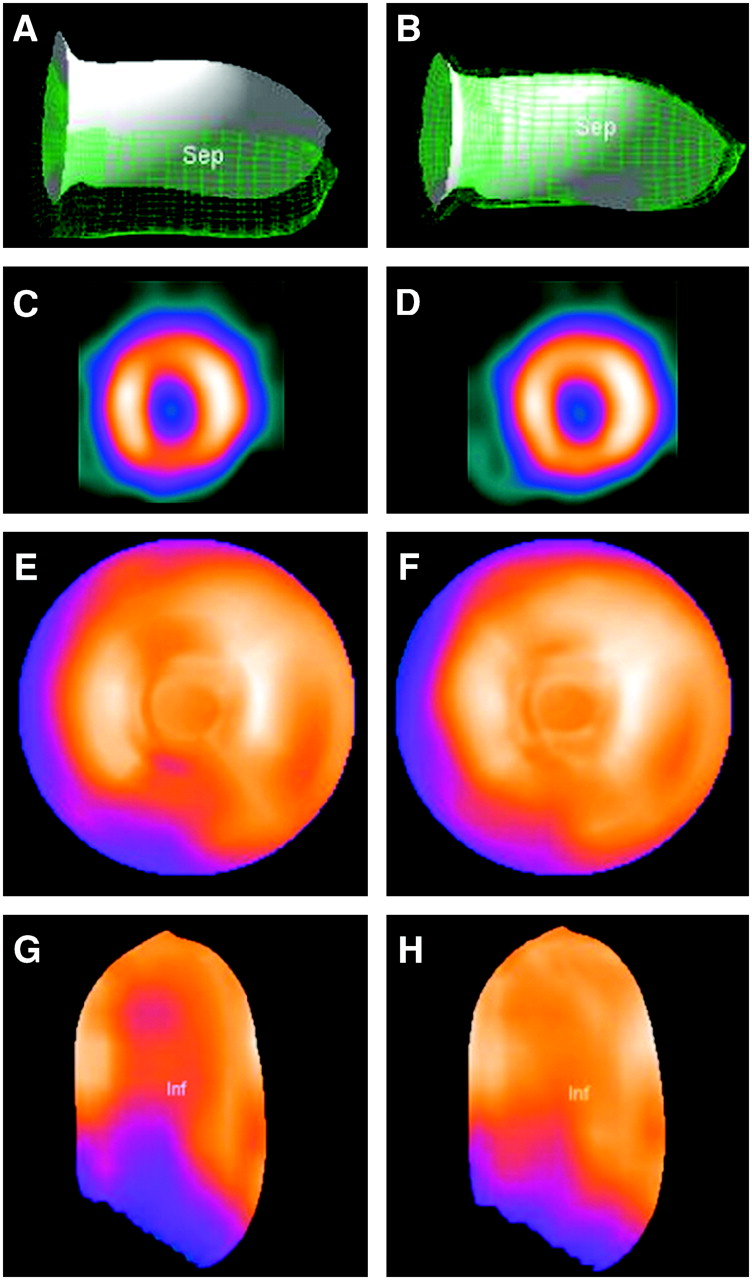
Left and right columns show clinical study before and after correction, respectively. (A and B) 3D representations of endocardium of phases 1 (end-expiration, in opaque) and 5 (end-inspiration, meshed grid). (A) Motion in axial direction before correction. (B) Removed axial motion after correction. (C and D) Mid-myocardium short-axis slices before (C) and after (D) correction. Corrected slice (D) is more uniform and free from cranial–caudal motion artifact pattern shown in uncorrected slice (C). (E and F) Bull's eye map before (E) and after (F) correction for motion due to respiration. Motion artifact due to the cranial–caudal shift is removed. (G and H) 3D representation of inferior wall uptake before (G) and after (H) correction for motion due to respiration. Sep = septal wall; Inf = inferior wall.
Axial and In-Plane Motion Detected Before and After Correction for Respiration Motion*
Patient Studies: Measuring Effect of Correction
The maximal and mean change in the 20-segment bull's eye maps before and after correction for each patient is outlined in Table 4. The maximal percentage change was 6%, with an average of 3.75%. An example of short-axis perfusion pair of slices before and after correction along with the bull's eye maps and 3D shape are shown in Figures 4C–4H, demonstrating that the inferior and anterior wall reduction in uptake is mostly recovered after correction.
Maximal* and †Mean Changes in 20-Segment Bull's Eye Maps in Each Patient
DISCUSSION
Respiration is one of the sources for myocardial motion during MPI SPECT. During respiration, the myocardium motion is mainly in the axial direction and, to a lesser degree, in the lateral direction (in-plane). Previous research has shown that the magnitude of the axial shift ranges from 4 mm to 18 mm (1,2). The aim of the current study was to propose a novel technique for correcting respiratory motion, to validate it in phantom studies, and to evaluate the effect of the correction on clinical MPI SPECT studies. As seen in Table 1, the corrections of phantom shifts showed excellent results with the algorithm.
In the corresponding bull's eye maps of the simulated motion phantom, the maximal change between segments was 3% for the 6-mm shift and 10% for the 12-mm shift. It should be emphasized that this represents the worst-case scenario as the change is abrupt and leads to maximal discrepancy between the respiratory phases. In the clinical setting, the phases are blurred due to limited number of respiratory bins used and a low-count density. Increasing the number of bins is not expected to improve the outcome as rebinned projections will be low in counts and extremely difficult to correct.
In the clinical studies (Tables 3 and 4; Fig. 4), the range of myocardial shift due to respiration ranged from 4 to 13 mm in the axial direction, similar to previously reported values (1,2). Before correction, the maximal and mean shifts were of 13 and 9 mm, respectively; these values decreased to 2.0 and 0.5 mm after correction. This clearly demonstrates the effectiveness of the suggested method of correction to remove the axial shift (Figs. 4A and 4B). When comparing the bull's eye maps of the clinical studies before and after correction, the maximal change for a segment was 6%, with a mean of 3.75% for all examinations. MPI SPECT slices after correction were visually more uniform compared with slices before correction.
Although FBP reconstruction was applied without attenuation or scatter correction, the changes in bull's eye maps were of clinical significance in some of the patients (Figs. 4C–4H), mainly with respect to the anterior and inferior segments, which showed the main changes after correction. The improvement in the corrected perfusion bull's eye is not as drastic as one might expect; this may be explained by several factors. First, reviewing the worst-case simulated phantom scenario, the maximal change in the bull's eye map due to the 12-mm axial motion is 10%. The clinical motion detected in this study is on average 9 mm; thus, the expected impact of motion on the bull's eye map is <10%. This is in agreement with the study of Segars et al. (6), which also described a small effect on a 10-mm shift on the perfusion image. Second, low-pass filters applied in the reconstruction phase smooth the resulting transaxial slices. Therefore, correction of relatively small motion, such as that related to respiration, is not fully manifested due to the filtering process. If filtering is omitted from the reconstruction phase, the effect of the respiratory motion correction is augmented (Table 2). Third, reviewing the respiratory signal histogram (Fig. 1), the end-expiration phase usually dominates, leaving “less” counts to correct—thus, reducing the effect of correction. Fourth, as reported in previous studies (1,6), the myocardial motion during respiration has an additional rotational component, which—though less important than the translation component—if corrected, may improve the overall effect of the correction.
In addition to its use for MPI SPECT, this correction technique may be extended to other clinical SPECT applications—for example, liver and lung scintigraphy—where respiration may affect image quality and accuracy.
CONCLUSION
Myocardial motion generated by respiration during MPI SPECT affects the perfusion image quality and accuracy. Motion induced by respiration can be corrected using image-processing techniques. The effect of correction depends on the patient respiratory pattern and may be clinically significant. The technique reported in this study successfully corrected respiratory motion in both phantom and clinical studies. Further studies will have to demonstrate whether it can further improve diagnosis accuracy and confidence in the clinical setting.
Acknowledgments
We thank Mr. Aharon Peretz and Mr. Eyal Shai from GE HealthCare, Haifa, Israel, for the support and insights in this research.
Footnotes
-
COPYRIGHT © 2007 by the Society of Nuclear Medicine, Inc.
References
- Received for publication October 30, 2006.
- Accepted for publication January 20, 2007.


