


Abstract
Medullary thyroid carcinoma (MTC) is a rare endocrine tumor arising from the C-cells of the thyroid gland. Calcitonin is the principal serum tumor marker. A rising calcitonin level after total thyroidectomy for localized disease generally indicates residual, recurrent, or metastatic disease. The role of 18F-FDG PET in MTC remains somewhat unclear. We reviewed our own experience with 18F-FDG PET in postthyroidectomy MTC patients with elevated calcitonin. Methods: From our database, we identified patients with suspected residual, recurrent, or metastatic MTC and elevated calcitonin who had been referred for 18F-FDG PET between January 2000 and October 2005. 18F-FDG PET findings were classified as positive or negative on the basis of visual interpretation of the scan. Standardized uptake values (SUVs) were also calculated. The 18F-FDG PET findings were verified by histopathologic examination, when available, or other imaging studies and clinical follow-up. Any negative 18F-FDG PET result was considered false-negative. Results: Twenty-eight patients underwent a total of 38 18F-FDG PET studies. Calcitonin levels ranged from 106 to 541,000 pg/mL (median, 7,260 pg/mL). There were 23 true-positive, 1 false-positive, and 14 false-negative 18F-FDG PET scans, yielding an overall sensitivity of 62%. There was no true-positive finding when calcitonin levels were below 509 pg/mL (n = 5). Using an arbitrary cutoff of 1,000 pg/mL, we found that the sensitivity in scans with calcitonin levels greater than 1,000 pg/mL increased to 78% (21/27; 95% confidence interval, 58%–91%). The mean SUV of all lesions with 18F-FDG uptake was 5.3 ± 3.2 (range, 2.0–15.9). Among the 14 patients with false-negative 18F-FDG PET findings, 8 had concurrent anatomic imaging studies and only 2 of these had positive findings. Conclusion: 18F-FDG PET can detect residual, recurrent, or metastatic MTC with a reasonable sensitivity of 78% when the calcitonin level is above 1,000 pg/mL but appears of limited use if the calcitonin level is below 500 pg/mL.
Medullary thyroid carcinoma (MTC) is a rare neuroendocrine malignancy arising from calcitonin-secreting parafollicular cells in the thyroid gland. It accounts for about 3%–10% of all thyroid neoplasms (1). MTC may occur in sporadic (75%) or familial (25%) forms that include multiple endocrine neoplasia types IIA and IIB and isolated familial MTC (2,3). At the time of initial diagnosis, up to 35% of patients have cervical and mediastinal lymph node metastases (4). Surgery remains the primary and only effective mode of treatment (5). Postsurgically, serum calcitonin is often used as a tumor marker whereby elevated calcitonin levels suggest residual, recurrent, or metastatic disease (3,6–8). Ultrasound, CT, and MRI provide structural but no functional information. Conventional nuclear medicine studies with 99mTc (V) dimercaptosuccinic acid, 99mTc-sestamibi, 111In-pentetreotide, and 131I-meta-iodobenzylguanidine have variable and often limited sensitivity (9–12). The advent of 18F-FDG PET added another imaging tool in the detection of recurrent MTC. Recent reports in the literature have presented a wide spectrum of results, but most studies have been limited by small sample sizes and a paucity of direct calcitonin correlations (13–19). For instance, Szakall et al. (16) reported a lesion identification rate of up to 95% in a study of 40 patients, and de Groot et al. (17) reported a sensitivity of 41% in a study of 26 patients. We therefore set out to investigate the diagnostic accuracy of 18F-FDG PET in MTC patients with elevated calcitonin after thyroidectomy in our own patient population and to determine whether the likelihood of disease detection on 18F-FDG PET is related to calcitonin levels.
MATERIALS AND METHODS
Patients
From our database, we retrospectively identified all 18F-FDG PET studies performed on patients with MTC from January 2000 to October 2005. During that time, eighty-seven 18F-FDG PET studies were performed on 44 patients with MTC for various clinical indications, including pre- and postoperative staging, localization of recurrent or metastatic disease in patients with elevated calcitonin, and monitoring of therapy response. All patients were referred for 18F-FDG PET at the discretion of the treating surgeon or endocrinologist.
We limited our study to individuals with the following inclusion criteria: total thyroidectomy, elevated calcitonin levels, and clinical referral for an 18F-FDG PET scan for the detection of residual, recurrent, or metastatic disease. Serial follow-up scans were included when there was an increase in calcitonin level by at least 20% and the prior study was negative or when the prior study was positive but the patient had undergone surgical resection of disease sites in the interim and the calcitonin level did not normalize. Each serial scan thus reflects a snapshot of a patient in time that is different from the previous scan and can stand on its own as a diagnostic test (20).
The laboratory tests for measurement of calcitonin and its reference range have changed over the past 10 y. Depending on the test used, the upper limit of the reference range in our institution has been 50 pg/mL (n = 32), 150 pg/mL (n = 1), 4 pg/mL (n = 1), or 11.6 pg/mL (n = 4). The calcitonin doubling time was calculated using the formula log2 × dT/(logB − logA), where A is the initial and B the final calcitonin measurement and dT is the time difference between the calendar dates of the 2 calcitonin measurements.
Concurrent available ultrasound, CT, MRI, and somatostatin receptor scintigraphy reports within 3 mo of the time of the 18F-FDG PET study were also retrieved and catalogued.
Data collection and analysis were approved by the Institutional Review Board. Patient consent was not required for this retrospective study.
Image Acquisition
PET.
All patients were imaged using a standard clinical 18F-FDG PET protocol: 555 MBq (15 mCi) of 18F-FDG were injected intravenously. Images were acquired from the skull base to the upper thighs at a minimum of 45 min after 18F-FDG injection. Between 2000 and November 2001, all scans were done using an Advance PET tomograph (GE Healthcare). Emission and transmission images were both acquired for 4 min per bed position. Transmission data were used for attenuation correction in all cases. After November 2001, scans were also acquired on combined PET/CT tomographs, either Biograph (Siemens/CTI) or Discovery LS (GE Healthcare). Both machines combine multislice CT with a state-of-the-art PET tomograph. The CT data were used for attenuation correction and anatomic localization (21,22).
Other Imaging Studies.
Somatostatin receptor scintigraphy was performed on 5 patients. Using a standard clinical γ-camera (ADAC/Phillips), planar images of the torso were acquired in anterior and posterior projections at 4 and 24 h after intravenous administration of 185 MBq (5.0 mCi) of 111In-pentetreotide. SPECT views of the abdomen and chest were also obtained at the respective times.
Structural imaging was performed with standard protocols. CT images were acquired on multislice helical scanners (GE Healthcare) after intravenous injection of contrast material and reconstructed for clinical review at a slice thickness of 2.5 mm. In some patients, CT images of only the neck were available, whereas in other patients, CT images of the chest, abdomen, and pelvis were available. MRI studies of the neck or torso were acquired on a 1.5-T whole-body MRI scanner (Signa; GE Healthcare), using sequences deemed appropriate by the radiologists for the clinical examination.
Image Interpretation
All 18F-FDG PET scans were reviewed independently by one of the investigators, who was unaware of other imaging findings, clinical findings, or patient outcome at the time of the review. Findings were catalogued as normal or abnormal and were then cross-referenced against the original official report. In cases of disagreement between the independent investigator and the original report, the images were reviewed by a second investigator, and a consensus was reached. In all cases, attenuation-corrected images were reviewed on a workstation displaying 3 orthogonal planes (transaxial, coronal, and sagittal) and a maximum-intensity-projection image. 18F-FDG uptake was considered abnormal when it was outside normal anatomic structures and was of an intensity greater than background blood-pool activity or adjacent normal tissue. In addition, standardized uptake values (SUVs) were measured for these lesions. For this purpose, regions of interest were drawn around 18F-FDG–avid lesions, and the highest SUV was calculated using the formula SUVbw = Q × W/Qinj, where SUVbw is SUV normalized to body weight, Q is activity in the lesion in mCi/mL, Qinj is the injected activity in millicuries, and W is the patient's body weight in grams.
For all other imaging studies, the official clinical reports from CT, MRI, and somatostatin receptor scintigraphy studies, generated by staff radiologists at this institution, were used. Only imaging studies obtained within 3 mo before or after 18F-FDG PET were considered.
Data Analysis
18F-FDG PET images were interpreted in a binary fashion as either normal/probably normal or abnormal/probably abnormal. Imaging findings were classified as true-positive for local recurrence or metastasis if confirmed by either of the following 2 criteria: first, positive histopathology results from biopsies or resections or, second, the presence of a detectable lesion at the corresponding site on conventional imaging studies or an increase in lesion size on follow-up imaging. Imaging findings were classified as false-positive if apparent abnormalities were not confirmed by either of these 2 criteria. Because all patients presented with elevated calcitonin, any imaging study not showing a clear abnormality was classified as false-negative.
Statistical Analysis
We used the sample proportion of true-positive 18F-FDG PET scans to compute the sensitivity at various thresholds of calcitonin. Confidence intervals were computed using an adjustment for the fact that some patients contributed more than one scan to the study (20). Differences in calcitonin and calcitonin doubling time between 18F-FDG–positive scans and 18F-FDG–negative scans were calculated using the Wilcoxon test. A possible relationship between calcitonin doubling time and SUV was investigated using standard regression analysis. A P value of less than 0.05 was considered significant. Kaplan–Meier survival curves were generated to investigate the potential relationship between 18F-FDG PET findings and overall survival as well as disease-specific survival.
RESULTS
Thirty-eight 18F-FDG PET scans from 28 patients (18 men and 10 women; mean age, 59 ± 12 y) met the inclusion criteria. Calcitonin levels ranged from 106 to 541,000 pg/mL (median, 7,260 pg/mL). The interval between the 18F-FDG PET scan and the calcitonin measurement was less than 1 mo for 29 scans; 1–2 mo for 6 scans, and 2–3 mo for 3 scans. No patient received therapy in the interim between the 18F-FDG PET scan and the calcitonin measurement.
Among the 38 scans meeting the inclusion criteria, 10 scans (6 true-positive and 4 false-negative) from 6 patients represented follow-up scans. The median interval between these serial scans was 9.5 mo (range, 3–14 mo).
We excluded 6 preoperative scans, 14 scans without corresponding calcitonin measurements, 4 scans from patients with normal calcitonin levels, and 15 repetitive scans done within chemotherapy trials. We also excluded 10 follow-up scans with stable findings on 18F-FDG PET and less than a 20% increase in calcitonin between scans because repetitive inclusion of the same patient with no change in clinical or imaging findings would only bias the statistical analysis without adding any meaningful information.
18F-FDG PET Sensitivity and Relationship with Tumor Markers
There were 24 positive 18F-FDG PET scans, of which 23 were deemed true-positive. Fourteen of these 23 scans had histologic confirmation. Of the remaining 9 scans deemed true-positive, 8 had corresponding positive findings on other imaging modalities whereas in the last scan there was clear clinical evidence of disease (widespread progressive disease had developed in this patient during follow-up). The mean SUV of all lesions showing 18F-FDG uptake was 5.3 ± 3.2 (range, 2.0–15.9; Table 1). The mean SUV of the lesion with the most intense 18F-FDG uptake in each scan was 5.4 ± 3.5 (range, 2.7–15.9). An example of a true-positive 18F-FDG PET scan from a patient with histologically proven mediastinal lymph node metastasis is shown in Figure 1.
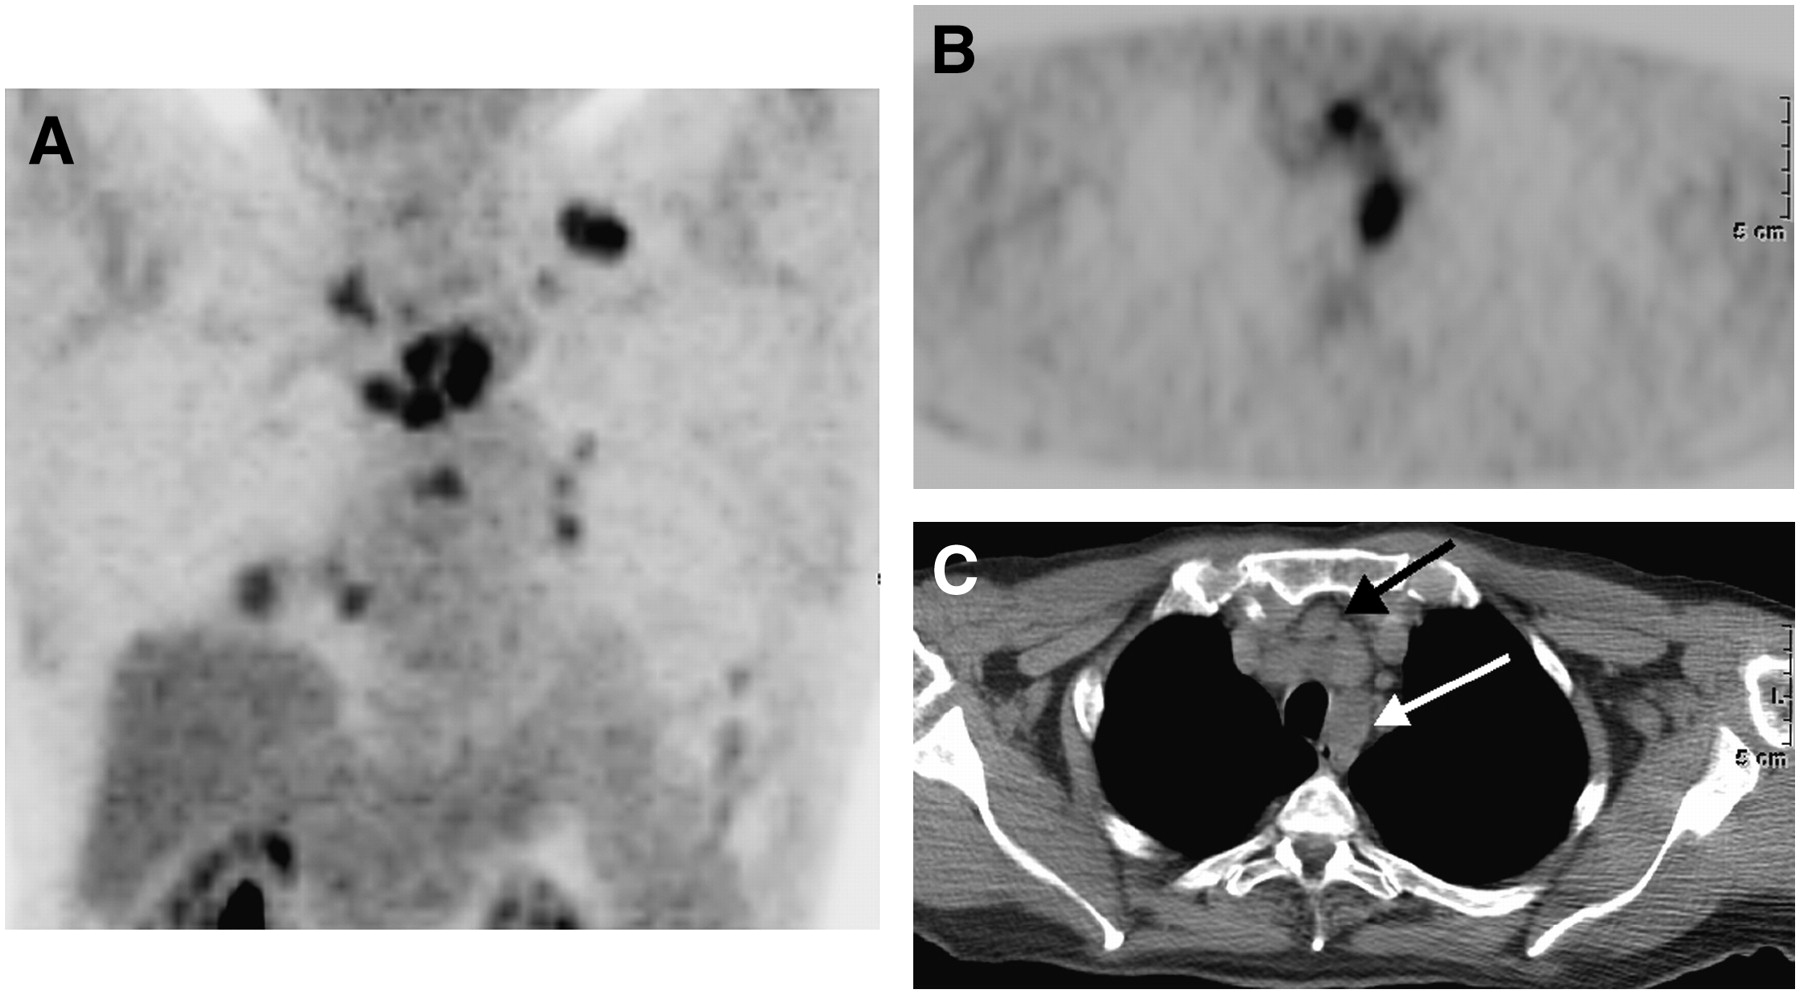
Maximum-intensity-projection (A), transaxial PET (B), and transaxial CT (C) images of 67-y-old man with calcitonin level of 119,000 pg/mL. Maximum-intensity projection shows multiple foci of 18F-FDG uptake in neck, mediastinum, and lungs. 18F-FDG PET and CT show metastatic mediastinal lymph nodes (arrows).
Patient Characteristics
One positive study was considered false-positive for MTC, because biopsy of a hypermetabolic lesion in the liver revealed a second primary: hepatocellular carcinoma.
In fourteen 18F-FDG PET scans, no abnormal FDG uptake was identified, and these were therefore classified as false-negative because all patients had elevated calcitonin levels.
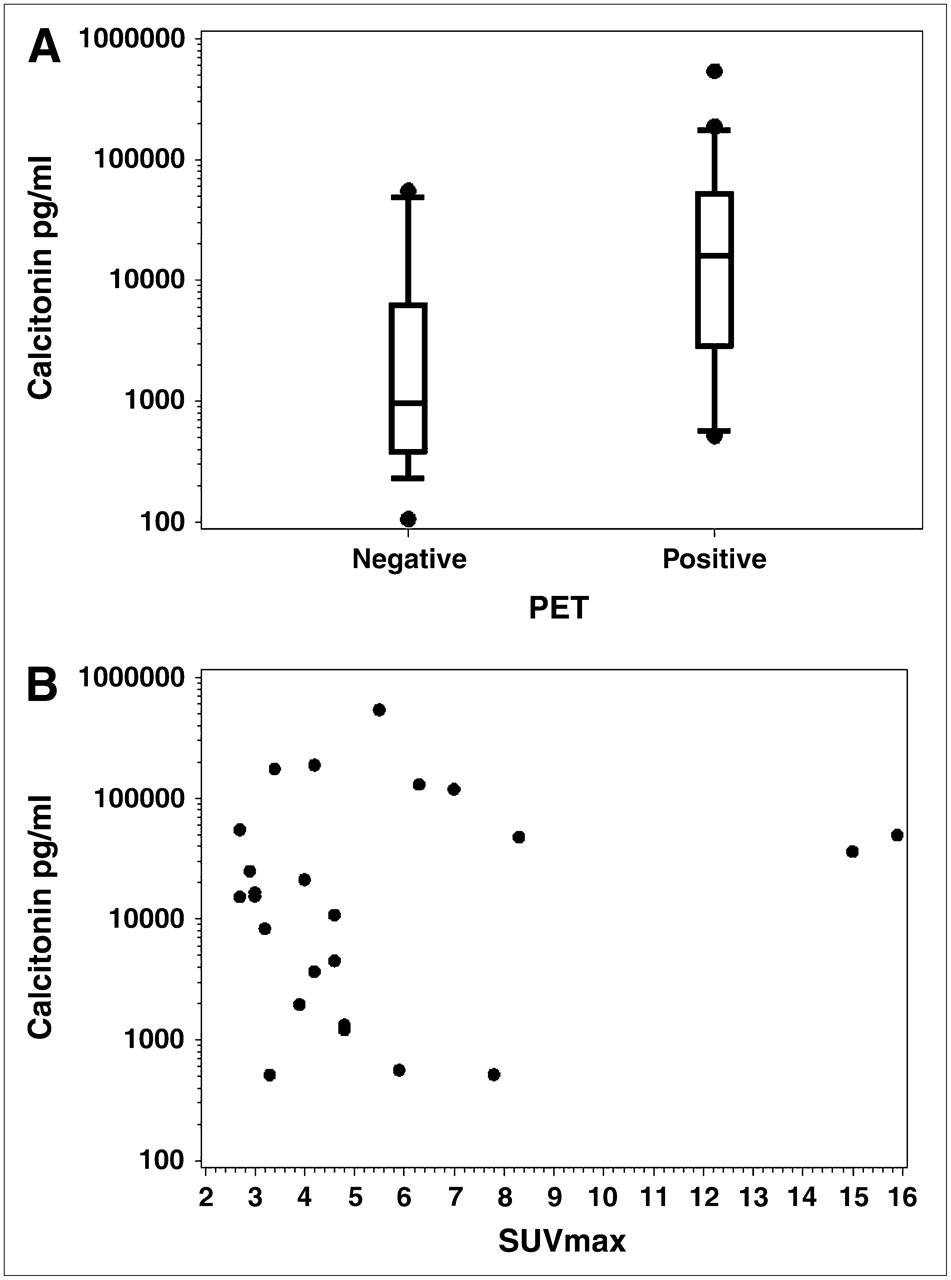
Overall, the sensitivity of 18F-FDG PET was 62% (23/37; 95% confidence interval, 45%–78%). Further analysis of the data showed that no scans were positive when the calcitonin level was below 510 pg/mL (n = 5). Using an arbitrary cutoff of 1,000 pg/mL, we found a sensitivity of 20% (2/10; 95% confidence interval, 2%–55%) for all patients with a calcitonin level of 1,000 pg/mL or less. Conversely, the sensitivity was 78% (21/27; 95% confidence interval, 58%–91%) in patients with calcitonin levels greater than 1,000 pg/mL. Figure 2 shows the distribution of 18F-FDG PET findings in relation to calcitonin levels. The lowest calcitonin level in a patient with positive 18F-FDG PET findings was 514 pg/mL. The highest calcitonin level for a patient with negative 18F-FDG PET findings was 55,200 pg/mL. In true-positive 18F-FDG PET scans, the median calcitonin level was 16,600 pg/mL (range, 514–541,000 pg/mL), and the mean was 63,939 ± 118,258 pg/mL. In the false-negative 18F-FDG PET scans, the median calcitonin level was 962 pg/mL (range, 106–55,200 pg/mL), and the mean was 11,257 ± 19,743 pg/mL (P = 0.07, vs. 18F-FDG PET–positive scans).

Distribution of 18F-FDG PET findings in relation to calcitonin levels. (A) Box plot shows range of calcitonin levels in 18F-FDG PET–positive vs. 18F-FDG PET–negative scans. (B) Scattergram shows distribution of highest SUV per study in relation to calcitonin levels.
The calcitonin doubling time could be calculated for 22 scans (12 true-positives, 9 false-negatives, and 1 false-positive). The median doubling time was 6.9 mo, with a range of 1.8–240.6 mo. In the twelve 18F-FDG PET–positive scans, the median doubling time was 6.6 mo (range, 1.8−177 mo; mean, 21.9 ± 49.2 mo), whereas in the 9 false-negative scans, the median doubling time was 12.1 mo (range, 4.2–240.6 mo; mean, 40.3 ± 76.2 mo). The calcitonin doubling time for the false-positive case was 22.4 mo.
There was no correlation (P = 0.65) between calcitonin doubling time and SUV and no significant difference in calcitonin doubling time between 18F-FDG PET–positive and 18F-FDG PET–negative scans (P = 0.48 by the Wilcoxon test).
Correlation with Other Imaging Studies
A total of 28 anatomic imaging studies were available for comparison. All true-positive 18F-FDG PET scans had corresponding structural abnormalities. The smallest size of a lymph node seen by 18F-FDG PET was 9 mm, and the smallest size of lung nodules and bone lesions was 1 cm each. Partial-volume effect and low 18F-FDG uptake may have prevented the detection of smaller lesions. In the patient with a hypermetabolic liver lesion, false-positive for MTC, dedicated CT of the liver characterized the lesion as a hepatic carcinoma. Five patients also underwent imaging with 111In-pentetreotide; 4 of these studies were false-negative and 1 was true-positive. In 2 patients with false-negative 111In-pentetreotide findings, the 18F-FDG PET findings were also negative. In the other 2 patients, the 18F-FDG PET study showed metastatic lymph nodes in the neck or mediastinum.
Fourteen scans showed no abnormal 18F-FDG uptake on PET images (calcitonin level, 106–55,200 pg/mL). In 7 of these instances, the results of anatomic imaging (n = 6; calcitonin level, 106–1,420 pg/mL) or somatostatin receptor scintigraphy (n = 1; calcitonin level, 55,200 pg/mL) were also negative; in 5 instances, no other concurrent imaging studies were available; and in 2 instances, disease was identified by anatomic imaging. The latter included a patient with a calcitonin level of 6,190 pg/mL, in whom ultrasound revealed metastatic nodes in the right neck, the largest of which measured 1.4 cm in diameter. In the other case (calcitonin level, 48,800 pg/mL), hepatic metastases did not show any appreciable 18F-FDG uptake. These liver lesions had grown slowly, with a doubling time of about 6 y for the largest lesion (from 2 to 3.8 cm; Fig. 3). Thus, the lack of FDG avidity on 18F-FDG PET may have been related to the slow growth rate and relatively high background activity in the liver on 18F-FDG PET images.
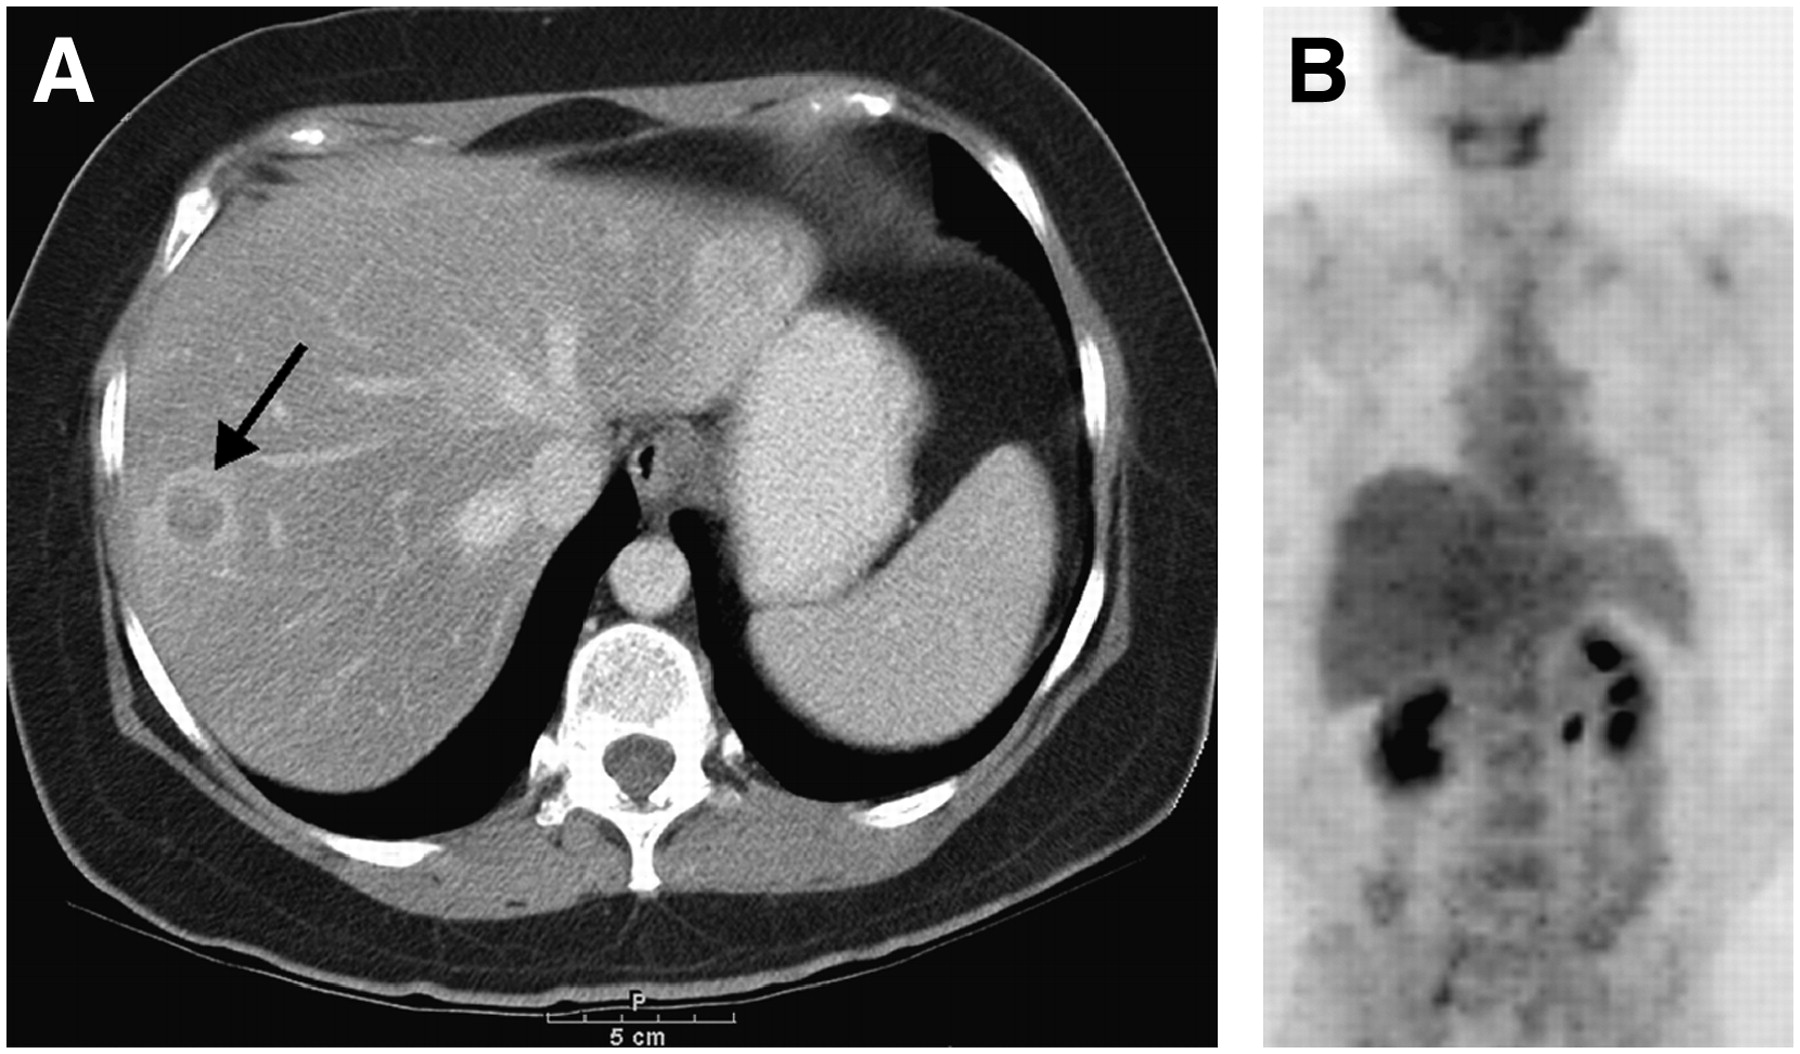
(A) Transaxial contrast-enhanced CT image of 51-y-old woman with calcitonin level of 48,800 pg/mL shows hepatic metastasis (arrow). (B) Coronal 18F-FDG PET image of same patient shows no appreciable abnormal uptake.
On follow-up of the 12 negative 18F-FDG PET scans without abnormality on concurrent imaging or lacking other concurrent imaging studies, no disease was detected in 6 instances (initial calcitonin level, 106–1,420 pg/mL) on various imaging studies between 10 and 59 mo later. All but one patient had an initial calcitonin level of less than 1,000 pg/mL. In the other 6 instances (initial calcitonin level, 381–55,200 pg/mL), gross disease eventually became apparent on follow-up imaging (CT, ultrasound, or 18F-FDG PET) between 4 and 22 mo later. Four of these 6 patients had initial calcitonin levels of 1,000 pg/mL or more.
The median follow-up after 18F-FDG PET was 31 mo (range, 4–60 mo). During this time, 4 patients died, and 3 of these 4 deaths were due to MTC. There was no difference in overall or disease-specific survival between individuals with normal 18F-FDG PET findings and individuals with abnormal 18F-FDG PET findings. This result may have been related to the small sample size and the generally good prognosis of the patients included in this study.
PET Versus PET/CT
Twenty-two scans were PET only, whereas 16 scans were combined PET/CT. Of the 16 PET/CT scans, 6 had negative findings and 10 had positive findings. In no PET/CT study was the PET component negative but the companion CT component positive for a site of disease.
Among the 10 PET/CT scans showing abnormal 18F-FDG uptake, the companion CT for 6 (involving a total of 14 lesions) helped to better localize the abnormal foci anatomically. In 9 lesions, the CT was instrumental in distinguishing between bone and soft-tissue lesions, and in another 5 lesions, the CT was helpful in defining the focus of 18F-FDG uptake within soft tissue (e.g., neck lymph node vs. neck muscle uptake or lymph node vs. thyroid bed). In addition, we were unable to characterize 5 foci of 18F-FDG uptake (affecting 4 patients) as either clearly benign or malignant on the basis of PET alone. On combined PET/CT, all 5 foci were proven to be benign (e.g., focal inflammatory changes in the lungs versus metastasis, and rib fracture vs. osseous metastasis). Finally, in 1 case, the companion CT component of PET/CT showed extension of metastatic disease from a vertebral body into the epidural space, a finding that was not appreciated on PET alone.
DISCUSSION
Our study showed an overall sensitivity of 62% for 18F-FDG PET in patients with elevated calcitonin levels and suspected residual, recurrent, or metastatic MTC. However, the sensitivity for lesion detection was 78% when the calcitonin level was greater than 1,000 pg/mL. In contrast to prior studies, we specifically investigated and attempted to quantify the relationship between 18F-FDG PET positivity and serum calcitonin. Our results suggest that 18F-FDG PET rarely detects disease in patients with calcitonin levels below 500 pg/mL. A clinically meaningful sensitivity could be achieved only for calcitonin levels of greater than 1,000 pg/mL, as illustrated in Figure 2.
MTC is a relatively rare neoplasm accounting for about 3%–10% of all thyroid malignancies. Publications evaluating the clinical utility of 18F-FDG PET in this disease are therefore usually limited to smaller groups of patients. Some of the earlier studies indicated a sensitivity of approximately 70%–80% for 18F-FDG PET in localizing recurrent or metastatic MTC (19). For instance, a sensitivity of 76% was reported for a study of 20 patients (14), and a sensitivity of 78% was reported for a multicenter study of 55 patients (15). For another study, of 40 patients (16), a 95% detection rate for lymph node metastases was reported. In contrast, de Groot et al. (17) reported a sensitivity of only 41% in a patient-based analysis of their 26 patients. In a study that compared PET imaging with the radiotracers 18F-dihydroxyphenylalanine (DOPA) with 18F-FDG, Hoegerle et al. (23) showed a 44% sensitivity for 18F-FDG PET in lesion detection in a study of 11 patients. Our sensitivity of 62% is thus within the range of reported data.
Data from our study and that of de Groot et al. (17) indicate that 18F-FDG PET has the greatest utility in patients with calcitonin levels of at least 1,000 pg/mL; at that cutoff level, sensitivities of 78% and 73% were achieved in our study and theirs, respectively. Our data also suggest that 18F-FDG PET has limited usefulness in patients with low calcitonin levels. Although the 18F-FDG PET scan can rarely be positive at low calcitonin levels, as shown in our patient with 514 pg/mL, the overall sensitivity was only 20% using a cutoff of 1,000 pg/mL or less. This result is similar to data of de Groot et al. (17) showing a sensitivity of 23% for the same calcitonin cutoff level. Although a previous study reported a 18F-FDG PET sensitivity of 67% for lesion detection among patients with calcitonin levels below 500 pg/mL (15), we doubt that this result can be reproduced in clinical practice. That study may have been subject to considerable selection bias. In fact, the relatively low lesion detection rate in patients with low calcitonin levels is likely a reflection of microscopic disease or a smaller tumor burden. A similar relationship has also been established for other hormone-producing malignancies, such as prostate cancer and prostate-specific antigen levels (24). In general, a small lesion size and slow growth rate are known limitations of 18F-FDG PET in many neuroendocrine tumors (25). In our study, the mean SUV of 18F-FDG PET–positive lesions was 5.3, which is relatively low and may reflect the more indolent nature of many MTC lesions. This SUV of 5.3 is also considerably lower than the mean SUV of 9.3 observed in a group of patients with 18F-FDG PET–positive thyroid cancer of papillary origin (26) or of 17.6 in patients with Hürthle cell thyroid cancer (27). A higher SUV in 18F-FDG PET–positive papillary carcinoma may indicate a mixed histologic type and some poorly differentiated components within the lesion.
One of our false-negative cases was a patient with liver metastases. Szakall et al. (16) also reported a better detection of liver metastases from MTC with CT or MRI than with 18F-FDG PET. Similarly, Esik et al. (28) demonstrated a high prevalence of small hepatic metastases (89%) localized by angiography but undetected by other imaging methods including 18F-FDG PET, CT, and MRI. Finally, Musholt et al. (13) reported on 5 small subcapsular hepatic metastases in a patient with metastatic MTC that were detected only on laparoscopy, whereas 18F-FDG PET and structural imaging studies had negative findings. The latter has also been confirmed by surgical experience in our institution: In patients with elevated calcitonin but negative imaging findings, it is not uncommon that laparoscopy will identify small subcapsular metastases in the liver.
Prior studies have suggested that the doubling time of plasma calcitonin may provide prognostic information in patients with MTC (29), probably reflecting tumor proliferation. We observed a trend to shorter calcitonin doubling times, as well as higher absolute calcitonin levels, in 18F-FDG PET–positive scans than in 18F-FDG PET–negative scans. However, these differences were not significant because of considerable overlap in the data points and probably also because of the small sample size.
A limited number of our scans were performed as combined PET/CT. In these scans, the companion CT portion of the PET/CT scan was of significant help in better defining the location of focal 18F-FDG uptake and in characterizing the nature of such tracer uptake as clearly malignant or nonmalignant. Although the small sample does not permit definitive conclusions, this is essentially in concordance with numerous prior publications investigating the utility of combined PET/CT.
This study was retrospective, with certain method-inherent limitations. Although we used strict diagnostic criteria, any retrospective study is inherently prone to selection bias. The main aim of this study was to define the sensitivity of 18F-FDG PET scans and to investigate any relationship with serum calcitonin levels in residual, recurrent, and metastatic MTC. Data from other imaging studies were used mainly as evidence of disease. Therefore, the true sensitivities of the other imaging modalities cannot be calculated. We used the official reports of other imaging studies as our reference, with equivocal reports considered positive. Radiologists generating these original reports might have been aware of the corresponding 18F-FDG PET findings and thus might have been biased in their interpretation of the anatomic or somatostatin receptor scintigraphy studies.
Several assays are currently available for the measurement of serum calcitonin levels, and these assays vary in their range for reference values. Therefore, until a standard assay for calcitonin is identified, institutions need to establish their own reference range for when to expect normal 18F-FDG PET results, and the cutoff levels shown in this study may not be immediately applicable in other institutions. However, the general trend that a positive 18F-FDG PET scan is more likely in patients with higher calcitonin levels would not be affected by the exact reference range for a given calcitonin test.
18F-FDG may not be the ideal radiotracer for imaging MTC. Preliminary data suggest that the use of other agents, such as 18F-DOPA, may provide a better lesion detection rate than does 18F-FDG (23), but this suggestion needs to be confirmed in larger patient populations.
CONCLUSION
Our results indicate that 18F-FDG PET can detect residual, recurrent, or metastatic MTC in patients with elevated calcitonin levels after thyroidectomy. The probability for disease detection is higher in patients with higher calcitonin levels: 18F-FDG PET can be used in a clinically meaningful manner in patients with calcitonin levels of more than 1,000 pg/mL (sensitivity, 78%), but its utility appears limited if the calcitonin level is below 500 pg/mL.
Footnotes
-
COPYRIGHT © 2007 by the Society of Nuclear Medicine, Inc.
References
- Received for publication September 23, 2006.
- Accepted for publication December 27, 2006.


Jump to section
Related Articles
Cited By...
- Patient-Derived Medullary Thyroid Cancer Organoids; a Model for Patient-tailored Drug and PET-Tracer Screening
- A review of diagnostic approaches to medullary thyroid carcinoma
- Predictive Value of 18F-FDG PET in Patients with Advanced Medullary Thyroid Carcinoma Treated with Vandetanib
- Current Understanding and Management of Medullary Thyroid Cancer
- NCCN Task Force: Clinical Utility of PET in a Variety of Tumor Types
- 18F-Dihydroxyphenylalanine PET in Patients with Biochemical Evidence of Medullary Thyroid Cancer: Relation to Tumor Differentiation
- Progression of medullary thyroid carcinoma: assessment with calcitonin and carcinoembryonic antigen doubling times
- Would Patient Selection Based on Both Calcitonin Blood Level and Doubling Time Improve 18F-FDG PET Sensitivity in Restaging of Medullary Thyroid Cancer?
- Reply: Would Patient Selection Based on Both Calcitonin Blood Level and Doubling Time Improve 18F-FDG PET Sensitivity in Restaging of Medullary Thyroid Cancer?