


Abstract
Recently, we launched a stationary SPECT system (U-SPECT-I) dedicated to small-animal imaging. A cylinder with 75 gold micropinhole apertures that focus on a mouse organ was used to maximize the detection yield of γ-photons. Image resolutions of approximately 0.45 and 0.35 mm could be achieved with 0.6- and 0.3-mm pinholes, respectively. Here, we present a combined acquisition and reconstruction strategy that allowed us to perform full-body imaging with U-SPECT-I. Methods: The bed was stepped in the axial and transaxial directions so that the pinholes collected photons from the entire animal (scanning focus method, or SFM). Next, a maximum-likelihood expectation maximization algorithm exploited all projections simultaneously to reconstruct the entire volume sampled. The memory required for image reconstruction was dramatically reduced by using the same transition submatrix for each of the bed positions. This use of the same submatrix was possible because the submatrix acted on subvolumes that were shifted during reconstruction to match the corresponding location of the focus. Results: In all cases, SFM clearly improved on the method that involves stitching separate reconstructions of subvolumes obtained from the different bed positions. SFM suffered less from noise, streak artifacts, and improper background activity. In a mouse-sized phantom containing a capillary-resolution insert, sets of radioactively filled capillaries as small as 0.45 mm separated by 0.45 mm could be distinguished. Total-body mouse bone imaging using 99mTc-hydroxymethylene diphosphonate showed that uptake in very small structures, such as parts of the vertebral processes, could be distinguished. Conclusion: In addition to providing ultra-high-resolution images of mouse organs, focusing SPECT pinhole systems are also suitable for submillimeter-resolution total-body imaging of mice.
The use of dedicated SPECT and PET instruments (1) in concert with the radiolabeling of small molecules, antibodies, peptides, and probes for gene expression has facilitated the in vivo assessment of molecular mechanisms and the development of new tracers and pharmaceuticals (2–8). Small-animal SPECT systems are typically based on the pinhole imaging principle (9–24). Micropinhole radionuclide imaging allows high-spatial-resolution projection data to be obtained, particularly for small organs that can be positioned close to the pinholes. Until recently, the drawback of most pinhole SPECT systems, compared with PET systems, was their inability to detect a significant fraction of the emitted γ-photons, particularly when small pinholes are used. Several groups have proposed methods that use multiple pinholes to improve sensitivity (17–27).
Recently, we introduced a type of stationary SPECT system dedicated to small-animal imaging (U-SPECT). The U-SPECT systems maximize sensitivity by focusing the pinholes on an area just large enough to contain the tissue of interest (10,18,19). The focusing designs allow for high magnification of the object under investigation, enabling one to exploit the high-resolution content of pinhole projection data even when low-cost, commonly available clinical Anger cameras are used. Similar to FastSPECT-I and -II (introduced by the University of Arizona (23,24)), U-SPECT-I is stationary in the sense that there is no need to move any detector parts, the collimator, or the animal. These stationary systems have advantages in that they are stable, have a simple design, can perform dynamic studies within any frame time (18,19,25,28), and ease animal handling and positioning.
So far, submillimeter-resolution images were obtained with U-SPECT-I only for a limited volume of interest, such as the heart or brain of a mouse. The goal of the present work was to evaluate a combined acquisition/reconstruction method that drastically extends the reconstructed field of view even up to one encompassing the full body. The method was validated using simulation studies, physical phantom experiments, and total-body in vivo mouse imaging.
MATERIALS AND METHODS
Design and Geometry of U-SPECT-I
Figure 1A shows an overview of the U-SPECT-I system, in which the detectors of a triple-head SPECT system surround the pinhole apertures. A tungsten cylinder containing 75 gold pinholes (Fig. 1B) is mounted in the center of the triangle and acts as a collimator. Each pinhole projects onto a separate part of the detector area, resulting in 69 independent pinhole cameras (some pinholes illuminate a dead area). Overlap of the projections is prevented by placement of a lead tube with 75 rectangular holes around the tungsten pinhole cylinder. Details of the system design and the collimation have previously been published (19).

(A) Overview of U-SPECT-I system. Triangular lead shielding with cylindric pinhole collimator is placed in triple-detector setup. xyz-stage, with bed attached, is placed in front of detectors to accurately transport animal through collimator tube. (B) Tungsten collimator with 75 gold pinholes. (C) Thin-walled half-cylindric polymethylmethacrylate bed with heating mat. (D) (Left) Cross section through collimator (inner diameter, 41 mm) and animal on top of bed. Inner circle represents CFOV. (Middle) When bed is translated to a position in lower part of collimator, CFOV is located in upper part of animal. (Right) With 3 focus positions, one can cover almost entire animal with CFOV.
Two collimator tubes are currently available, one containing 0.3-mm pinholes and another containing 0.6-mm pinholes. Recent results show that an image resolution of approximately 0.45 mm can be reached with 0.6-mm pinholes and that resolutions of less than 0.35 mm can be reached with 0.3-mm pinholes (10,29). However, because a relatively high sensitivity is required for total-body imaging, the 0.6-mm pinholes were used for all experiments and simulations in this study.
Scanning Focus Method (SFM) of Acquisition
The animal is placed on a thin, half-cylindric polymethylmethacrylate bed (Fig. 1C). The cylindric central field of view (CFOV), which is approximately 11 mm in diameter and 10 mm in length, indicates the extent of the imaging space that is visible through all pinholes, thus allowing for proper image reconstruction (Fig. 1D). The fact that complete data in the sense of Orlov are also available in the immediate neighborhood of the CFOV explains why not every point to be reconstructed needs to be precisely inside the CFOV. The CFOV obviously does not cover the entire animal. However, translating the bed toward the bottom of the pinhole tube repositions the CFOV closer to the upper part of the animal. Thus, repositioning the bed inside the pinhole cylinder is equivalent to repositioning the CFOV within the animal.
During acquisition, the focus steps through the animal using a motor-controlled xyz-stage, enabling the collection of a sufficient number and variety of projections from all parts of the animal.
Image Reconstruction
Before image reconstruction, the projections were corrected for decay.
Images obtained with the U-SPECT system are reconstructed using maximum-likelihood expectation maximization (ML-EM) (30). The activity distribution a is estimated from the matrix equation: p = ma + n, with p the projection data, m the matrix that projects the activity distribution onto the projections, and n the noise in the projections. The matrix elements mji represent the probability that a photon emitted in voxel i is detected in pixel j. These elements are measured with a point source, and only nonzero elements are stored on disk (19,29).
When multiple focus positions are used to extend the field of view, there are several ways to reconstruct the entire volume sampled. For example, parts of the activity distribution associated with each focus position can be reconstructed independently, followed by stitching of these subvolumes to obtain the overall volume. However, the extra information in a subvolume of the activity distribution that is also available from other focus positions is not fully exploited in this way. Lack of complete data in the outer parts of an individual reconstruction can even lead to artifacts at the edges of the subvolume—artifacts that will also be present in the final stitched volume.
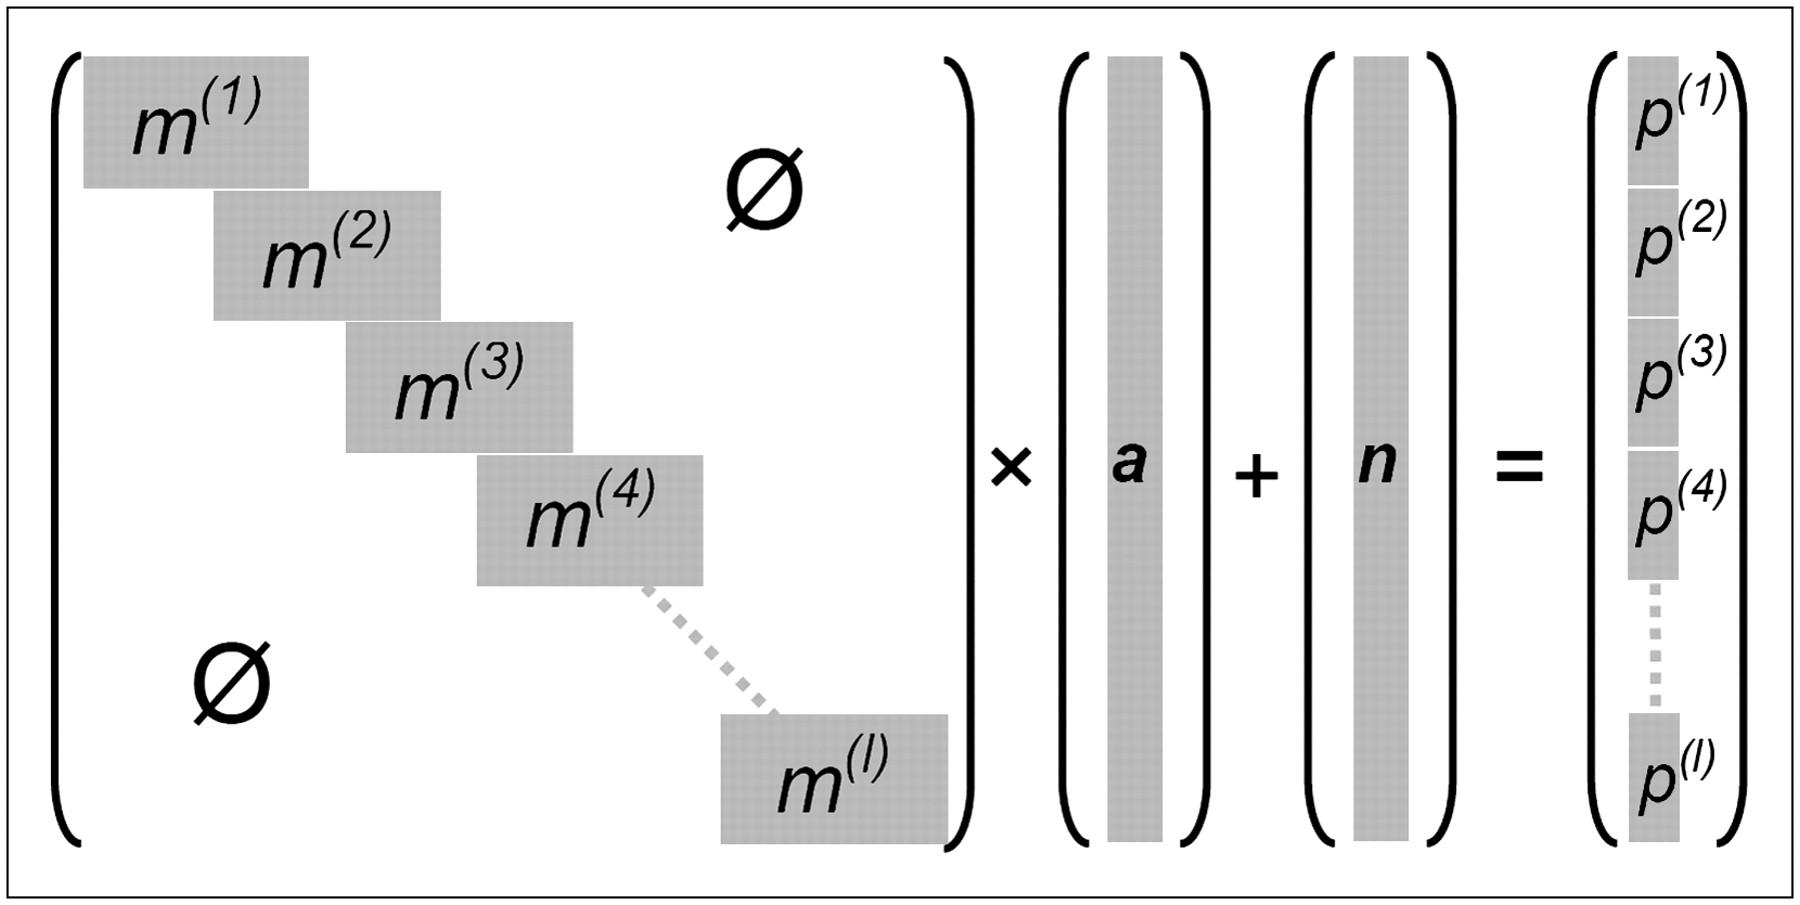
An alternative to stitching is SFM, which combines the scanning of multiple focus positions with the simultaneous reconstruction of all projection data. The reconstruction problem can then be written in matrix form as shown in Figure 2, using a matrix M that is much larger than matrix m. However, M can be divided into smaller submatrices m(k) corresponding to the part in focus at the different bed positions. Matrix elements of submatrix mji(k) represent the probability that a photon emitted in voxel i is detected in pixel j for bed position k. Here, a again denotes the activity in voxels that are now distributed over the entire mouse and p(k) contains the projection data obtained at focus position k.

Matrix representation of statistical reconstruction problem with multiple focus positions (1),… , (l).
The submatrix m(k) acts on a part of the activity distribution a and projects exclusively to the projection set p(k) acquired at bed position k. In principle, a different submatrix m(k) is needed for each of the k focus positions. However, when we restrict the shifts of the focus positions to an integer times the voxel size, the reconstruction can be performed with the same submatrix m when the forward and backward projections act on a shifted voxel volume (31). This, in combination with sparse matrix storage, reduces the total memory requirements from 6.4 terabytes (for brute-force storage of all matrix elements of M) to approximately 4 gigabytes (for storing only m), which easily fits in the memory of a modern computer.
The reconstructed images obtained with the stitching method are compared with the images reconstructed using SFM. Reconstruction for SFM is performed using 150 iterations of the ML-EM algorithm using all shifted volumes. For stitching, each subvolume is reconstructed separately, again using 150 iterations of standard ML-EM. After reconstruction, the data from the individual subvolumes are combined to form the complete stitched volume. For the stitching of the subvolumes, the following procedure is used: If a voxel is in the CFOV for one of the subvolumes, it is copied to the stitched volume. When a certain voxel is present in the CFOV of more subvolumes, its value is averaged over all available subvolumes. This will be the case when the CFOVs of the different positions overlap. If a voxel is not in the CFOV of any subvolume, we take the voxel from the subvolume from which the distance to the CFOV is smallest.
The voxel size used for reconstructions was 0.1875 mm3, and the projection pixel size used for measurements was 0.9 mm. Better images are often obtained by overiterating followed by filtering than by early stopping, for example (32,33). In this case, the reconstructions are postfiltered using a 3-dimensional gaussian with a full width at half maximum of 0.375 mm. Attenuation and scatter of photons in the object are not modeled in the current system, because these phenomena are expected to be negligible for small objects such as mice.
No acceleration techniques such as ordered subsets are used. Currently, with a nonoptimized code the time required for reconstruction using a computer with a 2-GHz Opteron processor (AMD) and a voxel grid of 0.1875 mm3 is approximately 18 min for a single position and approximately 330 min for a total-body scan consisting of 60 positions. However, these reconstruction times dramatically decrease by using a coarser grid: For example, an acceleration of 1 order of magnitude can be achieved by using a voxel size of 0.375 mm3.
Phantom Studies
Digital Mouse Phantom.
For a simulation study of a mouse bone scan, we used the digital mouse whole-body phantom (MOBY (34)). The CFOV of the system is approximately 1 mL, so about 30 focus positions are needed to cover the entire mouse body. Data were simulated for 2 protocols having different numbers of bed positions, but the total acquisition time was 1 h for both cases. The first protocol had a total of 36 focus positions (with a 100-s acquisition per bed position). Twelve different axial positions were used. At each axial position, 3 transaxial bed positions were used, all at a distance of 5 mm from the center separated by an angle of 120°: the first directed downward, the second to the upper right, and the third to the upper left (as indicated by the arrows in Fig. 1D (middle)). The positions of the CFOV in the animal corresponding to these translations are shown in Figure 1D (right). For a second protocol, the same 3 transaxial translations are used but the number of axial positions is increased to 20, resulting in a total of 60 bed positions (with a 60-s acquisition at each position).
Physical Uniform Phantom.
The uniformity of a scan consisting of multiple focus positions was tested by scanning a large, uniformly filled phantom (Fig. 3A). A transparent acrylic cylinder with an inner diameter of 18 mm and a length of 50 mm (approximately the size of a small mouse body) was filled with 450 MBq of 99mTc and scanned for 1 h using 60 focus positions. The same positioning scheme was used as described above for the digital mouse phantom study with 60 positions.

(A) Uniformly filled cylinder phantom. (B) Miniature-resolution insert. (C) Total-body phantom consisting of uniformly filled cylinder with resolution phantom inside. (D) Resolution phantom (small holder containing resolution insert).
Physical-Resolution Phantom.
A miniature-resolution phantom (Derenzo phantom; Vanderwilt Techniques) was used in this study (Fig. 3B). This translucent acrylic insert has 6 sectors; each sector contains a set of equal-sized capillaries (0.35, 0.4, 0.45, 0.5, 0.6, and 0.75 mm). The distance between the rods in a sector equals the rod diameter in that sector. The outer diameter of the insert is 12 mm, and each capillary is 10 mm long. The spatial resolution is often defined by the size of capillaries that can be observed separately in such phantoms.
A phantom was constructed to test the spatial resolution for total-body scanning. This phantom (Fig. 3C) consists of a uniformly filled cylinder containing a cylindric holder (Fig. 3D) with the resolution insert inside. This setup was filled in such a way that activity concentrations are comparable to those in the animal bone study (using 470 MBq) described in the next subsection. The concentrations were derived as follows: The total bone mass of a mouse is approximately 3% of its total weight (35), and the uptake in the bone is about 50% of the administered activity (36). A 32-g mouse will have approximately 0.53 cm3 of bone (density of bone is approximately 1.8 g/cm3) containing half the injected activity, so the activity concentration in the bone is 441 MBq/cm3. The capillaries of the resolution insert were filled with this concentration (in total, 39 MBq is present, divided over all capillaries) to represent small bone structures of the animal. The large cylinder was filled with 120 MBq to represent the background activity in other tissues.
Animal Studies
A total-body mouse bone scan with 470 MBq of 99mTc-hydroxymethylene diphosphonate (HDP) was performed using 60 focus positions. The total acquisition time was 1 h. The animal study followed protocols approved by the Animal Research Committee of the University Medical Center Utrecht. A 4.5-mo-old mouse (C57BL/6JO1aHsd; Harlan) of 32 g was anesthetized with an intraperitoneally administered mixture of 2.5 mL of Hypnorm (fentanyl, 0.315 mg/mL, and fluanisone, 10 mg/mL; Janssen), 2.5 mL of Dormicum (midazolam, 5 mg/mL; Roche) and 5 mL of Aquadest per kilogram of body weight. The 99mTc-HDP (concentrated in a total volume of 0.2 mL) was injected in the tail vein of the animal. Two hours and 15 min after injection, the acquisition started. During the entire procedure, the animal's body temperature was kept at ±37°C by a thin heating mat placed under the body (Fig. 1C).
Issues with radiation dose in small-animal SPECT can be important (37), particularly in longitudinal studies. Therefore we emulated a scan with activity more than 10 times lower than used in our animal study; the projection data of the animal study were downscaled by a factor of 10 (by multiplying each pixel by a factor of 0.1), after which Poisson noise was generated. Images reconstructed in this way will show the animal in exactly the same position as in the reconstruction of the original data, allowing for direct comparison.
RESULTS
Simulated Total-Body Bone Scan
The results of the simulated bone scan are presented in Figure 4. Maximum-intensity projections are shown for SFM and stitched reconstructions for 36 focus positions (top) and 60 focus positions (bottom). It is clear that noise, streak artifacts, and improper background activity were reduced when SFM was used instead of stitching. For both methods, the images obtained from a large number of positions suffer slightly less from reconstruction artifacts and have a higher contrast than do the images obtained from a small number of positions, if the total acquisition time is kept equal. To quantify the magnitude of the stitching artifacts, we calculated the mean square error between the known configuration of the phantom and the images produced by each of the 4 different types of reconstruction (Fig. 4). The mean square error was typically 300–500 times lower for SFM-based reconstructions than for stitched reconstructions.

Maximum-intensity projections of reconstructed images obtained with SFM (B and D) show significant improvements over stitched reconstructions (A and C). Images at top were obtained using 36 focus positions; images at bottom, using 60 focus positions. Mean square errors = 2.9242 (A), 0.0060 (B), 1.7965 (C), and 0.0059 (D).
Phantom Experiments
Both transaxial and axial slices through the reconstructed images of the homogeneously filled cylinder phantom are shown in Figure 5. SFM clearly outperforms stitching, showing better overall uniformity. The total acquisition time was 60 min for both methods.

SFM (top) and stitching (bottom) reconstructed images (and image profiles) of uniformly filled cylinder. Images were obtained using 60 focus positions.
A slice of the reconstructed total-body-resolution phantom and a profile through this slice are presented in Figure 6. One can resolve the set of 0.45-mm capillaries of the miniature-resolution insert. The image was obtained using SFM with 60 positions.

(A) Reconstruction of total-body phantom: 0.375-mm-thick slice showing resolution insert in phantom. (B) Profile through sections with 0.6- and 0.45-mm capillaries (not all capillaries were properly filled in lower left part of insert).
Animal Studies
Total-body mouse images with 99mTc-HDP are shown in Figure 7. For visualization purposes with these maximum intensity projections, the hot bladder was removed from the volume by segmenting the bladder with a region-growing algorithm and setting the voxels in the segmented volume to zero. High uptake of 99mTc-HDP in the liver of the animal is visible. Small details of the skeleton are clearly defined: For example, uptake in very small structures, such as parts of the vertebral processes, ribs, and tiny joints, can readily be distinguished. Slices through the volume confirm the high resolution obtained with the SFM method (Figs. 8A and 8B). The slice thickness was 0.75 mm for both images (4 reconstructed slices of 0.1875 mm each were summed to obtain the 0.75-mm-thick slices).

Total-body bone scan of living mouse. Scan was acquired using 470 MBq of 99mTc-HDP and 60 focus positions.

(Top) High-count study using 470 MBq of 99mTc-HDP (reference). (Bottom) Emulated low-dose study. Slices through head (A) and leg (B) and maximum-intensity projections of complete volume (C) show high level of detail in skeleton of living mouse for both cases.
Figure 8 also shows the effects of using a dose more than 10 times lower than that used for creating the image in Figure 7. This “lower-dose” study was derived from the high-count mouse data by downscaling the projection data by a factor 10 and then adding Poisson noise. Because the high-count study was not free of noise, the projections contain slightly more noise than would a study with a dose exactly 10 times lower. Particularly thin structures such as the shoulder blades and small bones are visually affected by the lower dose.
DISCUSSION
The highly focusing design of the U-SPECT-I system has unsurpassed sensitivity in a field of view large enough for imaging small-animal organs. As a result, animal images of high resolution have been produced with this system. The initial critics were concerned about the limited field of view. With the SFM proposed in the present paper, we have shown that highly focusing SPECT systems are also suitable for imaging volumes as large as those of total-body animal imaging.
The stationary setups of systems such as U-SPECT and Fast-SPECT are very suitable for dynamic imaging (19). Fast dynamic imaging of an area larger than the CFOV (covered by a single bed position) is also possible: Because the translations of the mouse bed are small, the bed can quickly be shifted from one focus position to another. For example, when an area has to be imaged in 6 positions, movement of the bed requires less than 6 s. For a dynamic study with a time resolution of 1 minute, only 10% of the acquisition time would be lost. In most dynamic studies (such as of the heart, brain, or tumors) fewer positions are required, indicating that even a subminute time resolution is possible with SFM.
In a few aspects, SFM is related to the T-SPECT technique (22). Both methods use multipinhole collimation, in which the detectors are placed in a stationary setup and only the object under investigation is translated. For the T-SPECT system, the object is moved within the field of view to increase the sampling information needed for reconstruction, whereas our primary goal for using translations is to extend the field of view of the U-SPECT system. Both methods have the advantage of not requiring that the heavy detectors be translated or rotated.
In addition to the in vivo mouse study using 99mTc-HDP, we have shown that 0.45-mm capillaries can still be distinguished in a mouse-sized phantom. The activity concentrations in this phantom were representative for a mouse bone study with 470 MBq of 99mTc-HDP.
We are currently developing an additional pinhole tube for rat imaging. A total of 2 tubes will be sufficient to image mouse and rat organs such as heart and brain without moving the animal or detectors. With semistationary protocols such as SFM, it is possible to image larger fields of view, up to the size of those used for total-body rat imaging. Dedicated acquisition software has recently been developed in our laboratory. This software contains a method to synchronize projection acquisitions with bed movements and to automatically calculate the sequence of bed positions needed to scan a specified volume of interest, thus making the imaging of extended fields of view with SFM user-friendly and accurate.
Correction for attenuation and scatter of photons in the object was not applied, because these effects are often small in animal imaging for most of the isotopes used. However, in the case of 125I, which emits photons of only approximately 30 keV, the images can seriously be affected by attenuation. When a density distribution of the object is available (i.e., from a registered small-animal CT scan), methods for attenuation and scatter correction can be implemented.
The reconstruction software we developed for use with SFM does not restrict the scanning scheme; only the coordinates for each focus position are required. An efficient implementation of the ML-EM algorithm shifts the reconstruction volume to match the focus. Even with a large number of focus positions, the reconstruction time does not increase dramatically, because the reprojection data for all voxels shifted to one position can be generated in parallel. However, we will explore how reconstruction time can be decreased—for example, by using block-iterative methods in image reconstruction (38–40). We expect that the required reconstruction time of several hours could be reduced significantly to about 10 min. This estimation follows from the fact that acceleration factors of 10–20 are typical when the ordered-subset algorithm is applied in emission CT. Another means of acceleration concerns the sequence of bed positions. The present acquisition scheme is based on 3 different transaxial bed positions per axial bed position. One could also try other orbits, in which each point on the bed describes a spiral, possibly requiring fewer bed positions. This alternative might not reduce the total acquisition time but could improve the sampling of each point in the animal or allow faster reconstruction because fewer reprojections would need to be generated.
CONCLUSION
Previously, we have shown that U-SPECT-I allows for discriminating between molecular concentrations in adjacent volumes of as small as about 0.1–0.04 μL, depending on the pinhole diameters used (19,29,31). In simulation studies and experiments using both phantoms and mice, we have been able to demonstrate that U-SPECT-I is capable of total-body imaging with a resolution better than 0.5 mm. The ML-EM algorithm developed for this goal was compared with stitching of the individually ML-EM reconstructed subvolumes and was found to be superior in terms of noise, contrast, number of streak artifacts, and amount of background activity, as well as in computer memory required.
Acknowledgments
This work was sponsored by the Medical Council of Netherlands Organization for Scientific Research, grant 917.36.335. We take sole responsibility for the content and emphasize that the views expressed here do not necessarily represent the official view of the sponsoring agency. We are grateful to Frans van der Have for technical assistance and fruitful discussions. We thank Annemarie van der Linden, Henk te Biesebeek, and Kees van der Linden for technical support.
Footnotes
-
COPYRIGHT © 2007 by the Society of Nuclear Medicine, Inc.
References
- Received for publication April 12, 2006.
- Accepted for publication November 10, 2006.


Jump to section
Related Articles
Cited By...
- Utilizing High-Energy {gamma}-Photons for High-Resolution 213Bi SPECT in Mice
- Ultra-High-Sensitivity Submillimeter Mouse SPECT
- Performance Assessment of a Preclinical PET Scanner with Pinhole Collimation by Comparison to a Coincidence-Based Small-Animal PET Scanner
- VECTor: A Preclinical Imaging System for Simultaneous Submillimeter SPECT and PET
- Fast Spiral SPECT with Stationary {gamma}-Cameras and Focusing Pinholes
- Advances in Preclinical SPECT Instrumentation
- Using the NEMA NU 4 PET Image Quality Phantom in Multipinhole Small-Animal SPECT
- Small-Animal Molecular Imaging Methods
- Recent Advances in Small-Animal Cardiovascular Imaging
- U-SPECT-II: An Ultra-High-Resolution Device for Molecular Small-Animal Imaging