


Abstract
11C-Methionine PET is a well-established technique for evaluating tumor extent for diagnosis and treatment planning in neurooncology. Image interpretation is typically performed using the ratio of uptake within the tumor to a reference region. The precise location of this reference region is important as local variations in methionine uptake may significantly alter the result, particularly for lesions at the border of gray and white matter. Selection of a reference region can be highly user dependant, and identifying a representative normal region may be complicated by midline or multifocal tumors. We hypothesized that current coregistration methods would enable interpretation of methionine PET images with reference to an averaged normal uptake map, allowing better standardization of scan analysis and increasing the sensitivity to tumor infiltration, particularly of white matter regions. Methods: A normal methionine uptake map was prepared from the normal hemispheres of 20 scans performed on patients with benign or low-grade lesions. Affine and nonlinear coregistration algorithms were evaluated for spatial normalization of the images to a previously developed PET template. A standardized method for applying the normal uptake map in brain tumors was developed and evaluated in a sample of 18 scans (6 grade II, 6 grade III, and 6 grade IV gliomas). Tumor extent was compared with that derived from a mirrored contralateral reference region method. Correlation coefficients were calculated between the uptake ratios for tumor to normal uptake map versus tumor to mirrored reference region. Results: “RatioMap” images depicting voxel-by-voxel ratios of a patient scan to the normal uptake map revealed increased methionine uptake in white matter regions that could not be identified using the standard method. Uptake ratios within the tumor varied slightly with the normalization methods used but correlated closely with the ratio to a single reference value. Nonlinear coregistration with median ratio intensity normalization gave the strongest correlation (r = 0.97, P < 0.001, n = 17). Conclusion: Evaluation of methionine PET data with reference to normal uptake data may improve sensitivity to white matter infiltration. The tumor uptake ratios obtained correlated closely with a standard reference value technique, whereas the described method allowed for better standardization of the image analysis.
The combination of low uptake in normal brain tissue and consistently increased uptake in primary brain tumors makes l-methyl-11C-methionine an appealing PET tracer for imaging in neurooncology (1–4). Other amino acid PET tracers have entered clinical usage, most noticeably O-(2-18F-fluoroethyl)- l-tyrosine, which may be more convenient due to its longer half-life, but to date 11C-methionine has the largest evidence base. Increased uptake of methionine has been shown to correlate with both cellular proliferation (5) and microvessel count (6) in gliomas. However, comparison of the results obtained in different subjects and tumor types is complicated by substantial global inter- and intraindividual variation in methionine uptake. This may be due in part to methodologic differences but also reflects changes in methionine transport resulting from competition with other large neutral amino acids for the transporter protein (7). Variability in circulating amino acid levels may be reduced by fasting the patient before the scan but is difficult to eliminate or to adequately compensate for.
Standard interpretation of 11C-methionine PET (MetPET) scans in suspected brain tumors relies on comparison of the amount of methionine taken up by the lesion with the normal value for that region of brain. A normal value is typically determined by measuring uptake in the corresponding region of the contralateral hemisphere (1,3,6). The precise location at which the region of interest (ROI) used to calculate the normal reference value is placed is important, as local variations in methionine uptake, especially if the reference ROI is located in the vicinity of white and gray matter regions, may be sufficient to significantly alter the calculated ratio. In the case of tumors arising near to or crossing the midline, the corresponding contralateral region may contain tumor, making it difficult to identify a representative normal value. The process of identifying a mirror region of brain is also complicated by the effect of the tumor on distorting the normal brain architecture and the operator dependence of manual realignment of the image.
We hypothesized that effective image coregistration and normalization would enable accurate comparison of an individual patient scan with an averaged normal uptake map. Unlike intraindividual coregistrations, which use a series of rotations and translations to optimize a measure of similarity between 2 images, comparison of an individual scan with a population template is highly dependant on the selection of an appropriate registration algorithm. A wide range of techniques are available that differ fundamentally in the methods used to identify homologous features between the images for alignment, to transform the source image, and to evaluate the accuracy of the result (image registration methods have been reviewed in detail by Maintz and Viergever (8)). There is limited published information on the application of these methods to amino acid PET images and, particularly, in the presence of brain tumors. To be clinically useful, image registration must be accurate, reproducible, and fast without excessive demands in terms of processing requirements or operator expertise. The application of a nonlinear coregistration algorithm that has been optimized for use in 3-dimensional (3D) brain images and the comparison with a standard affine method is described.
The use of coregistration techniques allows the process of image analysis to be more easily standardized and automated. It also allows reference values to be calculated for tumors that currently pose difficulties, such as those that cross the midline. Standard techniques typically use a single reference value for the entirety of the tumor, which does not take into account changes in methionine uptake between different brain regions, particularly for tumors that occupy a location spanning both gray and white matter regions. Comparing each voxel in a scan with the corresponding voxel of a normal uptake map may provide more representative reference values allowing the tumor extent to be more clearly visualized.
MATERIALS AND METHODS
Development and Evaluation of a Normal Methionine Uptake Map
MetPET scans performed on adults with suspected brain tumors from 2003 to 2004 were identified from the archive at the Max-Planck-Institute for Neurological Research (MPIfnF; Cologne, Germany). One-hundred twenty-six scans were identified, coded, and anonymized for further analysis. Scans were excluded if the tumor was infratentorial in location or if there was evidence of previous surgery that significantly distorted the anatomy. For patients with multiple MetPET scans, only the earliest scan was retained. From the remaining group of 41 scans, 3 groups of scans were identified for the purposes of this study:
Sample A comprised those 13 patients for whom both 18F-FDG and MetPET scans had been performed within 8 wk and who were found to have a supratentorial lesion, confined to a single hemisphere on both modalities. Scans were excluded if the tumor arose from around the midline or if there was a mass effect on the contralateral hemisphere. This sample was used to build a template for spatial normalization of the other samples.
Sample B comprised 20 scans from patients with either benign lesions or low-grade gliomas, as ascertained by histopathologic examination or subsequent repeat neuroimaging. These conditions were selected as they initially involve only a single hemisphere, with methionine uptake in the unaffected hemisphere being essentially normal. Scans were excluded if the tumor arose from around the midline or if there was a mass effect on the contralateral hemisphere. These normal hemispheres were used to build the normal methionine uptake map as described.
Sample C comprised 18 patients with histologically confirmed gliomas (6 World Health Organization [WHO] grade II, 6 grade III, and 6 grade IV). This sample was used to evaluate quantitative parameters and the extent of increased methionine in tumors that were determined by our newly developed method versus current standard analysis. Contemporary MRI scans were available for 15 of these patients.
All PET scans had been performed using the same protocol on an ECAT EXACT HR (Siemens Medical Solutions Inc.) scanner. Data were acquired over 47 transaxial slices from the entire brain and corrected for scatter and attenuation. Images were reconstructed from counts accumulated 20–60 min after slow-bolus injection of approximately 740 MBq of 11C-methionine. All image analysis was performed using Vinci (Volume Imaging in Neurological Research, Coregistration and ROIs included; MPIfnF) with statistical analysis being performed in R (The R Foundation for Statistical Computing).
Template for Spatial Normalization of MetPET
The methionine template was first prepared using a normal 18F-FDG template that had been prepared previously from an independent sample of 18F-FDG PET scans performed on 7 young healthy male volunteers and spatially normalized to the International Consortium for Brain Mapping (ICBM) single-subject template (9). For each of the 13 patients from sample A, the 18F-FDG scan was first aligned to the MetPET scan using a rigid-body transformation. The 18F-FDG scan was then coregistered to the normal 18F-FDG template, using an affine coregistration, after masking of the tumor. The parameters of the coregistration were recorded and the same transformation was applied to the MetPET scan. The tumor-bearing hemisphere was then stripped and the “normal” hemispheres were combined and averaged. This created a template of methionine uptake, aligned to the ICBM single- subject template ((9); http://www.loni.ucla.edu/ICBM), to which individual MetPET scans then could be coregistered.
Normal Methionine Uptake Map
Each of the 20 MetPET scans from patients of sample B with benign/low-grade pathology was coregistered to the methionine template after masking of the tumor in each case. Coregistration was first performed using an affine coregistration algorithm and the tumor-bearing hemispheres were stripped. This process was then repeated using the nonlinear coregistration algorithm described below. Intensity normalization was performed by dividing the uptake value for each voxel by the mean of the nonzero voxels in the scan volume, calculated after stripping of the scalp, extracranial structures, and tumor-bearing hemisphere from the image. The averages of the 11 remaining left hemispheres and 9 right hemispheres were calculated and combined to create the final “normal” methionine uptake map. Images demonstrating the interindividual SD and coefficient of variance (CV) for each voxel were prepared after the affine and nonlinear coregistrations to allow for comparison of the techniques.
Interindividual variability after normalization was evaluated by analyzing variability in methionine uptake in the 20 “normal” MetPET hemispheres. Volumes of interest (VOIs) were defined on the basis of the ICBM single-subject labels template, grouped and scaled to the dimensions of the original PET scans (Table 1). The normal methionine uptake map was coregistered to each scan using affine followed-by nonlinear coregistrations, and the resulting transformation was reapplied to fit each VOI to the individual scans. Tumor-bearing hemispheres were removed before analysis using masks fitted in the same way. The mean uptake for each VOI was calculated and used to calculate interindividual mean and CVs.
Grouping of Brain Regions for Evaluation of Normal Methionine Uptake Distribution
Octree Algorithm for Nonlinear Spatial Normalization
The nonlinear algorithm that was used throughout for spatial normalization can be summarized as an initial prealignment, using a global affine transformation, followed by local nonlinear registration steps performed in a hierarchical octree manner. Each step consists of dividing the target volume by the midplanes of all 3 dimensions into 8 regular blocks (octants). Local affine registrations are then performed within the blocks to maximize a measure of similarity (correlation coefficient), including regularization by a penalty function for large deformations (10). The local affine transformations create a lattice of control points, which are interpolated by B-spline functions while restricting relative local displacement within each octant by a limit that ensures preservation of injectivity (11). The spline functions define a continuous deformation field that is used for resampling the original source image using trilinear interpolation. The process is repeated until a minimum block size, typically of 4 × 4 × 4 voxels, is reached.
This method has been designed to allow fast registration of 3D structural and functional brain images with minimal user intervention. A similar method using free-form deformations based on B-splines has been previously described for registration of breast MR images (12). However, the current method uses only local affine transformations, allowing very fast image resampling during optimization. The extent of deformation permitted at each step is constrained to ensure a one-to-one mapping, promoting topographic consistency in the resulting images.
Evaluation of MetPET in Brain Tumors
A software utility was developed in Python (Python Software Foundation) to implement a standardized method for comparing MetPET scans in patients with brain tumors with the normal methionine uptake map. The output is presented as a “RatioMap”—an image showing the ratio of uptake in each voxel to the corresponding voxel in the normal map.
Application of the method in brain tumors was evaluated in patient sample C (6 WHO grade II, 6 grade III, and 6 grade IV gliomas) by correlating the ratios obtained using the standard method (ratio of tumor to contralateral reference region) with the ratio of tumor to normal map for the corresponding ROI. ROIs were also placed at the area of the highest ratio to the normal uptake map. Pearson product moment correlation coefficients and Spearman rank correlation coefficients were calculated to identify changes in the correlation between the methods. The extent of lesions that exceed the 1.3-fold of normal uptake was analyzed in comparison with the same threshold using a simple scaling of images relative to the contralateral tumor region (13).
For evaluation of the influence of coregistration on the results, the analysis was performed using both the nonlinear algorithm described here and an affine registration for comparison. MRI data were used to further evaluate the anatomic efficacy of the PET-derived nonlinear coregistrations. For each of the patients for whom MRI data were available, the parameters of the nonlinear transformations used to fit the normal methionine uptake data to the individual patient scan were stored. This transformation was then applied to the ICBM single-subject MRI template to structurally normalize the MRI template to the patient's MetPET scan. Finally, the patient's own MRI scan was coregistered to the MetPET scan, using a rigid-body transformation, with the result that the individual MRI scan and the MRI template could be directly compared. This processing allowed the anatomic effects of the nonlinear transformation used to fit the normal methionine data to the individual patient scan to be visualized with the greater spatial resolution of the MRI data.
Intensity normalization of the PET data was performed by recalculating each voxel as the ratio to the mean for the whole brain as was used in the preparation of the normal uptake map. However, in abnormal scans this process may be influenced by abnormal uptake within the lesion and by any treatment effects. The effect of the presence of tumor on the intensity normalization process was evaluated by measuring the difference between the median normalized uptake in each dataset and the expected value of 1. The expectation is based on the assumption that the majority of voxels will be unaffected by the tumor and, hence, after effective coregistration and intensity normalization, will be similar to the corresponding voxel on the normal uptake map giving a ratio close to 1. The median value is used as it is a statistically more reliable measure of central tendency in a skewed dataset. This is important as the presence of tumor within the scan volume may have the effect of introducing a negative skew to the data by introducing voxels with a high ratio value. Conversely, the presence of cystic regions, necrosis, or other treatment effects may create low-uptake regions introducing a positive skew to the data.
In the case of poor-intensity normalization despite effective structural coregistration, the ratio to the normal uptake map for the majority of voxels not containing tumor would be consistent but not equal to 1. Additionally, the error introduced could be expected to be systematic, with higher-grade tumors being typically larger in volume and causing a greater increase in methionine uptake—hence, potentially introducing a greater normalization error. Therefore, an additional method of intensity normalization was included for comparison, applied as a post hoc correction. First, the natural logarithm of the ratios between each voxel and the corresponding voxel in the normal methionine uptake map was calculated after removal of the background, scalp, and extracranial structures. A correction factor was then calculated as the median of the logarithmic ratios and was subtracted from each voxel, making the median of the logarithmic ratios equal to 0. An exponential function is applied to convert these values back to methionine uptake ratios with a corrected median of 1.
RESULTS
Development and Evaluation of a Normal Methionine Uptake Map
Images displaying mean, SD, and CVs, calculated voxel-by-voxel, were prepared from the normal methionine data. As is typical of amino acid PET images, high intraindividual variability was seen before intensity normalization (mean CV = 48.0%). Intensity normalization was performed by recalculating the images as ratios to whole-brain mean uptake. The relative efficacy of affine and nonlinear coregistration methods could then be evaluated. The mean CV fell to 24.0% after normalization and affine coregistration. However, errors in coregistration visualized as local increases in CV could be seen around the edge of the brain, around the ventricles, and at the interface between white and gray matter (Fig. 1). These errors were reduced by the use of the nonlinear coregistration algorithm, with the mean CV being further reduced to 19.3%.

Effect of coregistration method on voxel-by-voxel interindividual variability. (Upper) Affine coregistration with normalization to whole-brain mean uptake. (Bottom) Nonlinear coregistration with normalization to whole-brain mean uptake.
With nonlinear coregistration and intensity normalization, the mean CV for individual regions of the brain was 4.2% (range, 2.3%–8.3%), and consistent differences in methionine uptake between brain regions could be clearly seen (Fig. 2). This consistency in the distribution of uptake ratios between individuals supports the concept of analyzing MetPET scans by comparison with population normal values if appropriate normalization is used.

Distribution of normal methionine uptake between anatomic regions (box plot demonstrating the upper and lower quartiles, median and range with outliers (○), and extreme cases (*) identified as falling beyond 1.5× and 3× the interquartile range, respectively).
Application of Normal Methionine Uptake Map and Nonlinear Algorithm to Evaluation of MetPET in Brain Tumors
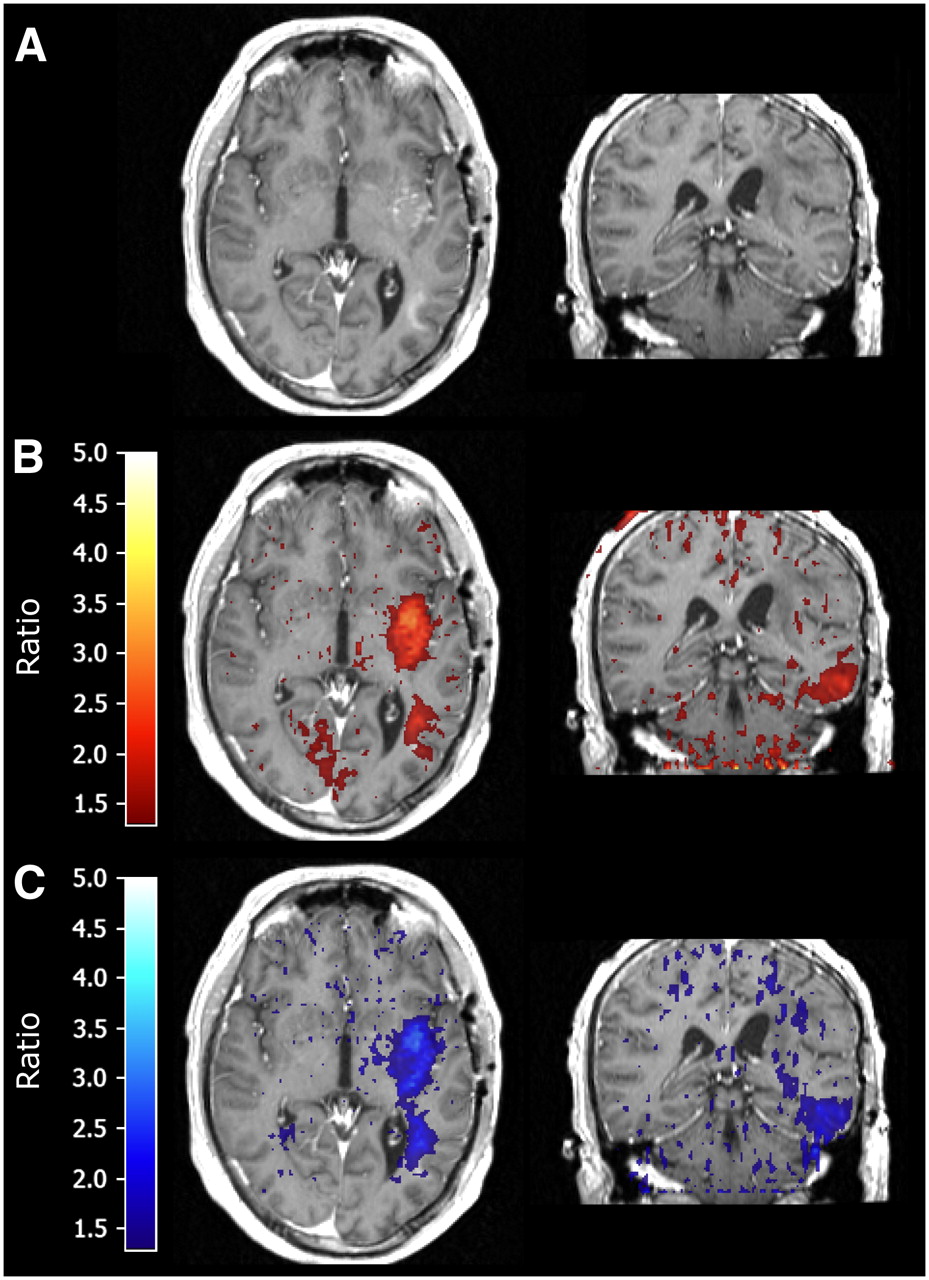
Visual comparison of images derived from the ratio of an individual scan to the normal uptake map, with those reflecting the ratio to a single reference value, revealed similar increases in the methionine uptake ratio within the core of the tumor. However, images of the ratio to the normal map frequently revealed evidence of an increase in methionine uptake in regions of white matter that could not be identified using the standard method, and that is consistent with the findings on contrast MRI (Fig. 3). A threshold value of 1.3 was used to delineate tumor for both methods based on previously published results using a single reference value (13). This pattern of increased methionine uptake in white matter regions that could be identified only using the ratio to the normal uptake map was evident in 10 of the 15 cases for which MRI data are available to accurately delineate gray and white matter regions. White matter changes were seen adjacent to the tumor, crossing the midline, and, in some cases, distal to the main tumor. The additional region of abnormality was typically more extensive in high-grade tumors than in low-grade tumors. This included a grade IV tumor that appeared to be multifocal using the standard methionine analysis, with 2 abnormal regions separated by a white matter tract, but which appears as a single contiguous tumor on the ratio image (Fig. 4).

(A) MetPET image in glioblastoma multiforme. (B) Ratio to contralateral reference region. (C) Ratio to contralateral reference region fused with postcontrast T1-weighted MRI. (D) RatioMap (voxel-by-voxel ratios to normal uptake map). (E) Ratio to normal uptake map fused with postcontrast T1-weighted MRI. Ellipses = evidence of white matter infiltration identified by ratio to normal uptake map and corresponding to contrast uptake on MRI (minimum threshold for fusion images = 1.3).

Glioblastoma multiforme displaying multifocal appearance after standard analysis shown as contiguous abnormality spanning white matter region on ratio to normal uptake map. (A) Postcontrast T1-weighted MRI. (B) Voxels from MetPET scan exceeding 1.3× contralateral reference region fused with MRI (standard analysis). (C) Voxels from MetPET exceeding 1.3× normal uptake data fused with MRI.
Tumor extent in gray matter regions was very similar between the 2 methods, although in 2 cases the extent was difficult to evaluate using the standard method. These tumors were adjacent to apparently uninvolved occipital gray matter, which exhibited baseline uptake that exceeded the threshold value derived from a contralateral reference region located in parietal or temporal cortex. In one further case, the standard analysis was suggestive of tumor extension into the adjacent frontal cortex, which was not identified using the ratio to the normal uptake map. However, no abnormality could be seen in this region on the patient's MRI scan, so the significance of this finding is uncertain. Peak methionine uptake in tumors spanning white and gray matter was typically found to be in previously gray matter areas; the maximal increase in uptake ratio was commonly seen in white matter (Fig. 5).

(A) Profile of methionine uptake ratio across an anaplastic astrocytoma showing relative changes in uptake ratio in white and gray matter regions. Note maximal methionine uptake ratio in gray matter region using both ratio to single reference value and ratio to normal uptake map but maximal difference between analysis methods evident in white matter region. (B) MetPET and (C) T1-weighted MRI showing line of profile through temporal lobe and tumor (distances measured from medial to lateral).
Evaluation of the efficacy of the nonlinear coregistration algorithm was performed for the 15 patients for whom contemporary MRI data were available. Reapplying the PET-derived nonlinear transformations to the MRI template revealed minor inaccuracies in the coregistration that were most common at the vertex, the frontal poles, and the inferior aspect of the cerebellum. These appeared as an apparent discrepancy between the contours of the brain surface and the fitted template of a magnitude similar to the resolution of the PET image from which the transformation matrix was derived (typically 2–6 mm). Mass effect from the tumors, including minor midline shift, was compensated for well by the algorithm supporting the concept that appropriate reference regions were applied (Fig. 6). Ventricular enlargement was evident in 5 of the MRI scans that was not fully compensated for. This would have resulted in uptake ratios for voxels within the ventricles being calculated using inappropriately high reference values. This reflects a weakness in the coregistration but, in the context of this study, the resulting ratios would always be <1, well below the threshold value, and, hence, would not alter the evaluation of the tumor.

Evaluation of efficacy of nonlinear coregistration (contour delineating brain outline on T1-weighted MRI displayed on all images for comparison). (A) MetPET scan. (B) Normal methionine uptake map after nonlinear coregistration to patient scan. (C) T1-weighted MRI (note mass effect with midline shift). (D) Nonlinear transformation derived from coregistration of normal methionine uptake map to patient scan reapplied to ICBM single-subject MRI template.
Methionine uptake for a circular ROI (13-mm diameter) placed at the area of highest apparent methionine uptake within the 18 primary brain tumors was first evaluated using the ratio to a mirrored contralateral reference region. These results were compared with the mean value for a ROI placed at the corresponding location in an image mapping the ratios of each voxel in the subject scan to the corresponding voxel in the normal uptake map. The correlation between these 2 sets of results was found to be consistently high, although some variance was seen with the methods of coregistration and intensity normalization applied (Table 2). When intensity normalization was performed by recalculating each voxel as a ratio of the mean whole-brain methionine uptake, Pearson product-moment correlation coefficients were 0.94 (r = 0.94, P < 0.001, n = 17) using an affine coregistration method and 0.96 (r = 0.96, P < 0.001, n = 17) using a nonlinear technique.
Tumor Grades and Effect of Coregistration/Normalization Method
The effect of the presence of the tumor on the efficacy of intensity normalization could be seen with grade 2 tumors having a median ratio after mean uptake normalization of significantly closer to 1 than the high-grade tumors (Table 3). This is in keeping with the other characteristics of these tumors, which are typically smaller and have a lower methionine uptake ratio and, hence, have less effect on the normalization process. This effect of tumor grade was negated by correcting the intensity normalization such that the median of the ratios between corresponding voxels in the subject scan and normal map was approximately equal to 1. This also resulted in a further small improvement in the correlation between tumor uptake ratios calculated using the standard method and a corresponding ROI in the normal uptake map. Correlation coefficients of 0.95 (r = 0.95, P < 0.001, n = 17) and 0.97 (r = 0.97, P < 0.001, n = 17) for affine and nonlinear coregistrations, respectively, were obtained (Fig. 7A).

(A) Correlation of ratios obtained between methionine uptake in tumor to contralateral reference vs. tumor to corresponding region in normal methionine uptake map using median ratio intensity normalization and nonlinear coregistration ( = outlier; see text). (B) Separation of low- and high-grade gliomas using maximal ratio to normal uptake map.
Change in Efficacy of Intensity Normalization Methods with Different Tumor Grades
Results obtained using the ratio to a reference region were consistent with previously published data (1), with low-grade gliomas displaying a mean ratio of 1.78 (range, 1.61–1.92; SD, 0.12; n = 6) and high-grade gliomas displaying a mean ratio of 2.84 (range, 1.84–4.92; SD, 0.88; n = 12). One scan was not included in the statistical analysis as the presence of tumor in the mirrored reference region of a “butterfly” glioma produced an artificially low ratio to the standard method. The difference between the ratios obtained using contralateral hemisphere and normal map for reference values in this individual was 2.44, more than 10 SD greater than the mean difference of 0.21 (SD, 0.17; n = 17) for the remaining tumors.
Evaluation of ROIs of the same size placed at the regions reflecting the highest ratio between uptake in the patient scan and the normal map allowed separation of low-grade and high-grade gliomas in this sample (Fig. 7B). The mean ratio for grade II gliomas was 1.75 (range, 1.53–2.10; SD, 0.20; n = 6) and the mean ratio for grade III and IV gliomas was 3.48 (range, 2.20–6.45; SD, 1.30; n = 12). Using the standard single reference value method, one anaplastic astrocytoma fell within the range of the low-grade gliomas. The corresponding mean uptake ratios were 1.78 (range, 1.61–1.92; SD, 0.12; n = 6) for grade II and 2.84 (range, 1.84–4.92; SD, 0.88; n = 12) for grade III and IV gliomas. In keeping with previous studies of MetPET in primary brain tumors, grade III and IV tumors could not be reliably separated.
DISCUSSION
The described method for scan analysis has been developed as a clinically relevant method that has several advantages over other semiquantitative methods for evaluating MetPET images. When a single reference value is used to evaluate the methionine uptake ratio, the precise location from which it is derived can significantly affect the resulting value. The results that we have presented show consistent differences in methionine uptake between brain regions, including differences between adjacent gray matter regions (Fig. 2). This supports the concept of interpreting scans by reference to population normal values but highlights the difficulty in, for example, selecting a truly representative region of gray matter in which to place a reference ROI. Our thresholded RatioMap images, displaying simple voxel-by-voxel ratios between the patient scan and the normal uptake map, demonstrate changes within white matter regions that are not seen when a single reference region is used. This may directly result from the location of the reference ROI, which is typically within cortical gray matter. As the median uptake in white matter is significantly lower than that in gray matter, even moderate increases in the uptake ratio for white matter regions are unlikely to exceed a threshold derived from a gray matter reference value and, hence, white matter infiltration will be underestimated or even missed (Fig. 5). This reduces the sensitivity of MetPET to white matter infiltration, which may be significant if it is to be used for treatment planning.
The white matter changes demonstrated are in keeping with the findings on contrast MRI and with the known propensity of gliomas to infiltrate along white matter structures (14,15). However, confirming whether this increase in methionine uptake is due to tumor infiltration or has another cause, such as the metabolic demands of the local immune response, will require further validation. The threshold value of 1.3 used in this study to delineate tumor infiltration is based on previous publications using a single reference value (13). As we have shown that the ratio between methionine uptake in tumor and the normal uptake map correlates very closely with the results obtained using this standard method if corresponding reference regions are selected, using the same threshold value is appropriate for validation of the new method. However, by using reference values that are appropriate to each voxel we can now visualize different magnitudes of change in different regions of the brain that could not be seen previously. This warrants further investigation and may require different threshold values for tumor infiltration in different brain regions.
High inter- and intraindividual variability in MetPET images has previously precluded the evaluation of these scans by comparison with population normal values. Application of the nonlinear coregistration algorithm and the intensity normalization methods detailed here allows for the accurate comparison of images, in a reasonable time scale, using standard desktop computers. Through the development of the normal methionine uptake map, a consistent distribution of methionine uptake ratios between individuals for given regions of the brain can be demonstrated. This consistency between individuals is a prerequisite for the interpretation of images by comparison with population-derived normal values. Although we have proposed weaknesses in the standard analysis of methionine uptake data for the evaluation of tumor infiltration, the clinical value of the ratio between the peak uptake and reference value has been clearly demonstrated in the literature. Therefore, the ability to replicate this assessment of the peak uptake as an indication of tumor grade is a further minimum requirement for a novel analysis method. We have demonstrated a consistently high correlation between the results of a standard analysis of peak methionine uptake and the corresponding evaluation of the ratio to our population normal uptake data, with some variation dependant on the exact methodology applied.
Reapplying the PET-derived nonlinear transformations to the MRI template allows the structural effects of the coregistration algorithm to be visualized more clearly than is possible with the PET data alone. Local mass effect around the tumor did not lead to significant failures in the coregistration, which is an important finding for the use of this algorithm in the presence of pathology. However, the failure to adequately correct for ventricular enlargement, although not detrimental to our evaluation of regions of high methionine uptake, requires further evaluation before the algorithm can be used in the presence of hydrocephalus or atrophy. The minor inaccuracies in coregistration noted at the edges of the brain are likely to result in part from the transformation of the MRI with a deformation mesh derived from PET data that have a significantly lower resolution. In addition, individual variability in the arrangement of the cortical gyri is compensated for in the PET data by the probabilistic nature of the averaged methionine uptake map, whereas this is not the case for the single-subject MRI template.
The distribution of methionine uptake within the normal uptake map is in keeping with previous experience, but there are few published data on the subject other than in the context of normal aging (7). Uptake was highest in the cerebellum and occipital cortex, with the lowest uptake seen in white matter as would be expected. The highest interindividual variability after normalization to whole-brain mean uptake was seen in the brain stem and cerebellum (CVs of 8.3% and 6.1%, respectively). The cerebellum, in particular, has been proposed as a potential reference region for semiquantitative analysis of MetPET scans because of the low incidence of primary brain tumors in this region in adults (16). However, the combination of higher methionine uptake in cerebellum than in cortical regions and the high intraindividual variability may raise questions as to its use without further validation. Structural normalization of the normal methionine data to an established template (in this case, the ICBM single-subject template) facilitated the identification of anatomic regions in the resulting dataset for further analysis. This required the use of either MRI or another PET tracer, for which an established template already exists, as an intermediary target to prepare the initial spatially normalized methionine template. In this case we used a previously developed 18F-FDG template for this initial step, which had been prepared using the same nonlinear algorithm that we have used throughout this study. This provided a high-quality volumetric dataset from a well- characterized normal population as a target for coregistration.
Scan analysis in brain tumors was performed using a scripting language to execute several image-processing steps in a standardized manner. This is advantageous in both a clinical and a research setting; standardization of the scan analysis is likely to improve the reproducibility of the results obtained and reduces the dependence on the skill and experience of the operator. In our proposed method for the analysis of MetPET images, only the final placement of a ROI either at the region of highest methionine uptake in the original image or at the region of maximal change in the ratio image is left to the operator. In practice, after removal of the scalp and extracranial structures, identification of the region of maximal change in methionine uptake on the ratio image is straightforward and, hence, there is scope for computer assistance in this final step as well.
CONCLUSION
Evaluation of methionine uptake by comparison with a normal uptake map offers significant advantages over the standard use of a single reference value to calculate uptake ratios. The method that we have described makes this feasible in a clinical setting by enabling a normal uptake map to be aligned to a patient scan for analysis, in a reasonable time scale, using readily available technology. In patients with primary brain tumors, we have been able to replicate the results obtained using the standard method of image analysis while overcoming some of the difficulties typically associated with it. More importantly, we have been able to demonstrate changes in white matter that may be missed using standard analysis methods, which may provide an opportunity to image tumor infiltration of white matter tracts with greater sensitivity.
Acknowledgments
This work was funded in part by a grant from the Oglesby Charitable Trust.
Footnotes
-
COPYRIGHT © 2007 by the Society of Nuclear Medicine, Inc.
References
- Received for publication May 1, 2007.
- Accepted for publication September 6, 2007.


