


Abstract
We assessed the feasibility of dynamic 3-dimensional (3D) PET/CT tracking of 18F-FDG-labeled circulating progenitor cell (CPC) therapy during intracoronary injection, using a porcine model of acute myocardial infarction (MI). Methods: Human and porcine CPC were radiolabeled with 18F-FDG, with variation in temperature and incubation time to determine optimal conditions. For in vivo experiments, CPC were harvested before induction of infarction (using 90-min coronary balloon occlusion). At 48 h, animals underwent cardiac MRI to assess infarct size. A balloon catheter was placed in the infarct artery at the same location as that used for induction of MI, and during dynamic 3D PET/CT 3 × 10⁷ autologous 18F-FDG progenitor cells were injected through the central lumen using either (a) 3 cycles of balloon occlusion and reperfusion or (b) high-concentration, single-bolus injection without balloon occlusion (n = 3 for both protocols). Peripheral blood was drawn at 1-min intervals during cell injection. Results: Labeling efficiency was optimized by 30-min incubation at 37°C (human CPC, 89.9% ± 4.8%; porcine CPC, 91.6% ± 6.4%). Cell-bound activity showed a nonsignificant decrease at 1 h (human, 74.3% ± 10.7%; porcine, 77.7% ± 12.8%; P > 0.05) and a significant decrease at 2 h (human, 62.1% ± 8.9%; porcine, 68.6% ± 5.4%; P = 0.009). Mean infarct size was similar for both injection protocols (16.3% ± 3.4% and 20.6% ± 2.7%; P > 0.05). Dynamic scanning demonstrated a sharp rise in myocardial activity during each cycle of balloon-occlusion cell delivery, with a significant fall in activity (around 80%) immediately after balloon deflation. The latter was associated with a transient spike in peripheral blood 18F-FDG activity, consistent with the first pass of labeled cells in the systemic circulation. A single spike and gradual fall in myocardial activity was observed with high-concentration, single-bolus therapy. At 1 h, myocardial activity was 8.7% ± 1.5% of total injected dose for balloon-occlusion delivery and 17.8% ± 7.9% for high-concentration, single-bolus delivery (P = 0.08). Conclusion: Dynamic tracking during intracoronary injection of 18F-FDG-labeled CPC is feasible and demonstrates significant cell washout from the myocardium immediately after balloon deflation. High-concentration, single-bolus therapy may be as effective as balloon-occlusion delivery. This tracking technique should facilitate development of improved delivery strategies for cardiac cell therapy.
Intracoronary injection of circulating progenitor cells is a promising strategy for postinfarction myocardial repair. Initial human studies have demonstrated improved regional function and preservation of infarct-territory mass using this therapeutic approach (1–4). An ability to track the biodistribution of injected cells in vivo holds tremendous promise as a means of further refining this therapy (5).
Initial human studies using 18F-FDG-labeled stem cells tracked with PET/CT indicate that retention of intracoronary injected stem cells within the heart at 1–2 h is low (ranging from 0.2% to 39%, varying with the cell fraction used) (6,7). However, the dynamics of cell washout from the myocardium within the first hour of injection are unknown. Insights into early cell trafficking may facilitate the development of more efficient delivery strategies, which may in turn impact therapeutic efficacy. We tested the feasibility of dynamic in vivo 3-dimensional (3D) PET/CT tracking of 18F-FDG-labeled CPC during intracoronary injection in a porcine model of acute myocardial infarction (MI).
MATERIALS AND METHODS
This study was approved by and performed in accordance with guidelines of the Mayo Clinic Institutional Review Board and the Mayo Clinic Institutional Animal Care and Use Committee. The investigation also conforms to the Guide for the Care and Use of Laboratory Animals (8) published by the U.S. National Institutes of Health.
Derivation of CPC
Yorkshire pigs (30-40 kg, Larson Products; 7 animals total) were used for harvest of porcine CPC and for the in vivo model of MI. One pig did not undergo induction of MI but served as a normal control to confirm feasibility. CPC were also obtained from normal human volunteers for ex vivo studies to determine labeling efficiency. From both sources, mononuclear cells were harvested from peripheral buffy coat preparations in Ficoll-Paque Plus (Stem Cell Technologies, Inc.). Cells were washed 3 times in MCDB 131 supplemented with hydrocortisone, antibiotics, and 10 ng/mL vascular endothelial growth factor (VEGF). Cells were then resuspended in XVivo-15 medium (Biowhittaker) supplemented with VEGF (1 ng/mL) and seeded on fibronectin-coated plates at a density of 4.9 × 10³ cells per mm2 in a modification of previously described methodology (2).
Adherent cells were incubated at 37°C with DiI (1,1′-di-octadecyl-3,3,3,3′-tetramethylindocarbocyanine perchlorate)–labeled acetylated low-density lipoprotein (Ac-LDL) for 1 h and Alexa-Fluor 488–conjugated isolectin IB4 for 30 min (Molecular Probes). Fluorescence-activated cell sorting (FACS) was performed to identify cell-surface antigens on human and porcine CDC. Primary antibodies to CD31, CD105, von Willebrand Factor, eNOS, Flk-1, and VE-cadherin (R&D Systems) were used with secondary antibody detection with fluorescein isothiocyanate in each case. Isotype-matched IgG antibodies were used as controls, and the fluorescent intensity of stained cells was gated according to established methods.
Induction of MI
A closed-chest unconscious porcine model of acute MI was used (9). Each animal received prophylactic amiodarone (100 mg daily) and aspirin (325 mg daily) beginning 2 wk before induction of MI that was continued throughout the study. All animals also received lidocaine (60-mg intravenous bolus and infusion at 1.5–3.0 mg/min), unfractionated heparin (10,000 units intravenously), and benzathine penicillin (300,000 units intramuscularly) at procedure initiation. After anesthesia, mechanical ventilation with a Harvard apparatus was maintained on a fraction of inspired oxygen of 40%. Under sterile conditions, a carotid arterial cutdown was performed for placement of a 9-French arterial sheath. Fifty milliliters of blood were drawn into ethylenediaminetetraacetic acid (EDTA) tubes for progenitor cell isolation and culture as described. Through an 8-French coronary artery guide catheter, a slightly oversized angioplasty balloon catheter (1.1:1 balloon-to lumen ratio) was positioned in the middle portion of the left circumflex coronary artery and inflated to produce arterial occlusion for 90 min. Complete arterial occlusion was verified with angiographic contrast every 15–30 min. After the procedure, the arterial sheath was removed, followed by animal recovery and habitation. All animals survived to the end of PET acquisitions and were sacrificed thereafter.
18F-FDG Labeling of CPC
Forty-eight hours after induction of MI (pigs) or blood sampling (human volunteers) progenitor cells were harvested from culture. Porcine and human cells were detached using 0.5 mM EDTA. All cells were washed twice in phosphate-buffered saline (PBS). Cells were incubated under sterile conditions using previously described methodology (6) in a 10-mL test tube containing 100 MBq 18F-FDG in serum-free PBS (pH 7.2) and 10 U/mL heparin (Roche) and 0.1 U/mL recombinant human insulin (Novo Nordisk). To investigate the optimal temperature for labeling, porcine and human samples were divided into 3 groups: incubation for 30 min at 20°C, 28°C, or 37°C. On the basis of the results suggesting the highest labeling efficiency at 37°C, subsequent labeling studies were performed at 37°C. Cells were incubated in a lead-shielded incubator with gentle swirling for 10, 20, 30, 45, or 60 min. Labeled cell solutions were then centrifuged in a 3-step washing process in heparinized PBS (5 min at 150g each time). Activity in the final cell pellet and supernate was measured for determination of labeling efficiency. Stability of 18F-FDG-CPC resuspended in autologous serum at 37°C was assessed by measurement of cell-associated activity at baseline, 1 h, and 2 h after labeling.
For in vivo porcine experiments, 3 × 10⁷ viable cells were resuspended in 12 mL of XVivo-10 medium (Biowhittaker) for balloon-occlusion intracoronary injection or in 4 mL of XVivo-10 medium for high-concentration, single-bolus intracoronary injection. The total activity of this cell solution was determined using a dose-calibrator immediately before injection. Separate aliquots were maintained in solution at the same cell concentration for measurements of 18F-FDG elution at various time points after injection. Cell viability was assessed using the trypan-blue exclusion method. Labeling efficiency was defined in this study as the percentage of cell-bound activity in the final cell solution (total activity of the solution minus activity in the supernatant, divided by total activity) after incubation and washing steps had been completed.
Baseline MRI Studies
Cardiac imaging with MRI was performed on all animals at 48 h after infarction but before progenitor cell therapy. A 1.5-T MRI system (Signa Horizon 9.0; GE Healthcare) with gradient strength of 22 mT/m was used, and a phased-array surface coil was used for each study. All images were electrocardiographically gated and acquired during suspended respiration (the animal was sedated and ventilated for the procedure). A detailed description of the MRI protocol is provided in a supplemental appendix (supplemental material is available online only at http://jnm.snmjournals.org).
In Vivo CPC Infusion and Simultaneous Systemic Blood Sampling
Animals were anesthetized, and a marginally oversized over-the-wire angioplasty balloon (1.1:1 balloon-to-lumen ratio) was placed at the same angiographic position as that used for induction of infarction. The balloon and catheter system was then secured in place. The animal was transported to the PET suite using a customized cradle that ensured stability of the catheter system during transfer.
Six pigs underwent induction of MI. These animals were divided into 2 groups, each containing 3 pigs. Group 1 underwent intracoronary injection of cell therapy using a balloon-occlusion delivery strategy. Group 2 underwent intracoronary injection of cell therapy using a high-concentration, single-bolus injection strategy (without balloon occlusion). For group 1, the intracoronary balloon was inflated at the same location within the coronary artery as that used for induction of MI, and a 4-mL aliquot (1 × 10⁷ cells) of the 12-mL autologous CPC cell suspension was infused via the central lumen. The balloon remained inflated for a total of 4 min to prevent backflow of cells and to produce stop-flow beyond the site of inflation, and then deflated for a 4-min period of reperfusion. This cycle was repeated 2 more times in the same fashion, for a total infusion of 12 mL of cell suspension (containing 3 × 10⁷ cells) per animal. For animals receiving high-concentration, single-bolus therapy, a 4-mL cell solution containing 3 × 10⁷ labeled cells was injected through the central lumen of the balloon catheter but without inflation of the balloon. The cell bolus was injected over a 2-min period.
For both injection protocols, serial blood samples were drawn from the arterial sheath at 1-min intervals, the first sample to coincide with the beginning of the first injection cycle. Two samples of 5 mL were drawn at each time point. One sample was centrifuged immediately, and the supernatant was aspirated and passed through a 20-μm filter to remove all cells and debris. Both samples (whole blood and supernatant) were then passed through a γ-counter (1480 Wallac Wizard; Perkin Elmer), and the activity of each sample was measured in counts per minute. Percent cell-bound activity of the whole-blood sample was calculated by subtracting the activity of the supernatant from activity of the whole blood and dividing this figure by the activity of the whole-blood sample.
PET/CT Tracking of Intracoronary Injected 18F-FDG-CPC
Cardiac imaging with PET/CT was performed on a Discovery RX system (GE Healthcare); the PET component of this scanner has a high sensitivity (7.3 cps/kBq) (10). A CT scout acquisition was acquired from which the scan range of the helical and PET scans were prescribed, with the myocardium centered within the axial field of view. A helical CT scan was acquired with 140 kVp, 120 mA, 0.5-s rotation speed, and a pitch of 1.75. The slice thickness was 3.75 mm and the slice interval was 3.27 mm. Subsequently, a dynamic 3D PET acquisition was performed, with 30 frames at 1 min each. The PET acquisition was started on the injection of the labeled cells; the injected activity was 416.25 ± 160.7 kBq (11.25 ± 4.34 μCi). Immediately after the dynamic acquisition, a series of whole-body acquisitions were performed. Scout and helical CT images were acquired, followed by three 3D whole-body PET acquisitions consisting of 3 bed positions, 3 min per bed position, and a 7-slice overlap.
The PET images were reconstructed with Fourier rebinning ordered-subset expectation maximization using 21 subsets with 3 iterations and a 5-mm full width at half maximum gaussian postprocessing filter. The PET data were reconstructed into a 450-mm field of view with a pixel size of 3.52 mm and slice thickness of 3.27 mm. For all reconstructions, random events were estimated from the singles rate of each crystal, the CT images were used for the attenuation correction, and scatter was corrected for using a model-based technique for the 3D acquisition.
The PET/CT data were imported into PMOD (version 2.75; PMOD Technologies) for analysis. Regions of interest were drawn around the myocardium on the CT data and then copied onto the dynamic PET data. Time–activity curves were generated and were converted to absolute units of activity through the application of a cross-calibration factor. The cross-calibration factor was derived from acquisitions of spheres of known size and volume and from the measurement of an aliquot of activity in the γ-counter. In this manner, corrections are made for both the effects of partial volume and the different geometries of the scanner and γ-counter.
Data Analysis
All data are expressed as mean ± SE. A minimum of 3 independent in vitro experiments was performed for each set of labeling conditions. Comparison of results between multiple groups in cell labeling and in vivo experiments was by ANOVA. Statistical significance was set a priori at P < 0.05.
RESULTS
CPC Phenotype
After 48 h of culture, both porcine and human CPC demonstrated uptake of both Ac-LDL and isolectin IB4 (supplemental Fig. 1). These cells also expressed typical endothelial proteins, including von Willebrand Factor, eNOS, Flk-1, and VE-cadherin (supplemental Fig. 1).
Effects of Temperature and Incubation Time on 18F-FDG Cell Labeling
In initial experiments, CPC were incubated for 30 min at 20°C, 28°C, or 37°C. Labeling efficiency at 20°C was 41.2% ± 11.2% (human) and 30.3% ± 10.8% (pig), at 28°C was 53.6% ± 7.4% (human) and 54.3% ± 9.3% (pig). As shown in Figure 1A, labeling efficiency was significantly increased for both human and porcine CPC with incubation at 37°C (92.7% ± 5.9% and 90.4% ± 6.1%, respectively; P < 0.01). There was no significant difference between labeling at 20°C and 28°C. There was no significant difference between human and porcine cells with respect to labeling efficiency at any given temperature (P > 0.05 for each).

Labeling with 18F-FDG and in vivo detection of human and porcine progenitor cells. All P values are nonsignificant except *P < 0.05. (A) Comparison of labeling efficiency at incubation temperatures of 20°C, 28°C, and 37°C. (B) Comparison of labeling efficiency after incubation for periods of 10, 20, 30, 45, and 60 min at 37°C. (C) Elution of radiolabel by CPC at 1 and 2 h. (D) Detection of intracoronary injected 18F-FDG progenitor cells in inferolateral territory of normal heart in vivo.
On the basis of these results, in subsequent experiments CPC were incubated at 37°C for incubation times ranging from 10 to 60 min (Fig. 1B). Labeling efficiency was 48.6% ± 6.1% (human) and 40.1% ± 6.5% (porcine) at 10 min and 60.3% ± 5.2% (human) and 55.2% ± 7.8% (porcine) at 20 min. The difference between labeling at 10 and 20 min did not achieve statistical significance. However, labeling efficiency was significantly increased for both human and porcine CPC with incubation for 30 min (89.9% ± 4.8% and 91.6% ± 6.4%, respectively; P < 0.01). Incubation for periods longer than 30 min did not result in any additional increase in labeling efficiency above that observed at 30 min (P > 0.05 for both human and porcine cells).
Assessment of stability of cell-bound 18F-FDG after labeling at 37°C for 30 min is presented in Figure 1C. Labeling efficiency of 18F-FDG-CPC resuspended for 1 h in autologous serum at 37°C decreased from 89.9% ± 4.8% to 74.3% ± 10.7% (human) and from 91.6% ± 6.4% to 77.7% ± 12.8% (porcine) (P > 0.05 for both when compared with baseline labeling). At 2 h, cell-bound activity had significantly declined when compared with baseline, to 62.1% ± 8.9% (human) and 68.6% ± 5.4% (porcine) (P < 0.01 for both human and porcine CPC).
Baseline MRI Characteristics and Cell Labeling for In Vivo Experiments
Six pigs underwent induction of MI. Baseline characteristics of experimental pigs in the 2 groups (group 1, balloon-occlusion delivery; group 2, high-concentration, single-bolus delivery) are presented in Table 1. There was no significant difference in any of the following baseline characteristics between group 1 and group 2 (P > 0.05 for each comparison). Body weight averaged 42.1 ± 0.2 kg in group 1 and 41.7 ± 0.5 kg in group 2. Baseline ejection fraction was 46.6% ± 4.2% (group 1) and 44.9% ± 5.1% (group 2). Left ventricular mass was 89.1 ± 6.1 g (group 1) and 86.5 ± 5.3 g (group 2). Infarct size was 14.5 ± 2.9 g or 16.3% ± 3.4% of LV mass (group 1) and 17.8 ± 1.9 g or 20.6% ± 2.7% of LV mass (group 2). The infarct zone was localized by delayed gadolinium enhancement to the inferolateral territory in all animals. End-diastolic volume was 64.2 ± 2.9 mL (group 1) and 67.3 ± 5.2 mL (group 2). End-systolic volume was 35.2 ± 5.8 mL (group 1) and 33.8 ± 4.9 mL (group 2). Cardiac output was 2.9 ± 0.1 L/min (group 1) and 2.7 ± 0.5 L/min (group 2). Stroke volume was 28.7 ± 2.3 mL (group 1) and 25.5 ± 2.2 mL (group 2).
Characteristics of Experimental Animals at Baseline
Labeling efficiency, cell viability by the trypan blue exclusion method, and stability of 18F-FDG-CPC for each animal are presented in Table 2. In all cases, baseline labeling efficiency was >90% and cell viability was >98.5%. Specific activity of the injected cell solution ranged from 29.6 kBq (0.8 mCi) to 336.7 kBq (9.1 mCi) per 107 nucleated cells.
Labeling of CPC with 18F-FDG Among Experimental Animals
PET/CT Tracking of Intracoronary Injected 18F-FDG-CPC
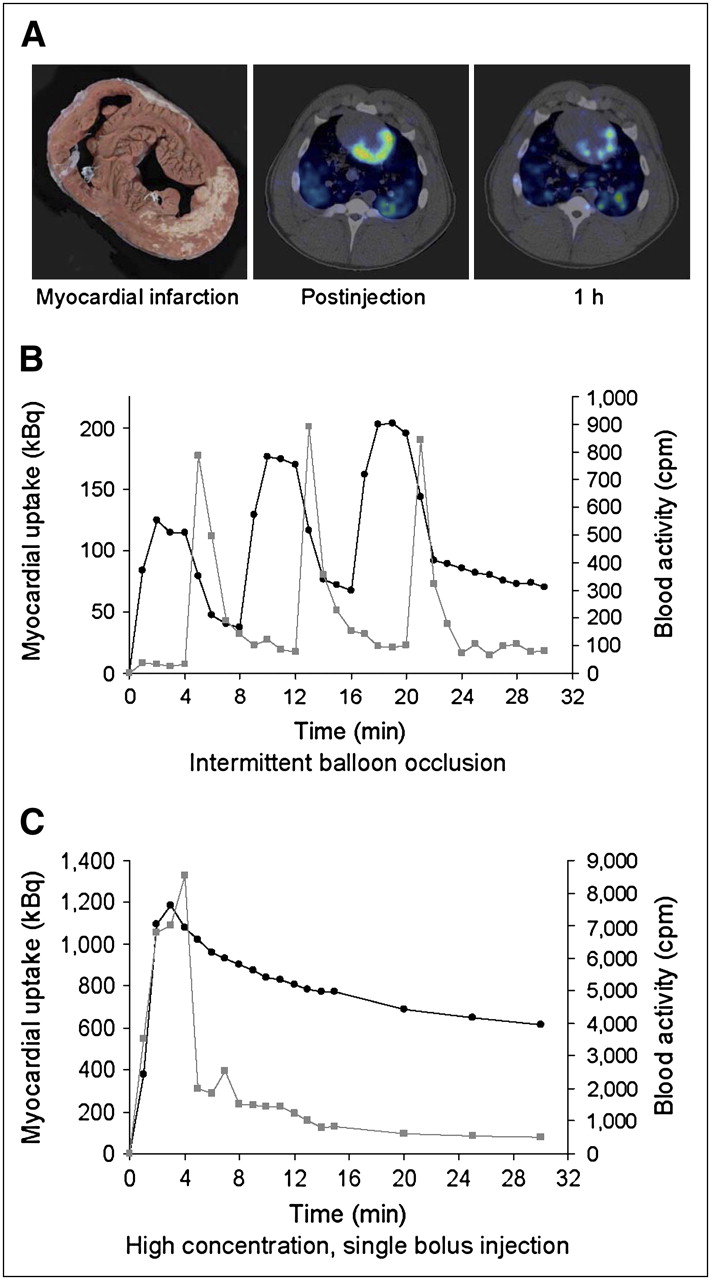
Feasibility of in vivo tracking of intracoronary injected 18F-FDG-CPC was first confirmed in a normal pig, whereby intracoronary injection of labeled cells using a balloon-occlusion technique resulted in detection of a PET signal that was localized on CT to the appropriate (left circumflex) myocardial territory (Fig. 1D). All subsequent experiments were performed in pigs with MI (n = 6 pigs).
Group 1 pigs were injected with 18F-FDG-CPC using a balloon-occlusion delivery strategy as described. 3D PET acquisition commenced with the first balloon inflation. Activity was localized to the appropriate left circumflex myocardial territory in each case (Fig. 2A), correlating with the MRI infarct zone. Quantitative assessment of cell trafficking in the myocardium during the cell delivery phase is illustrated in Figure 2B. This demonstrates 3 distinct, sharp increases in myocardial activity, each of which coincides exactly with the timing of balloon inflation and cell injection. Peak activity was reached within 2 min of balloon inflation, coinciding exactly with the completion of cell injection. Activity within the myocardium remained stable during the remaining 2 min of balloon inflation. Subsequent balloon deflation was associated with a marked drop in myocardial activity, with the loss of approximately 80% of peak activity per cycle with each balloon deflation (Fig. 2B). This abrupt drop in myocardial activity with each balloon deflation was associated on each occasion with the detection in the systemic arterial circulation of a transient spike of cell-bound (>90%) activity (Fig. 2B). This characteristic pattern of activity within the myocardium and systemic circulation was observed for all 3 animals.

Dynamic tracking of 18F-FDG-labeled CPC during intracoronary injection. (A) From left to right: gross, unstained specimen shows extensive inferolateral MI (image is oriented to match subsequent PET/CT images); single frame of dynamic 3D PET/CT from same animal taken immediately after intracoronary injection shows myocardial activity localized to infarct territory and border zone; single frame from same animal taken 1 h after injection shows significant decrease in regional activity when compared with postinjection image. (B) Time–activity curves for myocardium (black line) and peripheral blood (gray line) during intracoronary injection using 3-cycle balloon-occlusion technique. Balloon was inflated for 4 min during coronary injection and subsequently deflated for 4 min during each cycle. Blood samples were drawn at 1-min intervals. (C) Time–activity curves for myocardium (black line) and peripheral blood (gray line) during high-concentration, single-bolus intracoronary injection.
Group 2 pigs received 18F-FDG-CPC administered as a high-concentration, single-bolus injection of 3 × 10⁷ cells suspended in 4 mL of medium. A balloon catheter was used for intracoronary delivery but for these experiments the balloon itself was not inflated. Again, activity was localized to the appropriate left circumflex myocardial territory in each case, correlating with the MRI infarct zone. Quantitative assessment of cell trafficking during and after cell injection is presented in Figure 2C. For each animal, this was characterized by an initial sharp rise in myocardial activity over the 2- to 3-min cell injection, followed by a steady fall in activity once the injection had been completed. A rise in cell-bound (>90%) activity in the systemic circulation was detected from 1 min after the start of cell injection, peaking approximately 1 min after completion of cell injection (Fig. 2C).
PET acquisition was continued for 1 h after injection in each case. Peak activity during cell injection, 30-min activity, and 1-h activity within the myocardium were measured as a proportion of total initial injected activity (Fig. 3). For pigs treated with a balloon-occlusion delivery strategy, mean peak activity was estimated at 22.4% ± 3.1%, 30-min activity was 13.1% ± 2.1%, and activity at 1 h was 8.7% ± 1.5% of initial injected dose. For pigs treated with a high-concentration, single-bolus injection strategy, mean peak activity was 36.9% ± 6.8%, 30-min activity was 23.48% ± 10.2%, and activity at 1 h was 17.8% ± 7.9% of initial injected dose. Peak activity was significantly greater after high-concentration, single-bolus injection when compared with balloon-occlusion delivery (P < 0.05), but for 30-min and 1-h time points no significant difference was detected. For both groups 1 and 2, most of the injected activity at 1 h was localized to the lungs (>60%), with mild accumulation observed in the liver and spleen.
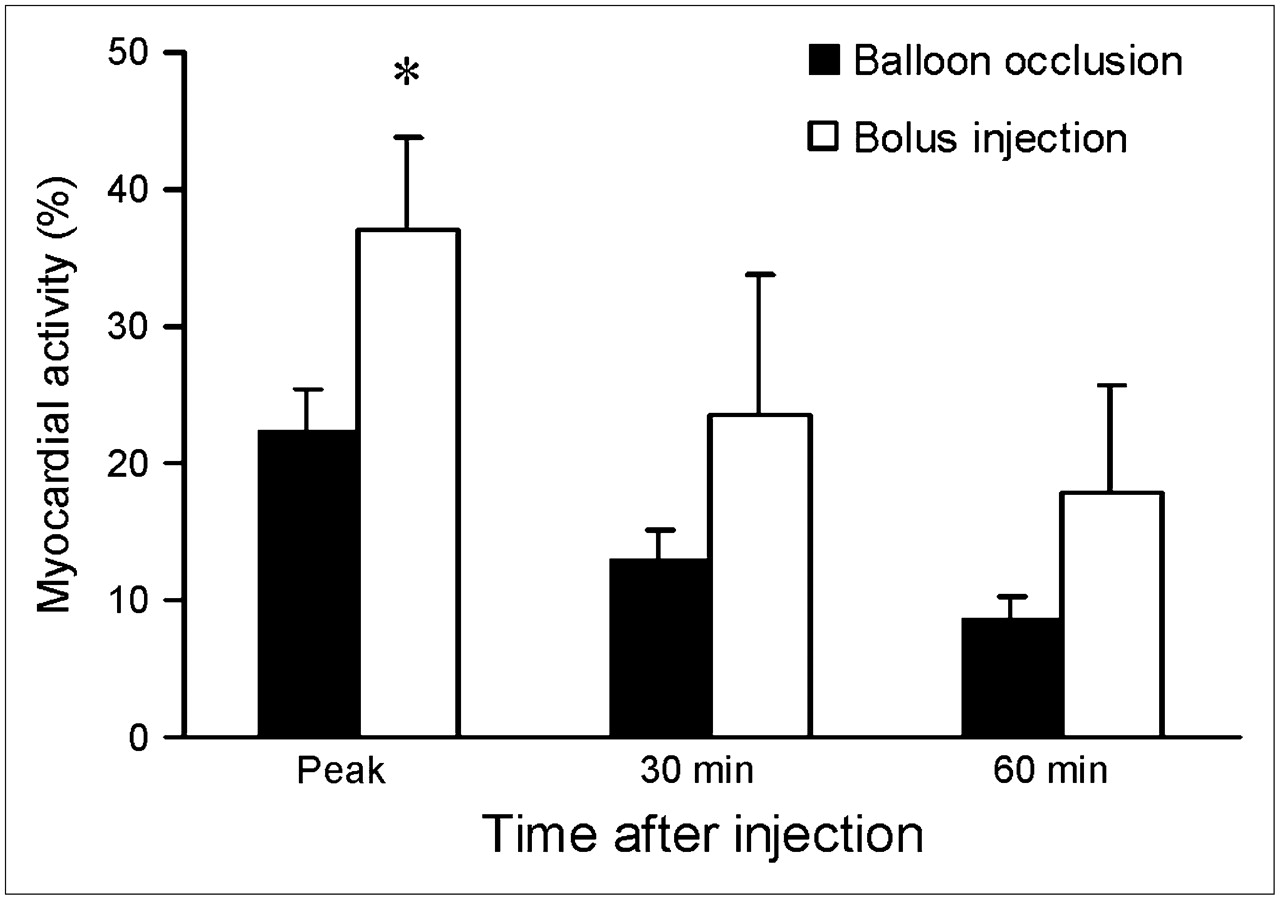
Comparison of myocardial activity (measured as percentage of total injected activity) after balloon-occlusion delivery or high-concentration, single-bolus therapy at various time points. *P < 0.05 (ANOVA) for comparison of injection techniques at any given time point.
DISCUSSION
The major finding of this study was that 18F-FDG-CPC could be tracked in vivo during and after intracoronary injection using a quantitative PET/CT technique that provided excellent spatial and temporal resolution. Cells were administered in a clinically relevant large-animal model of acute MI, using a cell-delivery strategy that has already been applied in human clinical trials (1–3,11–14) as well as a novel delivery approach.
Previous human studies of stem cell tracking in vivo have been limited by an unavoidable delay between the timing of cell injection and subsequent PET acquisition (6,7). Intracoronary injections must be administered under direct fluoroscopic guidance in the cardiac catheterization laboratory. Patients are then transferred from the catheterization area to the PET facility. This involves a delay of at least 1 h between cell injection and the start of cell tracking (6,7). Experimental studies using 111In-labeled cells have not performed dynamic scanning and have not used intracoronary delivery (15–17). As a result, the trafficking of injected cells during intracoronary cell delivery is not understood.
We evaluated an established balloon-occlusion cell-delivery strategy using “real time” in vivo tracking and observed a pattern of activity that is consistent with significant loss of 18F-FDG-CPC from the myocardium after each cycle of balloon deflation. This was confirmed by first-pass detection in the systemic circulation of transient high levels of cell-bound activity that coincided with balloon deflation. These data identify an immediate washout of cells after reperfusion as a key target for strategies designed to augment myocardial engraftment. The effect of in vitro modification of progenitor cells (e.g., using cytokines or growth factors to upregulate adhesion molecules and integrins such as αvβ3) (18), or other strategies varying cell dose or balloon-occlusion time, could be evaluated using the preclinical model we describe.
One such strategy may involve use of higher concentrations of injected cell therapy. We tested an approach using a 3-fold higher concentration of cells delivered without balloon protection. Our findings confirm that differences in delivery strategy can be reliably characterized using this in vivo tracking technique. Not unexpectedly, peak myocardial activity after cell injection was greater when high-concentration, single-bolus injection was compared with 3-cycle balloon-occlusion delivery. Interestingly, a trend toward enhanced cardiac engraftment at 1 h was also observed. These data suggest that increased progenitor cell/endothelial interfacing associated with a single high bolus injection may obviate the need for multiple cycles of balloon occlusion, injection, and reperfusion. Apart from the simplicity of this approach, this strategy also eliminates the risk of coronary endothelial injury due to balloon inflation that is inherent in the conventional balloon-occlusion strategy.
The clinical relevance of this animal model is underscored by similarities we have demonstrated between human and porcine CPC labeling characteristics. Furthermore, we have previously demonstrated preservation of infarct territory mass associated with improved regional systolic function after therapy with autologous CPC in the pig (Noel M. Caplice, unpublished data, June 2007), effects that are consistent with those observed in human trials of progenitor cell therapy (19).
This dynamic PET/CT cell tracking technique may be applicable in a clinical setting in the future. However, such use would require greater integration of diagnostic and interventional imaging modalities than are currently available. Transport of patients with coronary equipment in situ and the performance of intracoronary injections without fluoroscopic guidance are the main concerns, as such maneuvers may pose a small, but unacceptable, hazard to patients (particularly for delivery strategies involving coronary balloon inflation). The ability to manipulate interventional catheters under fluoroscopic guidance is even more important for percutaneous intramyocardial injection of cell therapy, although assessment of engraftment after direct cell injection using an open surgical approach would still be possible in an experimental setting. Integrated fluoroscopy and PET/CT suites could overcome all of these limitations and greatly expand the scope of mechanistic insights that could be gained from human trials.
Limitations include the short half-life of 18F (110 min) and the relatively rapid elution of this radiolabel from the cells. The latter appears to be significant at 2 h, perhaps limiting specificity of the current technique to the first hour after injection. The development of radiolabels with longer half-lives and the evolution of labeling techniques that provide greater intracellular stability (without interfering with cell function) should further enhance the usefulness of this model.
Mean infarct size in this study was modest and did not result in significant impairment of left ventricular systolic function at 48 h after infarction in either of the 2 treatment groups. Use of the left anterior descending coronary artery for induction of infarction produces larger infarcts in pigs but is associated with prohibitively high mortality (up to 50%). Thus, the ability of this model to examine the impact of infarct size on cell engraftment may be somewhat limited.
CONCLUSION
The high-sensitivity, spatial and temporal resolution of this dynamic 3D PET/CT cell tracking technique offers exciting opportunities to enhance our understanding of early homing and engraftment after cell therapy. This technique may offer particular advantages as a means of optimizing novel dosing and cell-delivery strategies in a preclinical setting.
Acknowledgments
This work was supported by funding from the National Institutes of Health (grant HL66958) and the Irish Heart Foundation (Bristol Myers Squibb Traveling Fellowship).
Footnotes
-
COPYRIGHT © 2007 by the Society of Nuclear Medicine, Inc.
References
- Received for publication April 17, 2007.
- Accepted for publication June 27, 2007.


Jump to section
Related Articles
Cited By...
- An off-the-shelf artificial cardiac patch improves cardiac repair after myocardial infarction in rats and pigs
- CellGPS: Whole-body tracking of single cells by positron emission tomography
- 18F-FDG Labeling of Mesenchymal Stem Cells and Multipotent Adult Progenitor Cells for PET Imaging: Effects on Ultrastructure and Differentiation Capacity
- Microfluidic Single-Cell Analysis Shows That Porcine Induced Pluripotent Stem Cell-Derived Endothelial Cells Improve Myocardial Function by Paracrine Activation
- Cell Tracking and the Development of Cell-Based Therapies: A View From the Cardiovascular Cell Therapy Research Network
- Current Perspectives on Imaging Cardiac Stem Cell Therapy
- Assessment and Optimization of Cell Engraftment After Transplantation Into the Heart
- Reporter Gene PET for Monitoring Survival of Transplanted Endothelial Progenitor Cells in the Rat Heart After Pretreatment with VEGF and Atorvastatin
- Tracking Cell Fate With Noninvasive Imaging
- In Vivo Imaging of Stem Cells and Beta Cells Using Direct Cell Labeling and Reporter Gene Methods
- The Year in Molecular Imaging
- Collagen-Based Matrices Improve the Delivery of Transplanted Circulating Progenitor Cells: Development and Demonstration by Ex Vivo Radionuclide Cell Labeling and In Vivo Tracking With Positron-Emission Tomography