


Abstract
This study evaluates a new formulation of a 99mTc-labeled tropane derivate, 99mTc-NC100697, in a human volunteer study. Methods: Eighty healthy subjects (39 females, 41 males) underwent MRI and SPECT (injected dose [mean ± SD], 10.6 ± 1.4 MBq/kg). Forty subjects were investigated 30, 90, 180, 240, 360, and 480 min after injection, and another 40 subjects were imaged 240 min after injection. Specific striatal binding was assessed using 3 different approaches: 3-dimensional volumes of interest (VOIs) drawn on the coregistered MRI scans, manually placed predefined 2-dimensional regions of interest (ROIs), and observer-independent fully automated 3-dimensional VOI analyses based on coregistration of scans with a mean template of controls. Specific striatal dopamine transporter (DAT) binding was estimated for cohorts of ages of 21–30, 31–40, 41–50, 51–60, 61–70, and 71–80 y. The relationship between age and DAT binding was analyzed with linear, “broken-stick,” exponential, and logarithmic regression. Results: Serial SPECT scans revealed increasing values of specific DAT binding over time. Consideration of all important variables suggests an optimum imaging time at 4 h after injection. Average DAT binding for the total population was 1.1 ± 0.2 (striatum), 1.3 ± 0.2 (caudate), and 1.1 ± 0.2 (putamen), with mean putamen-to-caudate ratios of 0.83 ± 0.08 (manual 2-dimensional ROI method). A significant age dependency of striatal DAT binding, best described by a broken-stick (break-point age, 48 y) or logarithmic regression (both r = 0.76), with a lower decline observed in older than in younger subjects. Female subjects presented with slightly higher binding ratios than male subjects, more pronounced in pre- than in postmenopausal women. There was a high correlation between the 3 semiquantitative evaluations. Conclusion: The current study has demonstrated the effective use of 99mTc-NC100697 for estimating presynaptic striatal DAT binding. The comparison of different semiquantification methods showed that in clinical routine work, this tracer can be reliably evaluated without individual MRI data. Age and a slight sex dependency (especially in premenopausal women) of 99mTc-NC100697 binding should be taken into consideration. The data generated in this phase 1 study provides a basis for an age- and sex-matched normal database.
Imaging of the dopaminergic system provides a valuable tool for discriminating neurodegenerative parkinsonian syndromes with an associated presynaptic dopaminergic deficit from diseases without presynaptic neurodegeneration (e.g., essential tremor) (1–3). Several PET and SPECT ligands have proven to be suitable for imaging the dopamine transporter (DAT); however, the availability of most of these tracers for routine use is limited because they require cyclotron-produced radionuclides. Apart from the high costs, their use may be also limited by the distance between production sites and nuclear medicine departments.
99mTc-Labeled radiopharmaceuticals for DAT imaging would overcome these limitations and further facilitate DAT imaging in clinical routine (4–7). 99mTc is readily available on site and imaging with current γ-camera equipment is optimized for the 140-keV energy of the 99mTc γ-emission. The first successful application of a 99mTc-labeled compound for DAT imaging in humans was described by Kung et al. using 99mTc-2β[N,N9-bis(2-mercaptoethyl)ethylenediaminomethyl]-3β-(4-chlorophenyl)tropane (TRODAT-1) (5).
The aim of this study was to extensively evaluate 99mTc-NC100697, a new formulation of 99mTc-TRODAT-1, in a phase 1 human volunteer study to characterize striatal binding as well as physiologic age and sex dependencies.
MATERIALS AND METHODS
Subjects
Eighty healthy control subjects free of neurologic diseases (39 females, 41 males; age range, 23.8−78.0 y; mean age ± SD, 52.4 ± 16.4 y; 6 cohorts of ages 21–30 y [n = 14], 31–40 y [n = 7], 41–50 y [n = 10], 51–60 y [n = 17], 61–70 y [n = 21], and 71–80 y [n = 11]) were included in this prospective study. Each age group showed a sex distribution of approximately 1:1. All subjects had to fulfill predefined criteria of normality without any clinical significant abnormalities on MRI scans, physical examination, normal routine laboratory tests, electrocardiogram, and neurologic tests (criteria: Unified Parkinson Disease Rating Scale Part III score = 0; Hoehn and Yahr stage = 0; Mini-Mental State Examination score ≥ 28). No subject had current or chronic medication known to interfere with DAT binding. All subjects gave written informed consent. The study was approved by the ethics committee and the local authorities.
MRI
Each subject underwent MRI on a Magnetom Symphony 1.5-T scanner with quantum gradients (Siemens Medical Solutions). Fluid-attenuated inversion recovery (transverse: repetition time [TR] = 7,000 ms, inversion time [TI] = 2,500 ms, echo time [TE] = 74 ms; coronal: TR = 7,700 ms, TI = 2,500 ms, TE = 74 ms) and sagittal magnetization-prepared rapid gradient-echo (MP-RAGE) (TR = 1,360 ms, TE = 4.15 ms, isotropic voxel size of 1.0 × 1.0 × 1.0 mm) sequences were acquired.
Lesions within the basal ganglia, evidence of a tumor, and an abnormal high number of white matter lesions (depending on the patients' age) were considered as exclusion criteria.
Preparation of 99mTc-NC100697
Two kits, each containing 18 μg of the trifluoroacetate salt of NC100697 (TRODAT-1) (GE Healthcare), were simultaneously labeled with 740 MBq fresh pertechnetate eluate in 2 mL. Heated at 100°C for 20 min and cooled for 10 min at room temperature, the kits were pooled to obtain 4 mL of 99mTc-NC100697. Before injection, the radiochemical purity (RCP) of the radiotracer was assessed using reversed-phase–high-performance liquid chromatography to determine the amount of the 99mTc-NC100697 isomers A and B. Additionally, 2 instant thin-layer chromatography systems were used to measure the reduced hydrolyzed technetium (% RHT) and the amount of free pertechnetate. The percentage RCP was calculated according to the formula: % RCP = ([% isomer A + % isomer B] [100 − % RHT])/100. The percentage RCP had to be at least 85% and with a maximum percentage RHT of 5%. The RCP typically ranged between 93% and 96% and the RHT content was <1.5%.
Injection of 99mTc-NC100697
A minimum dose of 740 MBq was injected; the maximum dose was limited to 900 MBq. Within these limits, 10 MBq/kg of body weight were injected as a bolus of 2.0 mL within 1 s and flushed with saline. All subjects stayed in a research facility under medical supervision the night before the scan and were not allowed to consume caffeine, alcohol, tobacco, or any medication known to interfere with the DAT binding of the radiopharmaceutical.
SPECT
Data were acquired with a triple-head γ-camera (Prism 3000; Philips) using low-energy, high-resolution fanbeam collimators. To prove constant performance, phantom scans with a standardized striatal phantom (Radiology Support Devices Inc.) were acquired 3 times during the study project.
Scans of the healthy volunteers were acquired at standardized time points after injection: 30 min (n = 36), 1.5 h (n = 40), 3 h (n = 39), 4 h (n = 80), 6 h (n = 15), and 8 h (n = 6). A 128 × 128 matrix was used for all acquisitions. The rotational radius was <13 cm in all cases. A total of 120 projections were acquired at 60 s per view with the camera heads following a circular orbit, resulting in a total scan time of 43 min. The projection data was checked visually for patient motion using the cine display and sinograms. The counts acquired within the brain were determined by adding all projection data to a single image and applying a standardized rectangular region on the brain area.
SPECT data was reconstructed by filtered backprojection, filtered with a Butterworth 3-dimensional (3D) postprocessing filter (0.6 cycle/cm, 5th order) and corrected for attenuation according to Chang's method (μ = 0.12/cm, (3)).
DAT binding was measured using different semiquantification methods, all based on volumes of interest (VOIs).
Manual Evaluation Methods
Evaluation Procedure Without Individual MRI Scans.
The reconstructed transverse slices were first visually aligned parallel to the orbitomeatal line as an approximation of the anterior commissure−posterior commissure line. The 12 slices containing the striatal count maximum were summed to form a single slice (thickness, 27.24 mm; pixel dimensions, 2.27 × 2.27 mm). On the latter, a standardized symmetric set of predefined 2-dimensional (2D) regions of interest (ROIs) for the striatum (91 pixels, 12.8 cm3), caudate (32 pixels, 4.5 cm3), and putamen (38 pixels, 5.3 cm3) was loaded, and each ROI was manually adjusted (allowing shift and rotation, but without changes of the ROI size) to match the corresponding structures. In addition, a freehand occipital reference region was drawn (size variable, ∼300 pixels, 42 cm3). This semiquantification method is further referred to as “manual evaluation.”
Evaluation Method Based on Individual MRI Scans.
For a subgroup of 40 scans, the MRI scans (MP-RAGE sequence) were coregistered to the corresponding SPECT scan using the SPM2 software (University College London, London, U.K.; 6-parameter fit for rotation and translation) and then aligned to the anterior commissure−posterior commissure line. Using the MRICRO software (Chris Rorden, University of South Carolina, Columbia SC), 2 physicians experienced in cranial MRI then defined individual VOIs for each striatum and an occipital reference region. The striatal structures were delineated on each transverse slice for all slices containing the putamen. The average VOI sizes (±SD) were 5.2 ± 0.8 cm3 for the striatum, 1.8 ± 0.3 cm3 for the caudate, 3.3 ± 0.5 cm3 for the putamen, and 30.3 ± 4.4 cm3 for the occipital reference region. These VOIs were then applied to the matched SPECT scan to quantify specific striatal binding. This semiquantification method is further referred to as “MRI-based evaluation.”
Automated Evaluation Method
An automated semiquantification was performed with a modified version of the Brain Analysis Software (BRASS, version 3.4.4; Hermes Medical Solutions). It is based on a multistep registration of individual patient studies to a template of healthy controls. Mean counts per voxel values for the striatum and the occipital cortex were calculated. The basic method has been described in detail earlier (8).
Creation of Template of Healthy Control Subjects and Corresponding VOI Map.
The SPECT template was created specifically for 99mTc-NC100697 SPECT scans using the images of 3 healthy control subjects. In addition, a standardized 3D symmetric VOI map was created. The standardized VOI sizes were 11.3 cm3 for the striatum and 68.3 cm3 for the occipital reference region.
Registration Process.
The registration method uses 3 sequential registration steps. In the first step, individual scans of the study were registered to the 99mTc-NC100697 template by applying automated fitting algorithms (principal axes technique, normalized mutual information (9)). The second and third steps provide a fine adjustment of the striatal VOIs separately for each hemisphere to compensate for individual anatomic differences. This is accomplished by using the same registration algorithms to further register the study to templates consisting of only the masked striatum of each hemisphere. The result is that the patient image will be matched to the VOI map for the calculation of intensity in the striatum of each hemisphere. The fine adjustment transforms have no effect on the calculation of reference VOI intensities.
Comparison of Manual and Automated Methods
For the comparison of semiquantitative results, the specific radiotracer binding ratios of striatum, caudate, and putamen were calculated (specific bindingstriatum = [striatum – occipital reference]/occipital reference). In addition, putamen-to-caudate ratios (ratios between the specific binding in the putamen and the caudate) were determined.
Correlations between semiquantitative results evaluated by the automated, the manual, and the MRI-based methods were calculated using linear regression analyses. The difference between the semiquantitative ratios of the methods averaged over all scans ( ), the SD (s), as well as the limits of agreement (
 and
and  ) were calculated as proposed by Bland and Altman (10). In addition, intraclass correlation coefficients (ICCs) based on a 2-way random model were determined.
Because the regression lines of the binding ratios evaluated by the 3 methods were expected to show different slopes due to differences in VOI size and shape, the semiquantitative values evaluated using the methods had to be corrected first to calculate these statistics. For this purpose, all binding ratios were multiplied by the reciprocal slope of the regression curves.
Optimal Time Point for Acquisition
To assess the most ideal time point for the acquisition, the specific striatal binding ratios were plotted over time up to 8 h after injection.
Statistics
Descriptive statistics are given as mean and SD. Comparisons between groups were tested with independent group or paired Student t tests. The relation between age and DAT binding was fitted using linear, exponential, and logarithmic regression analyses and a “broken-stick” regression model, which is based on an iterative fit minimizing the root-mean-square error of the slopes for the 2 regression lines as well as their intercepts of the formula:
All statistical analyses were performed using SPSS Software version 13.0 (SPSS Inc.).
RESULTS
An example of the images acquired at different time points after injection is given in Figure 1.
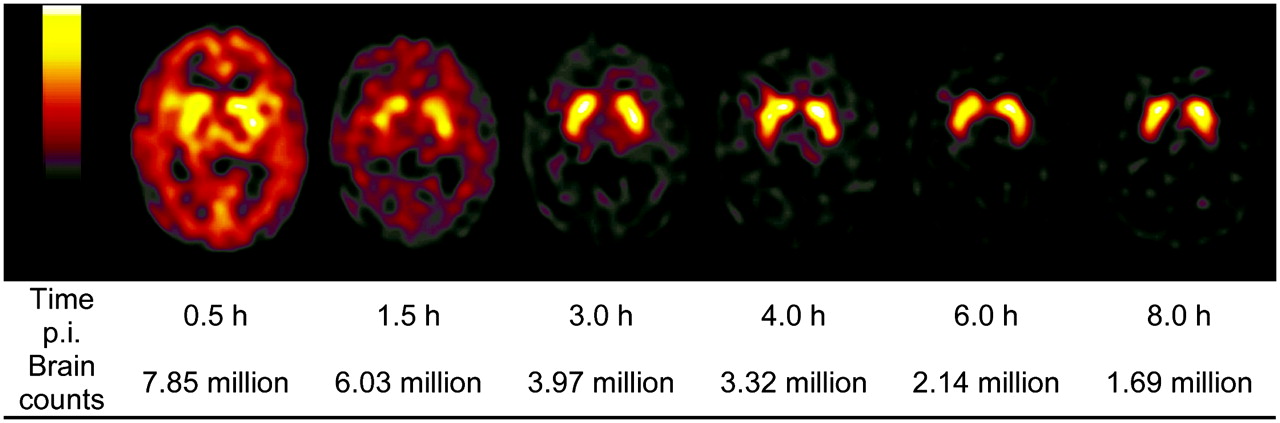
Example of time course of brain counts and image quality in 24.5-y-old female healthy participant after injection (p.i.) of 789 MBq 99mTc-NC100697.
Brain Counts
Mean brain counts decreased from 7.5 ± 1.0 million counts at 30 min after injection to 1.5 ± 0.4 million counts at 8 h after injection, following an exponential decline (R2 = 0.864,  ; P < 0.0005; Table 1). The effective half-life of the brain counts, determined from the regression model, is 3.0 h. Up to 6 h after injection, average brain counts still exceed 2 million, which ensures acceptable image quality.
Brain Counts at Different Time Points After Injection of Radiotracer
Time Course of Specific Striatal Binding
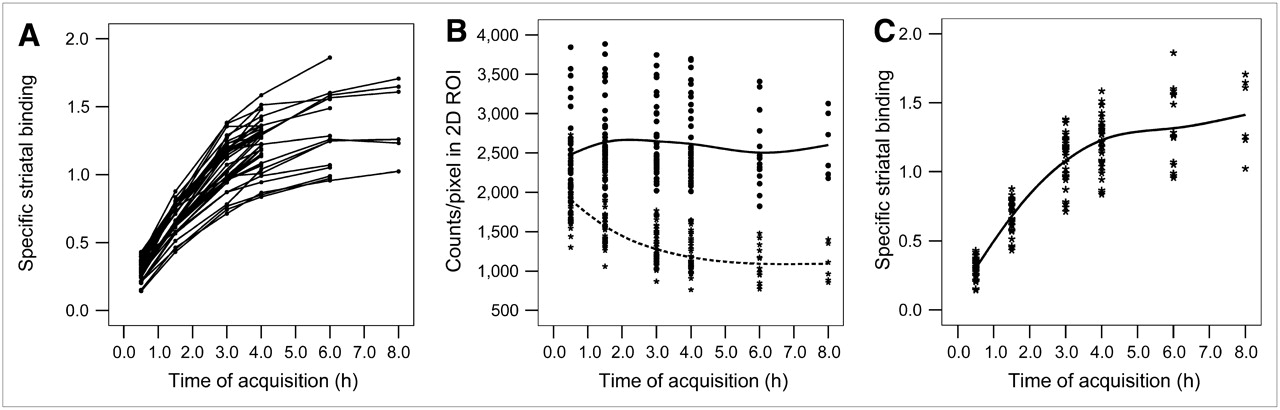
Figure 2A shows the individual time course of specific striatal binding for all subjects (n = 40) scanned at multiple acquisition time points, based on the manual evaluation. The time course of the average counts/pixel in the striatal region and in the occipital reference region of the entire cohort is plotted in Figure 2B, together with the time course of the resulting specific striatal binding (Fig. 2C). The striatal binding curve initially shows an increase up to 4 h after injection and seems to plateau from then on with only a slight further increase up to 8 h after injection. The suggested optimal time point for imaging was defined at 4 h after injection, based on the combination of a sufficient number of total brain counts and the period of nearly constant specific striatal binding.

Individual time course (decay corrected) of specific striatal binding (A), counts in striatal region (B, solid line) and counts in occipital reference region (B, dashed line), and group mean specific striatal binding (C), all based on manual 2D ROI approach.
Average DAT binding at that time point for the total population based on the manual evaluation approach was 1.1 ± 0.2 (striatum), 1.3 ± 0.2 (caudate), and 1.1 ± 0.2 (putamen), with mean putamen-to-caudate ratios of 0.83 ± 0.08.
Comparison of Evaluation Methods
Excellent linear correlations of specific binding ratios between the MRI-based method with individual VOIs and both methods with standardized VOIs were found (Table 2). The highest correlation was observed between values obtained from the automated and the manual evaluation methods (R2 = 0.934). The automated evaluation showed a slightly better correlation with the MRI-based evaluation (R2 = 0.871) than the latter with the manual one (R2 = 0.842; Table 2). For each of the following analyses, the best evaluation method was chosen: For analyses requiring data on subregions or multiple time points, the manual approach was chosen as the automated algorithm currently cannot provide these data. Due to the better correlation of the automated method with the MRI-based approach, for all other analyses, the automated approach was preferred.
Correlation Between Manual 2D ROI, MRI-Based, and Automated 3D VOI Semiquantitative Evaluations
Characterization of Specific Striatal Binding
Age Dependency of Specific Striatal Binding.
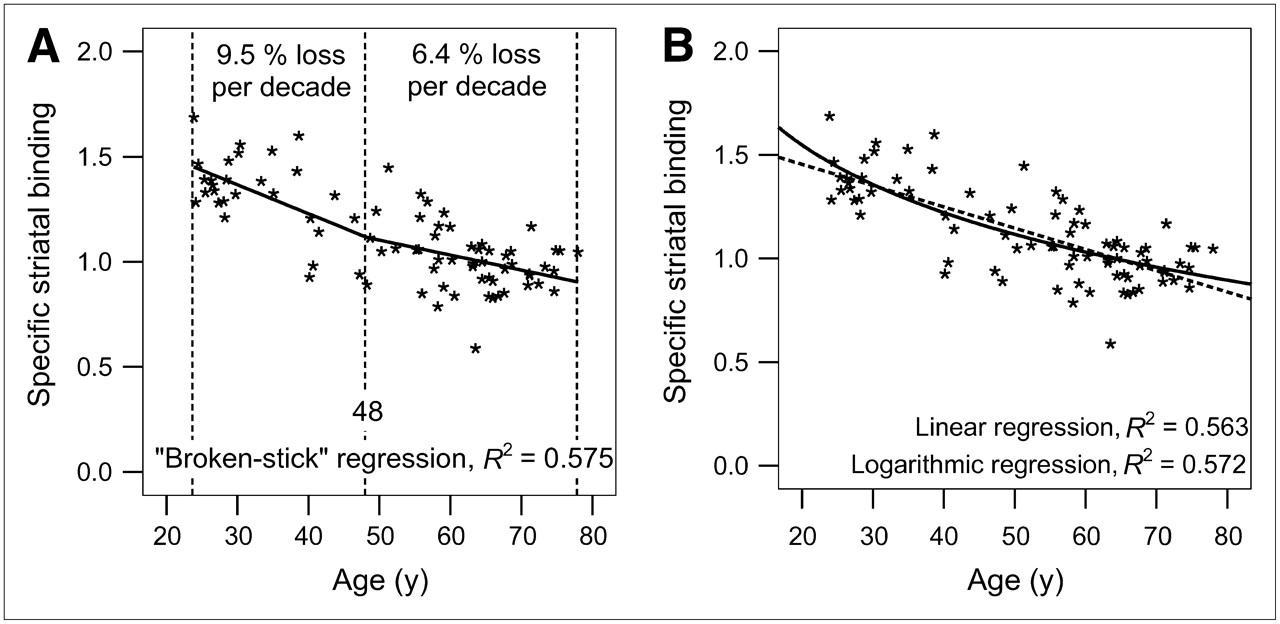
A significant age dependency of striatal DAT binding, best described by a broken-stick (break-point age 48.2 y, const1 = 1.779, slope1 = −0.014, const2 = 1.459, slope2 = −0.007; R2 = 0.575; Fig. 3A) or logarithmic regression (R2 = 0.572; Fig. 3B), with a lower decline in older than in younger subjects (average loss, 6.4% per decade for subjects > 48 y, 9.5% for subjects ≤ 48 y, based on broken-stick regression) was observed. The R2 value for the linear regression analysis was slightly lower (0.563). The lowest R2 value was observed when applying an exponential fit (0.526). The mean specific striatal binding decreased from 1.4 ± 0.1 in the youngest to 1.0 ± 0.1 in the oldest cohort (automated evaluation).

Age dependency of specific striatal binding (based on automated 3D VOI evaluation method), fitted with broken-stick regression model (A), with linear (B, dashed line) and logarithmic regression models (B, solid line).
Sex Dependency of Specific Striatal Binding.
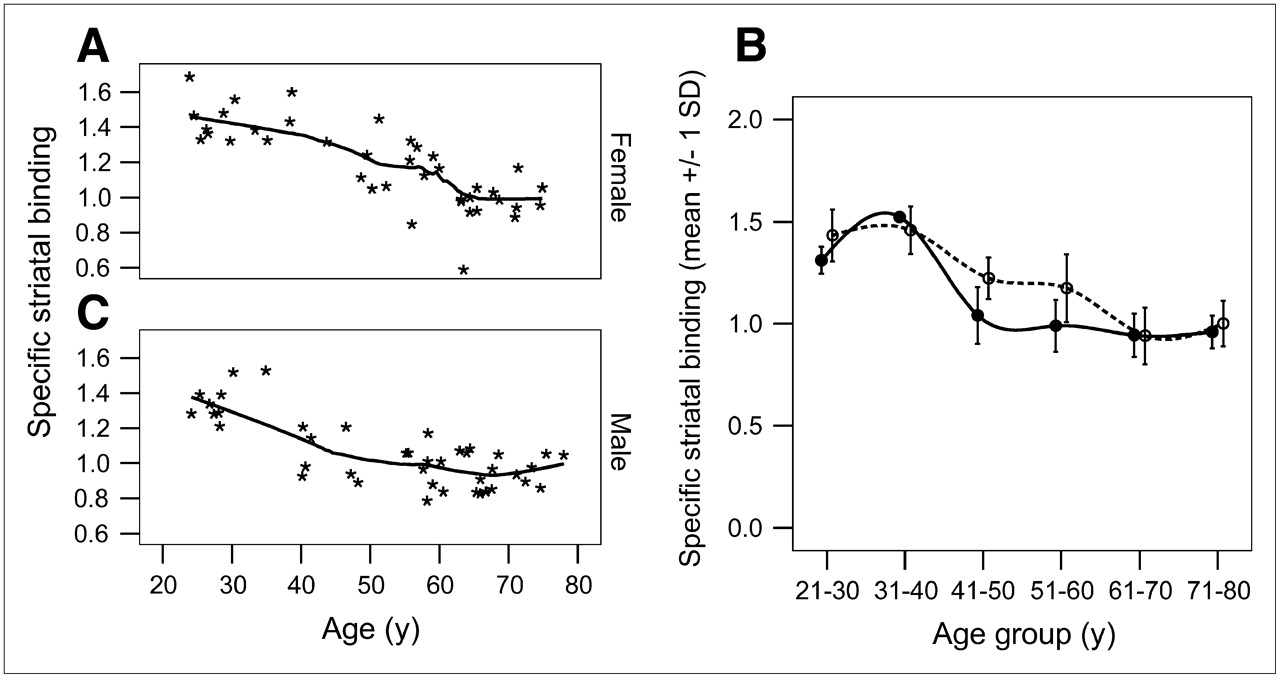
Female subjects presented with higher binding ratios (1.2 ± 0.2) than male subjects (1.1 ± 0.2; P = 0.013; automated evaluation). When considering both age and sex dependency at the same time, different profiles for the age dependency can be found for male and female subjects (Fig. 4).

Profiles of age dependency of DAT binding in women (A) and in men (C). (B) Mean ± SD of DAT binding for each age cohort, where striatal binding in women is represented by dashed line and that of male subjects by solid line.
Putamen-to-Caudate Ratios.
The age dependency of striatal binding was similar in all striatal subregions, resulting in constant putamen-to-caudate ratios throughout the full age range (Fig. 5).
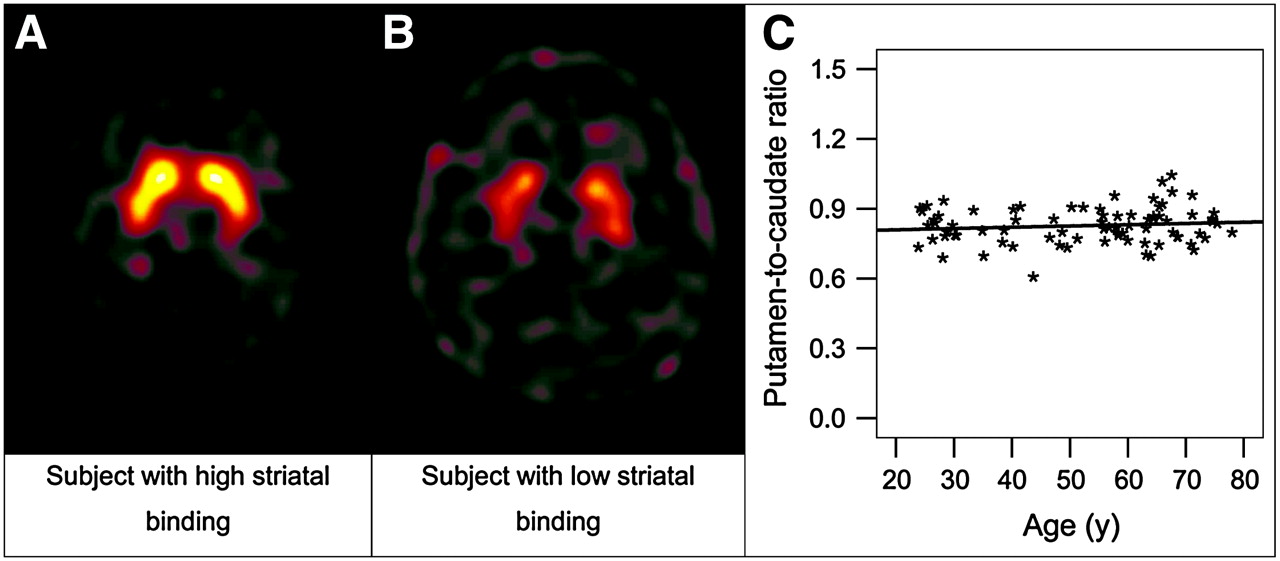
Example of subjects with high (A) and low (B) striatal binding. (C) Putamen-to-caudate ratios remained stable throughout the full age range.
DISCUSSION
99mTc-NC100697 is a new single-vial kit formulation based on the trifluoroacetic acid salt of TRODAT-1 with a reduced amount of ligand (18 μg equal to 10 μg free base) in comparison with previously used multistep formulations containing 200 μg (11).
The aim of our study was to characterize the ideal time point for image acquisition as well as age and sex dependencies of 99mTc-NC100697 binding in healthy volunteers. Knowledge of these parameters is a prerequisite for correct interpretation of semiquantitative measures (3).
The strength of this study is the equal distribution of female and male subjects in each group with structured age cohorts and well-defined criteria of normality for all participating subjects. This allows independent analyses of the factors influencing DAT binding with simple and robust statistical tests.
Optimal Time Point for Acquisition
Serial acquisitions at different time points after injection of 99mTc-NC100697 showed an initial rapid increase in the specific striatal binding over time and then the curve seems to plateau at approximately 4 h after injection. The possibly slight further increase thereafter has to be questioned due to the limited number of cases in the 6- and 8-h time window that omits interpretation with the same robustness as in earlier time points. In principle, the course of the time–activity curve is in line with data published by Kao et al. (12), where stable specific striatal binding ratios were observed beginning 3 h after injection, and also with data of Acton et al. (13,14). As a potential limitation of our approach, we did not measure the arterial input function (including metabolite analysis), which would have allowed us to determine the brain-tissue time–activity data. Such analyses, however, have been published previously (14), demonstrating a good correlation of simple ratio techniques with kinetic data at 4.5 h after injection. The available data from our study did not clearly meet the published criteria for an equilibrium such as a “transient or pseudoequilibrium” according to Carson et al. (15), “peak equilibrium” according to Farde et al. (16), or “protracted equilibrium” according to Laruelle et al. (17). Therefore, defining the optimal time point for acquisition in clinical routine would need to consider also factors other than equilibrium such as adequate count statistics, the largest discriminatory power between normal and disease condition (12), and the smallest test−retest variability (18). In the light of clinical imaging, starting acquisition 4 h after injection seems favorable, because at that time point an average of 3.0 ± 0.5 million brain counts guarantee sufficient image quality as demanded by the European Association of Nuclear Medicine procedure guidelines for brain neurotransmission SPECT using DAT ligands (3). Furthermore, at this time point, higher striatal-to-background ratios in comparison with scans 2 or 3 h after injection were observed between healthy subjects and Parkinson's disease patients previously (12). Based on these facts, an optimal time window for acquisition starting 4 h after injection is suggested. Taking all of these considerations into account, the binding values measured at this time point may be considered as empiric specific-to-nonspecific tissue ratios and form the basis for our further analyses.
Age Dependency
With increasing age, DAT binding decreased with a similar extent as previously published (19–22). There is evidence that a strict linear model does not accurately describe the age dependency found in healthy control subjects (21,23). Indeed, broken-stick or logarithmic regression showed a more rapid decrease in the younger control subjects than in the oldest cohort in our data; however, there were only minor differences in the R2 values of the regression models examined. Similar shaped nonlinear regression characteristics have not only been described previously for the DAT (21) but also for other components of the dopaminergic system (24–27). The best correlation was obtained with a piecewise regression analysis with a break-point age of 48 y. After this break-point age, the loss per decade dropped from 9.5% to 6.4% per decade. Our findings confirm and further extend a previous report by Mozley et al. (21) not only by covering a higher number of healthy control subjects with more weight on the relevant age cohorts from 50 y onward but also by describing the interaction of age and sex dependence. The more stable levels in older subjects might be one factor leading to failure, showing a significant age dependency of DAT availability when looking at a limited age spectrum (28).
In our data, the regression curves observed for the different striatal subregions had a similar shape, resulting in stable putamen-to-caudate ratios across all age groups. This enables distinguishing normal age-dependent DAT binding loss from neurodegenerative parkinsonian syndromes, where decreased putamen-to-caudate ratios are expected. The relatively prolonged biologic stability in the older cohorts in our collective may in addition facilitate detecting dopaminergic neurodegeneration, as DAT binding loss in this period substantially outweighs the effects of normal aging (29–32).
Several aspects may interfere with a correct analysis of age-dependent DAT binding loss. First, brain volume decreases with age, resulting in larger cerebrospinal spaces. This could lower the average counts within an occipital reference region when drawing regions on SPECT data only and increase binding values. This effect can be excluded in our analyses, as the MRI-based semiquantification showed similar age relations as found using the other quantification methods. As a potential drawback, however, we did not correct for partial-volume effects. Second, it has been discussed that an earlier peak in the individual time course of the striatal binding in subjects with lower DAT densities at a fixed time point after injection could have resulted from imaging beyond a stable equilibrium with striatal binding already decreasing and, therefore, leading to an overestimation of loss of DAT binding with age. Analyses of the individual time course obtained for the first 40 subjects, however, do not support this hypothesis.
Sex Dependency
Female subjects presented with slightly higher specific DAT binding than male subjects. The extent is similar to what has been described previously for the DAT ligands 2β-carbomethoxy-3β-(4-iodophenyl)tropane (β-CIT) (33) and 123I-N-ω-fluoropropyl-2-β-carboxymethoxy-3β-(4-iodophenyl)nortropane (FP-CIT) (34). The age-dependent loss of DAT binding, however, showed different profiles in men and women. Whereas a relatively rapid loss of DAT binding was observed in men up to an age of ∼40 y, the DAT binding in women remained at higher levels until approximately the mid 50s. From approximately 60 y onward, striatal binding showed almost identical levels in both male and female healthy control subjects. The decline of female sex hormones in postmenopausal women might be a possible explanation for these findings. There is preclinical evidence that DAT density may be upregulated by estradiol and progesterone (35,36). Sex differences are also reported for dopamine D2 receptor affinity (37), with females showing a lower affinity, suggesting an increased endogenous striatal dopamine concentration in women. This is in line with the increase of DAT binding in women observed in our study. However, we were not able to control for the menstrual cycle and hormone supplementation in female subjects.
The different profiles observed in men and in women question the discussion regarding the most accurate regression model for assessment of age dependency. In comparison with the extent of DAT loss in patients with neurodegenerative parkinsonian syndromes (average DAT binding loss of 57% in the putamen (32)), the slight sex dependence of DAT binding will unlikely affect the accuracy in clinical routine imaging. In addition, most patients with suspected Parkinson's disease are >50 y old, thus in an age where sex-dependent differences seem to be less relevant.
Comparison of Semiquantification Methods.
Probably the most accurate semiquantification method is based on individual MRI scans for region drawing. Common registration algorithms, however, often fail (probably due to low anatomic details in NC100697 scans) and studies have to be registered manually to the MRI scans, introducing new sources of error. In addition, drawing precise 3D VOIs based on MRI scans is too time-consuming to be established in clinical routine and MRI scans with standardized sequences are often not available for every patient. Apart from MRI-independent standardized manual ROI analyses, we have examined an observer-independent automated quantification approach based on registration of individual studies to a template (8). A comparison of these different processing methods showed an excellent correlation; however, absolute values differ depending on the processing method used. These data show that semiquantification of specific binding seems feasible using MRI-independent methods. The automated processing method provides observer-independent results (8). This might explain the higher correlation with the MRI-based semiquantification approach in comparison with the manual evaluation method.
Implications on Future Clinical Applications.
The main clinical application of 99mTc-NC100697 will be to aid in the diagnosis of neurodegenerative parkinsonian syndromes. Therefore, sensitivity and specificity of this method will play a key role. Their assessment may be confounded by the variation of specific binding values observed in healthy subjects, which, to a large extent, could be attributed to the age-dependent loss of DAT binding. The latter stresses the necessity for using age-matched reference values as shown by Weng et al. (38), who demonstrated an increase of sensitivity and specificity of TRODAT-1 SPECT for differentiating patients with Parkinson's disease from healthy control subjects when controlling for age. Van Laere et al. (39) compared the diagnostic accuracy of TRODAT-1 with FP-CIT in matched, but not identical, patient groups and reported a similar sensitivity for both tracers (92% vs. 95%). Specificity, however, was somewhat lower for TRODAT-1 (70%) compared with FP-CIT data (86%). Whether controlling for age could have further improved the diagnostic performance of either method was not addressed, probably because of the small sample size of their healthy subjects (n = 10 in each group). Another factor possibly contributing to some variation in healthy subjects may be test−retest variability. Determination of the latter was not part of this study protocol; respective values reported in the literature for TRODAT-1 investigations (18), however, were in a similar range as those for other DAT ligands.
CONCLUSION
The current study has demonstrated the effective use of 99mTc-NC100697, a new formulation of TRODAT-1, for estimating presynaptic striatal DAT binding. In clinical routine work this tracer can be reliably evaluated with both manual and observer-independent automated methods. The images can be reliably evaluated without individual MRI scans. An age dependency of 99mTc-NC100697 binding should be taken into consideration. The data generated in this phase 1 study provide a basis for an age- and sex-matched normal database.
Acknowledgments
The authors thank Dr. Wolfgang Münzing (Department of Nuclear Medicine, University of Munich) for his support with phantom measurements and camera quality assurance. We also thank Dr. Christian La Fougère (Department of Nuclear Medicine, University of Munich) for his help with patient management and Anna Barnes (GE Healthcare) for performing the SPECT/MRI image registrations. The authors gratefully acknowledge financial support from GE Healthcare, Amersham, U.K.
Footnotes
-
COPYRIGHT © 2007 by the Society of Nuclear Medicine, Inc.
References
- Received for publication August 18, 2006.
- Accepted for publication October 19, 2006.


Jump to section
Related Articles
Cited By...
- No citing articles found.