


Abstract
Cu-Diacetyl-bis(N4-methylthiosemicarbazone) (Cu-ATSM) is a recently developed PET imaging agent for tumor hypoxia. However, its accuracy and reliability for measuring hypoxia have not been fully characterized in vivo. The aim of this study was to evaluate 64Cu-ATSM as a hypoxia PET marker by comparing autoradiographic distributions of 64Cu-ATSM with a well-established hypoxia marker drug, EF5. Methods: R3230 mammary adenocarcinomas (R3230Ac), fibrosarcomas (FSA), and 9L gliomas (9L) were used in the study. EF5 and Hoechst 33342, a vascular perfusion marker, were administered to the animal for immunohistochemical analysis. 64Cu-ATSM microPET and autoradiography were performed on the same animal. The tumor-to-muscle ratio (T/M ratio) and standardized uptake values (SUVs) were characterized for these 3 different types of tumors. Five types of images—microPET, autoradiography, EF5 immunostaining, Hoechst fluorescence vascular imaging, and hematoxylin-and-eosin histology—were superimposed, evaluated, and compared. Results: A significantly higher T/M ratio and SUV were seen for FSA compared with R3230Ac and 9L. Spatial correlation analysis between 64Cu-ATSM autoradiography and EF5 immunostained images varied between the 3 tumor types. There was close correlation of 64Cu-ATSM uptake and hypoxia in R3230Ac and 9L tumors but not in FSA tumors. Interestingly, elevated 64Cu-ATSM uptake was observed in well-perfused areas in FSA, indicating a correlation between 64Cu-ATSM uptake and vascular perfusion as opposed to hypoxia. The same relationship was observed with 2 other hypoxia markers, pimonidazole and carbonic anhydrase IX, in FSA tumors. Breathing carbogen gas significantly decreased the hypoxia level measured by EF5 staining in FSA-bearing rats but not the uptake of 64Cu-ATSM. These results indicate that some other 64Cu-ATSM retention mechanisms, as opposed to hypoxia, are involved in this type of tumor. Conclusion: To our knowledge, this study is the first comparison between 64Cu-ATSM uptake and immunohistochemistry in these 3 tumors. Although we have shown that 64Cu-ATSM is a valid PET hypoxia marker in some tumor types, but not for all, this tumor type–dependent hypoxia selectivity of 64Cu-ATSM challenges the use of 64Cu-ATSM as a universal PET hypoxia marker. Further studies are needed to define retention mechanisms for this PET marker.
Tumor hypoxia is an important pathophysiologic feature of solid tumors. The presence of hypoxia in a tumor is closely related to resistance to radiotherapy and chemotherapy, initiation of angiogenesis, metastasis, and progression (1–3) and can compromise the efficacy of conventional radiotherapy or chemotherapy. Because of the profound impact of hypoxia on tumor behavior, and consequently on patient outcome, the study of hypoxia as a predictive assay for individual tumor response is a subject of intense experimental and clinical interest. Noninvasive detection and quantification of tumor hypoxia using PET have been investigated in recent years (4,5). Several radionuclide-labeled hypoxia markers have been developed for PET—for example, 18F-fluoromisonidazole (FMISO) (6), 18F-fluoroazomycinarabinofuranoside (FAZA) (7), and Cu-diacetyl-bis(N4-methylthiosemicarbazone) (Cu-ATSM) (8,9). All of these hypoxia agents have shown certain preferential uptake in hypoxic cells. However, thorough validation studies are needed for them to be used with confidence in the clinic.
Cu-ATSM is a promising hypoxia marker for PET, which has been shown to be predictive of radiotherapy treatment outcome in several small clinical series (10,11). Copper has several positron-emitting isotopes (60Cu, 61Cu, 62Cu, and 64Cu) with various half-lives, ranging from 9.7 min for 62Cu to 12.7 h for 64Cu. This allows a wide choice of isotopes, so that half-life (t1/2) and radiation energy level can be tailored to particular needs. The synthesis of Cu-ATSM is relatively easy with a 1-step reaction between copper and the substrate (12). Cu-ATSM has small molecular weight and high cell membrane permeability; thus, it can diffuse easily from bloodstream to surrounding cells. Intracellular Cu-ATSM has been shown to be bioreduced and trapped in viable cells under low cellular partial pressure of oxygen (Po2) (12–14).
The use of Cu-ATSM as a hypoxia imaging agent was first reported by Fujibayashi et al. in 1997 (14) in a rat ischemic heart model. Subsequent studies on Cu-ATSM uptake and retention have been performed on tumor cells both in vitro (8,15) and in vivo (9–11). However, none of those studies directly correlated the spatial distribution of Cu-ATSM with that of tumor hypoxia in vivo, particularly in multiple tumor types.
In this study we aimed to validate the ability of 64Cu-ATSM as a hypoxia marker on both macro- and microscales and to measure spatial correlations between 64Cu-ATSM uptake and tumor hypoxia level, as assessed independently. Several immunohistochemical hypoxia markers were used to compare with 64Cu-ATSM in terms of the hypoxia specificity. The uptake of 64Cu-ATSM was compared with that of immunohistochemical markers. EF5 (2-[2-nitro-1H-imidazol-1-yl]-N-[2,2,3,3,3-pentafluoropropyl]acetamide), a well-established hypoxia marker, can be bioreduced by cells in proportion to the level of cellular Po2 (16). Fluorescent staining of EF5 binding can be quantified and directly linked to the oxygen level (17). We also used pimonidazole (18) and carbonic anhydrase IX (CA-IX) (19) as additional hypoxia markers for robust comparisons in selected cases. Three different tumor lines were used in this study: R3230 adenocarcinoma (R3230Ac), 9L glioma (9L), and fibrosarcoma (FSA). We have previously studied hypoxia distribution and oxygen transport in these 3 tumor lines and found that R3230Ac and FSA are similar in their degree of hypoxia and 9L tumor is more hypoxic (20,21). On the basis of this information, we evaluated the ability of 64Cu-ATSM to measure hypoxia in these tumor lines.
MATERIALS AND METHODS
Radionuclide and 64Cu-ATSM Synthesis
64Cu and ATSM were obtained from Washington University School of Medicine (St. Louis, MO). 64Cu in chloride solution was delivered overnight on the production date (t1/2 of 64Cu = 12.7 h). 64Cu-ATSM was synthesized in the radiochemistry laboratory at Duke University Medical Center following the published protocol (15). In brief, 10 μL ATSM dissolved in dimethyl sulfoxide solution (1 mg/mL) was added to hydrochloride-buffered 64Cu chloride for a 2-min reaction. The mixture was then loaded onto a conditioned C18 Sep-Pak cartridge, and 64Cu-ATSM was eluted with ethanol. About 80% of the ethanol was evaporated using blown argon gas, and the remaining 64Cu-ATSM was diluted in saline for animal injection. A small sample (∼30 μL) of 64Cu-ATSM was taken for thin-layer chromatography and high-performance liquid chromatography (HPLC) analysis. HPLC analysis showed high radiochemical purity, typically >96% yield of 64Cu-ATSM in the final product.
Animal Models
Fischer 344 rats (120−130 g) were purchased from the National Cancer Institute, Frederick Cancer Center. R3230Ac was originally obtained from the American Type Culture Collection. Rat FSA was kindly provided by Dr. Joan Bull (M.D. Anderson Cancer Center, Houston, TX), and 9L cells were obtained courtesy of Dr. Kenneth Wheeler (Wake Forest University, Winston Salem, NC). For tumor implantation, small pieces of tumor tissue (1–2 mm3 each) were freshly obtained from tumor-bearing donor rats and transplanted subcutaneously in the neck of recipient animals. After the tumors had reached 1–2 cm in diameter (usually 3 wk after implantation), animals were used for imaging experiments. All procedures involving animals were performed in compliance with the guidelines of the Duke University Institutional Animal Care Committee.
PET and Experiment Protocol
64Cu-ATSM PET was performed on a microPET R4 system (Concorde Microsystems, Inc.). The performance evaluation of the microPET R4 system can be referred to the report by Knoess et al. (22). Animals were intubated and ventilated with an isoflurane/air mixture (1% isoflurane) using a customized forced-air ventilator (tidal volume, 12 mL/kg). A tail vein catheter was placed for the injection of radiopharmaceuticals and other reagents. An electrocardiograph (ECG) was recorded and real-time monitored through a Labview software-controlled, customized ECG system. Body temperature was maintained at around 37°C using a regulated water-heated blanket surrounding the whole body, which was monitored through a rectal temperature probe during PET.
Animals were first given EF5 solution (30 mg/kg, intravenously, obtained from Dr. Cameron Koch, University of Pennsylvania, Philadelphia, PA) 2 h before PET scans (or 3 h before sacrifice) via the tail vein. For some animals, pimonidazole solution (60 mg/kg; Chemicon) was administered by intraperitoneal injection 1 h before PET scans. The animal was placed on a support cradle in a prone position and advanced into the scanner. The tumor was centered inside the scanner using a laser alignment system. A 15-min 68Ge transmission scan was performed for attenuation correction. After the transmission scan, 64Cu-ATSM (22.2–31.4 MBq per rat) was administered through the tail vein catheter as a bolus injection. A 1-h dynamic PET scan was subsequently performed.
After the PET scan, a single dose of 100 μL Hoechst 33342 (5 mg/kg, no. B2261; Sigma) was administered intravenously. Five minutes after injection of Hoechst 33342, the skin covering the tumor was separated and removed carefully without significantly disturbing the tumor position. The tumor was exposed with the base still connected to the host tissue. A 23-gauge needle was inserted carefully into the tumor along the axial scanning direction as a reference marker for cryosection orientation. Two cross lines were also marked on the tumor surface indicating axial and transverse directions. The tumor was then removed with reference needle attached and snap-frozen in liquid nitrogen for autoradiography and immunohistochemistry. Other organ tissues—including brain, heart, liver, kidney, and muscle—were also collected and snap-frozen along with tumor for biodistribution study.
Immunohistochemistry and Fluorescence Imaging
The frozen tumor samples were cryosectioned at 14-μm thickness. The section orientation was determined from the reference needle and tumor surface cross-line markers to ensure that the cutting was perpendicular to the axial direction and on the same transverse section as the PET. Slides were counted from the initiation of cutting and numbered consecutively so that depth could be recorded. For each tumor, 3 locations along the axial line were chosen and at least 6 consecutive slides (2 for autoradiography and 4 for EF5 staining) were cut for each location.
EF5 was used as a hypoxia marker in all 3 tumor lines. EF5 immunostaining was done following a protocol developed by Dr. Cameron Koch's laboratory (23). Briefly, cryosectioned tumor sections were fixed in 4% formaldehyde, blocked in tissue-blocking reagent, and incubated with the EF5 antibody ELK3-51 conjugated with Cy3 dye (75 μg/mL, obtained from Dr. Cameron Koch). One section was treated without antibody to provide endogenous tissue fluorescence as a negative control. Another adjacent section was incubated with antibody and treated with 0.5 mmol/L EF5 as a “competing stain” to assess nonspecific binding of antibody (24). Stained tumor sections were kept in 1% formaldehyde phosphate-buffered saline (PBS) and imaged within 3–4 d. After imaging, sections were stained with hematoxylin and eosin (H&E) to obtain histologic structure.
To validate unusual EF5 cross-correlations with 64Cu-ATSM PET and autoradiography obtained with FSA, 2 other hypoxia markers, pimonidazole and CA-IX (an endogenous hypoxia-regulated protein), were also used. Tumor sections were fixed and incubated with either murine antipimonidazole primary antibody (Chemicon) or anti–CA-IX mouse monoclonal antibody clone M75 (a gift from Dr. Egbert Oosterwijk, Department of Urology, University Hospital Nijmegen, Nijmegen, The Netherlands) for 1 h. A fluorescein isothiocyanate–conjugated antimouse secondary antibody was added after primary antibody incubation. The stained slides were kept in cold 1% formaldehyde PBS for microscope imaging.
Fluorescent images for EF5 and Hoechst staining were made using a fluorescence microscope (Axioskop 2plus; Zeiss) equipped with a cooled charge-coupled device digital camera (Retiga1300R; Q-Imaging). A tetrarhodamine isothiocyanate (TRITC) fluorescence filter was used for EF5-Cy3 imaging (excitation maximum [EX] = 552 nm; emission maximum [EM] = 570 nm), and a 4′,6-diamidino-2-phenylindole (DAPI) filter was used for Hoechst 33342 imaging (EX = 347 nm; EM = 483 nm). An automatic microscope stage and controller (MAC5000; Ludl Electronic Products) with 0.025 μm per step size was used for the whole tissue slide scan. Tissue slides were scanned for Hoechst 33342 fluorescence to reveal the functional vessels and perfused tissues, followed by a second scan on the same slide for either EF5, pimonidazole, or CA-IX. Images acquired from stage scanning were stitched and overlaid for direct comparison of dual fluorescent images. Image acquisition and control was accomplished using MetaMorph imaging software (version 6.2; Molecular Devices Co.).
Electronic Autoradiography
Electronic autoradiography was performed on a storage phosphor system (Packard Bioscience). After cryosectioning tissue, slides were exposed to a storage phosphor screen for 48 h at 4°C. The phosphor screen was then processed and read in the phosphor system to visualize the distribution of 64Cu-ATSM in tumor and other organs. After autoradiography, all slides were H&E stained to obtain corresponding histology information for each.
Carbogen-Breathing Experiments
To investigate whether changing the oxygenation in tumors would influence the uptake of 64Cu-ATSM in FSA tumors, carbogen-breathing experiments were conducted. Rats were intubated with an 18-gauge catheter and ventilated with 1% isoflurane-mixed carbogen gas (95% O2/5% CO2, research grade; Machine & Welding Supply Co.) by a customized ventilator. Each rat was put on carbogen breathing for 30 min before injection of 64Cu-ATSM and EF5. They continued to breathe carbogen during the 1 h PET scan. After imaging and the injection of Hoechst 33342, the tumor was collected and snap-frozen. Autoradiography and immunohistochemistry were conducted on the tumor sections as described.
Image Analysis
Raw PET projection data (list-mode data) were binned into 95 time frames: 55 frames for the first 20 min (30 × 10-s frames, 20 × 30-s frames, 5 × 60-s frames) and 40 frames for the next 40 min (40 × 60-s frames). Images were reconstructed by the ordered-subsets expectation maximization algorithm provided by Concorde Microsystems, with attenuation and decay correction applied.
Regions of interest (ROIs) were drawn around the viable tumor area (regions within the tumor with very low or absent activity were presumed to be necrotic). Three 2-dimensional ROIs in transverse sections and one 3-dimensional volumetric ROI were drawn and used for each tumor. Dynamic uptake curves representing these ROIs were recorded from the 95 time frames. The standardized uptake value (SUV) was measured as the decay-corrected radiotracer concentration normalized to the injection dose and animal weight.
The tumor-to-muscle ratio (T/M ratio) was calculated as well by comparing the radioactivity level in tumor and that in muscle at 1 h after injection. One SUV and one T/M value at 1 h after injection were obtained for each animal by averaging the measurement values from the 4 ROIs of that animal.
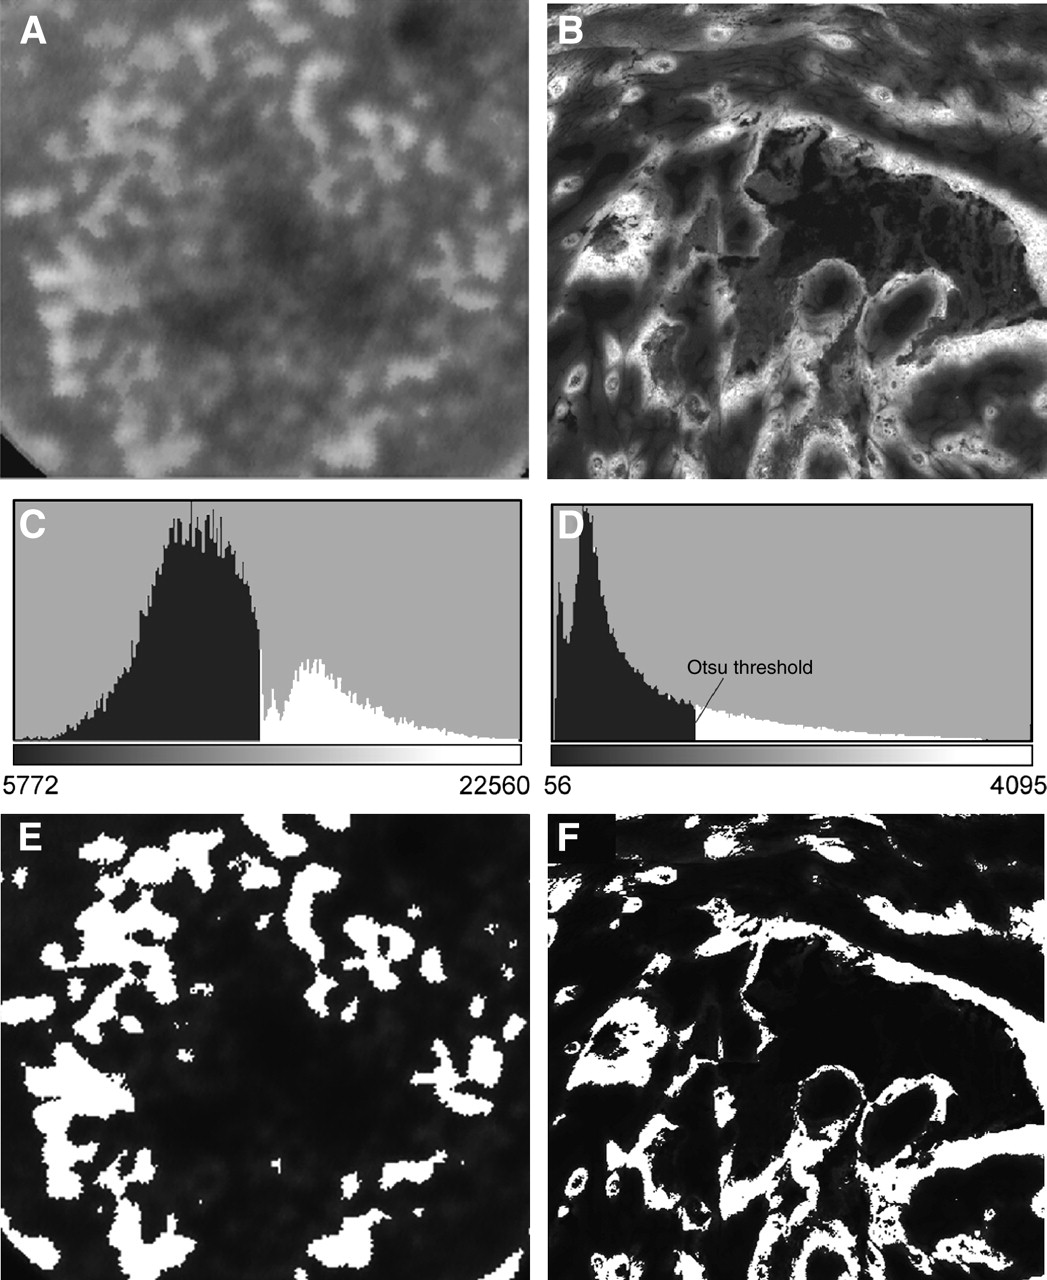
The autoradiography and EF5-stained images were taken from consecutive tumor sections and compared section by section. Three pairs of sections from autoradiography and EF5 staining were evaluated for each tumor. To calculate the 64Cu-ATSM uptake area fraction and the EF5 binding area fraction, a threshold was needed to separate the positive uptake area in autoradiography images or hypoxia area in EF5-stained microscopic fluorescent images. Because of the large fluorescent dynamic range, it is hard to determine a threshold visually from a histogram (Fig. 1D). To avoid too much involvement of subjective selection of the threshold, an automatic threshold scheme, Otsu thresholding method (25) built in ImageJ software (ImageJ 1.34 version, National Institutes of Health; http://rsb.info.nib.gov/ij), was used to threshold images. An example of thresholding and segmenting images into positive uptake/staining area and tissue background area was shown in Figure 1. Another thresholding scheme, adaptive automatic thresholding in MetaMorph software, was also tried in select cases to be compared with the Otsu method, and similar segmentation results was obtained. Viable tissue area for each section was measured from the H&E staining in the same slide. The 64Cu-ATSM uptake area fraction (or EF5 binding area fraction) was then calculated by dividing the positive uptake area (or binding area) by the total viable tissue area from autoradiography images (or fluorescent images). Differences between the 2 area fractions were compared statistically. For spatial correlation analysis, autoradiography and EF5 microscopic images were scaled to the same size according to image calibration and aligned by the Turbo-Registration package in ImageJ software. A scatter plot was generated with the x- and y-coordinates representing region-averaged (3 × 3) pixel values in each paired autoradiography image and EF5 image. Each point in the scatter plot corresponds to a specific position within the tumor. Correlation coefficients were calculated on the basis of scatter plots for each of the paired images.

Image thresholding in area fraction measurement. (A and B) Original 64Cu-ATSM autoradiography image and EF5 fluorescent staining image. (C and D) Corresponding histograms for above images. The Otsu automatic thresholding method was used to determine the threshold based on histograms. Pixels with intensity higher than the threshold (in white color) were treated as positive uptake or staining area. (E and F) Segmented images using the Otsu threshold for autoradiography and EF5 staining image. Area in white is regarded as 64Cu-ATSM uptake area or positive staining area.
Statistical Analysis
At least 7 animals were included in each tumor line, and all data are presented as mean ± SEM. The differences in SUV and T/M ratio between the 3 tumor lines were determined by ANOVA. A multiple comparison procedure (Fisher least significant difference) was used to discriminate among the means. The differences between 64Cu-ATSM uptake area fraction and EF5 staining area fraction and between EF5 staining in carbogen-breathing and air-breathing were determined by the Student t test. Differences were considered to be statistically significant if P < 0.05.
RESULTS
64Cu-ATSM PET on 3 Tumors
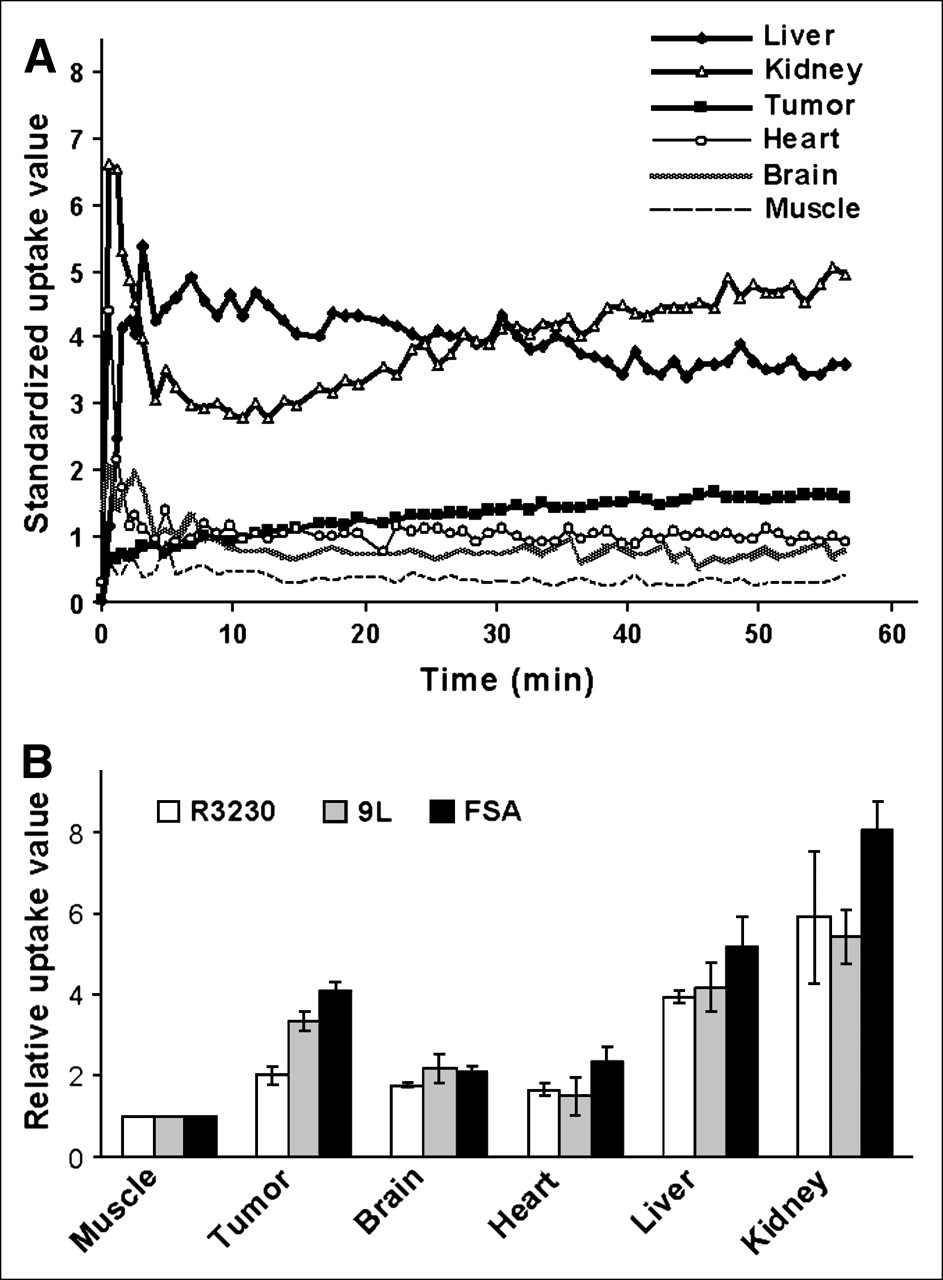
Biodistribution of 64Cu-ATSM in rat tumor model is shown in Figure 2. Figure 2A is a typical 64Cu-ATSM dynamic uptake in tumor and different organs of an animal bearing a 9L tumor. Figure 2B shows biodistribution data as the relative uptake value normalized to muscle tissue for 3 different tumor lines measured by autoradiography at 1 h after the injection of 64Cu-ATSM. 64Cu-ATSM shows high uptake in liver and kidney, indicating these as clearance organs for 64Cu-ATSM. The brain is not hypoxic under normal conditions and is used for comparison with tumor. A strikingly different uptake pattern was observed between brain and tumor. In brain tissue, the level of 64Cu-ATSM increased at the beginning and decreased gradually to a much lower level. In contrast, in tumor tissue, there was continuous uptake of 64Cu-ATSM until it reached a quasisteady-state level toward the end of the imaging period. The early rapid uptake of 64Cu-ATSM in the brain can be explained by the high perfusion in the brain and the high membrane permeability of 64Cu-ATSM. Because the brain is highly oxygenated, most of 64Cu-ATSM is not retained. The slower initial uptake in tumors was due to relatively lower perfusion, whereas the continuous accumulation was likely due to biochemical reduction and retention of 64Cu-ATSM in tumors. Similar biodistribution patterns were also found in R3230Ac and FSA.

Biodistribution of 64Cu-ATSM in tumor-bearing rat model. (A) Dynamic uptake of 64Cu-ATSM in different organs in 9L tumor-bearing rat measured from whole-body microPET. (B) Biodistribution data measured using autoradiography on organs taken from animals at 1 h after radiopharmaceutical injection in 3 tumor lines. Biodistribution data are presented as a relative uptake value for each organ normalized to muscle in each animal.
Figure 3A shows a typical 64Cu-ATSM microPET image. 64Cu-ATSM tumor uptake and retention curves from dynamic PET scans are shown in Figure 3B. The uptake of 64Cu-ATSM differed in the 3 tumor types. In R3230Ac, the uptake reached a plateau at approximately 30 min after injection, whereas in 9L and FSA tumors uptake continued to increase up to 60 min. Table 1 lists average animal weight, tumor volume, radiopharmaceutical dose, T/M ratio, and SUV (means ± SEM) for each tumor line. All 3 tumors have T/M ratios high enough to differentiate the tumor from surrounding tissues (from 2.3 to 5.3, Table 1). Among these 3 tumor lines, 9L tumor has a higher SUV and T/M ratio than R3230Ac (P < 0.05), and FSA tumor has the highest SUV and T/M ratio (2.04 ± 0.10 and 5.33 ± 0.25, respectively) with P < 0.001.

microPET of 3 different tumor types. (A) Typical PET image for R3230Ac with transverse, coronal, and sagittal sections. An ROI was drawn in transverse section to measure the uptake level. For each tumor, measurements were taken in 4 ROIs and averaged, representing an overall uptake level. (B) Dynamic uptake of 64Cu-ATSM in 3 tumors including R3230Ac (n = 8), 9L (n = 7), and FSA (n = 7). Uptake value in muscle was taken from R3230Ac animals.
Animal Parameters, Radioactivity Dosage, and 64Cu-ATSM Uptake in 3 Tumor Lines
64Cu-ATSM Uptake Versus Hypoxia
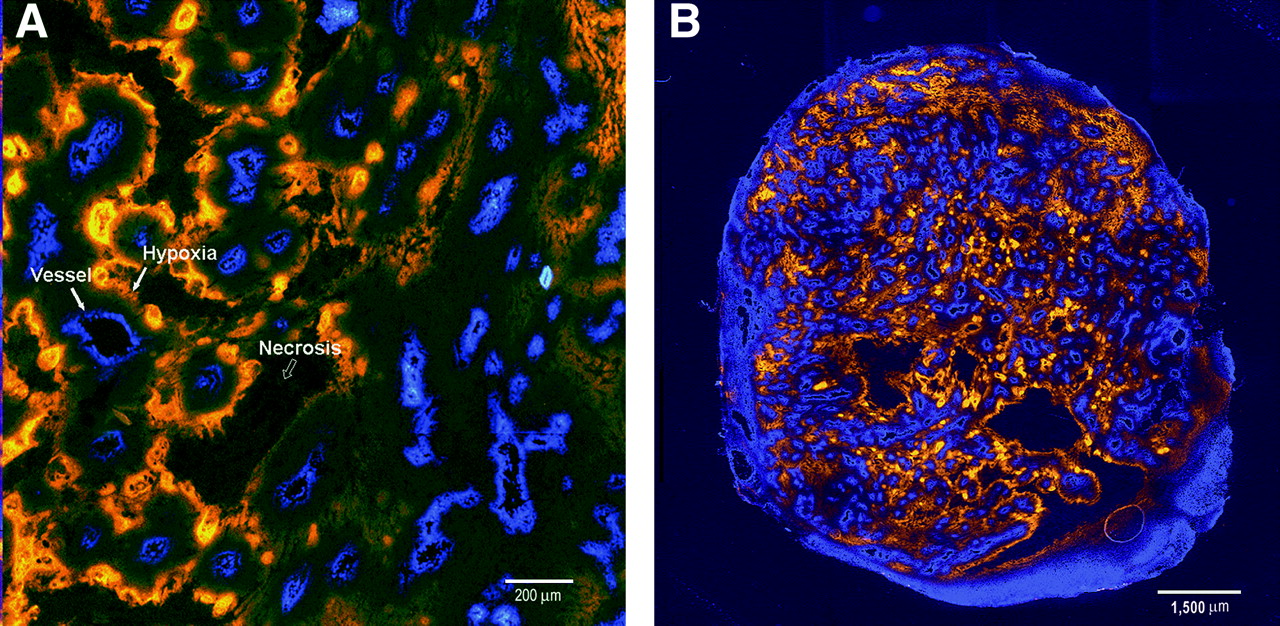
Figure 4 demonstrates typical dual EF5/Hoechst 33342–immunostained images from an R3230Ac tumor. A typical diffusion-limited hypoxia pattern is observed with EF5 binding intensity increasing with distance from perfused microvessels (Fig. 4A). The whole sutured image from the same tumor is shown in Figure 4B.

Typical immunostaining of EF5 binding in tumor tissues (R3230Ac). Dual fluorescence images (A) are overlaid to show distribution of hypoxia relative to vasculature. Hypoxic tissue is indicated by EF5 staining in orange. Vasculature is indicated by the Hoechst 33342 perfusion marker in blue. (B) A whole tumor section staining image was generated by stitching together images from microscope stage scans.
Five types of images—microPET, autoradiography, EF5 immunostaining, Hoechst fluorescence vascular imaging, and H&E histology—were aligned and compared. A series of images from an R3230Ac is shown in Figure 5 R3230Ac panel. Qualitative comparison revealed a similar pattern of distribution between EF5 and 64Cu-ATSM in R3230Ac tumor, both of which are complementary to Hoechst 33342. 64Cu-ATSM uptake area fraction measured from autoradiography is similar to the EF5 staining area fraction (0.24 ± 0.04 vs. 0.21 ± 0.03, P > 0.05; Table 2). Correlation analysis showed a reasonable spatial correlation between 64Cu-ATSM autoradiography and EF5 image in this tumor line (spatial correlation coefficient r = 0.74 ± 0.02, P < 0.001). Similar results were obtained for the 9L tumor, although the correlation coefficient was somewhat lower (0.61 ± 0.04, P < 0.001).
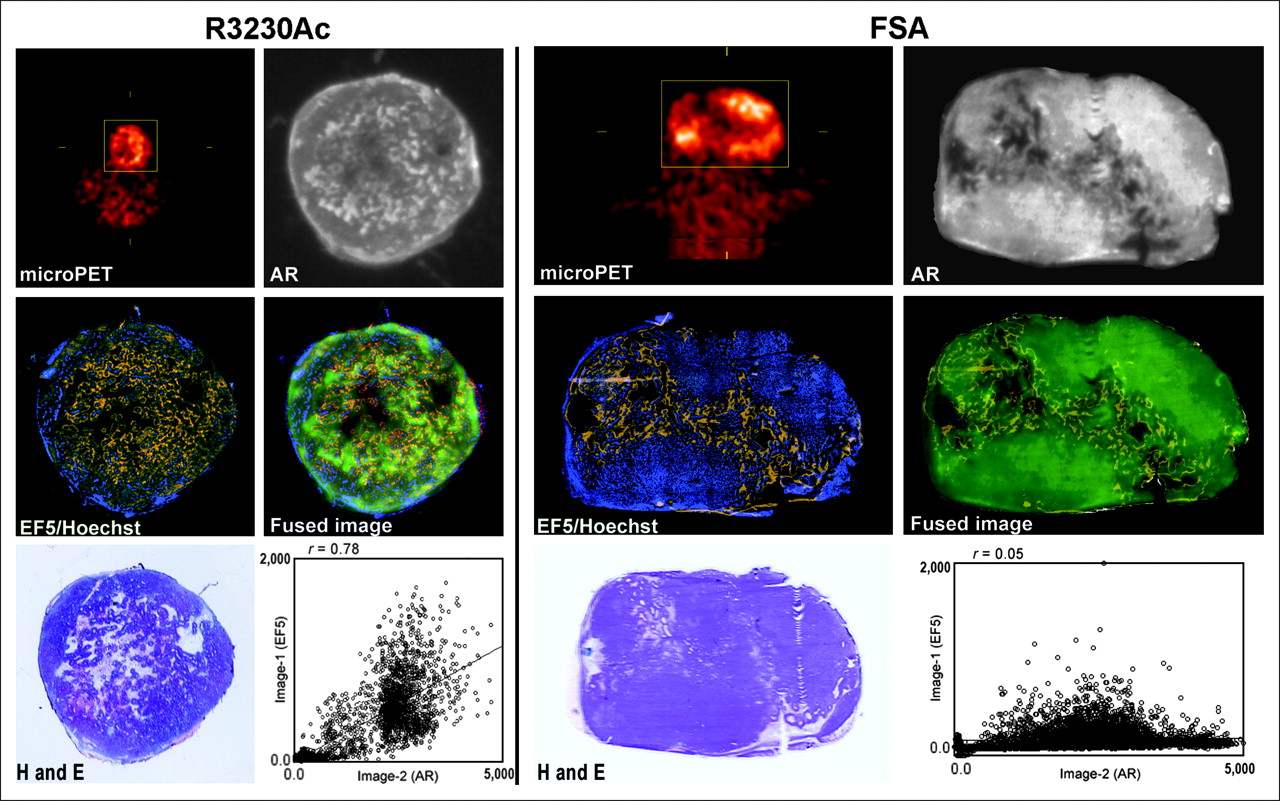
Comparisons between 64Cu-ATSM uptake and hypoxia measured by immunostaining in R3230Ac and FSA. Close correlation between 64Cu-ATSM uptake and EF5-stained hypoxic area was observed in R3230Ac tumor (left), whereas no correlation was found in FSA tumor (right). Images include 64Cu-ATSM microPET image, autoradiography (AR) section from same tumor, EF5 and Hoechst immunostaining from adjacent section, fused image from autoradiography and EF5 images, H&E staining, and correlation plot between autoradiography and EF5 staining images. EF5-stained hypoxic area is indicated by orange, perfused vessels are marked by blue fluorescent Hoechst 33342 dye, and 64Cu-ATSM distribution in AR is indicated by green in fused image. In FSA, a large amount of 64Cu-ATSM accumulated in well-perfused areas, which are indicated in Hoechst perfusion image. The spatial correlation between autoradiography and EF5 staining images in this specific FSA tumor is 0.05, whereas the spatial correlation is 0.78 in the shown R3230Ac tumor.
Comparison Between 64Cu-ATSM Uptake and EF5 Immunostaining
In contrast to R3230Ac and 9L, results obtained from FSA were strikingly different. Figure 5 FSA panel shows no correlation between the distribution of 64Cu-ATSM and EF5 binding. Surprisingly, the uptake of 64Cu-ATSM in FSA tumors was much lower in hypoxic areas than that in well-perfused areas (Fig. 5, FSA panel, fused image). The spatial correlation coefficient between 64Cu-ATSM autoradiography and the EF-5 staining image in FSA was only 0.11 ± 0.03. 64Cu-ATSM uptake area fraction is also significantly higher than EF5 staining area (Table 2). These results indicate a significant difference between 64Cu-ATSM uptake in the FSA tumor versus that in the other 2 tumors. Table 2 summarizes the 64Cu-ATSM uptake area fraction, EF5 staining area fraction, and spatial correlation data for all 3 tumor types.
To confirm the unexpected EF5–64Cu-ATSM pattern seen with FSA, comparison was made with 2 other hypoxia marker drugs, pimonidazole and CA-IX. Figure 6 shows the CA-IX staining and pimonidazole staining together with 64Cu-ATSM autoradiography in FSA tumor (Figs. 6A–6D). In both cases, the same complementary pattern of hypoxia immunostaining was seen, compared with 64Cu-ATSM autoradiography. Pimonidazole staining was also tested in R3230Ac tumors (Fig. 6F), and it showed a close correlation between 64Cu-ATSM uptake and pimonidazole binding (spatial correlation coefficient r = 0.73, P < 0.001), similar to what was seen with EF5.
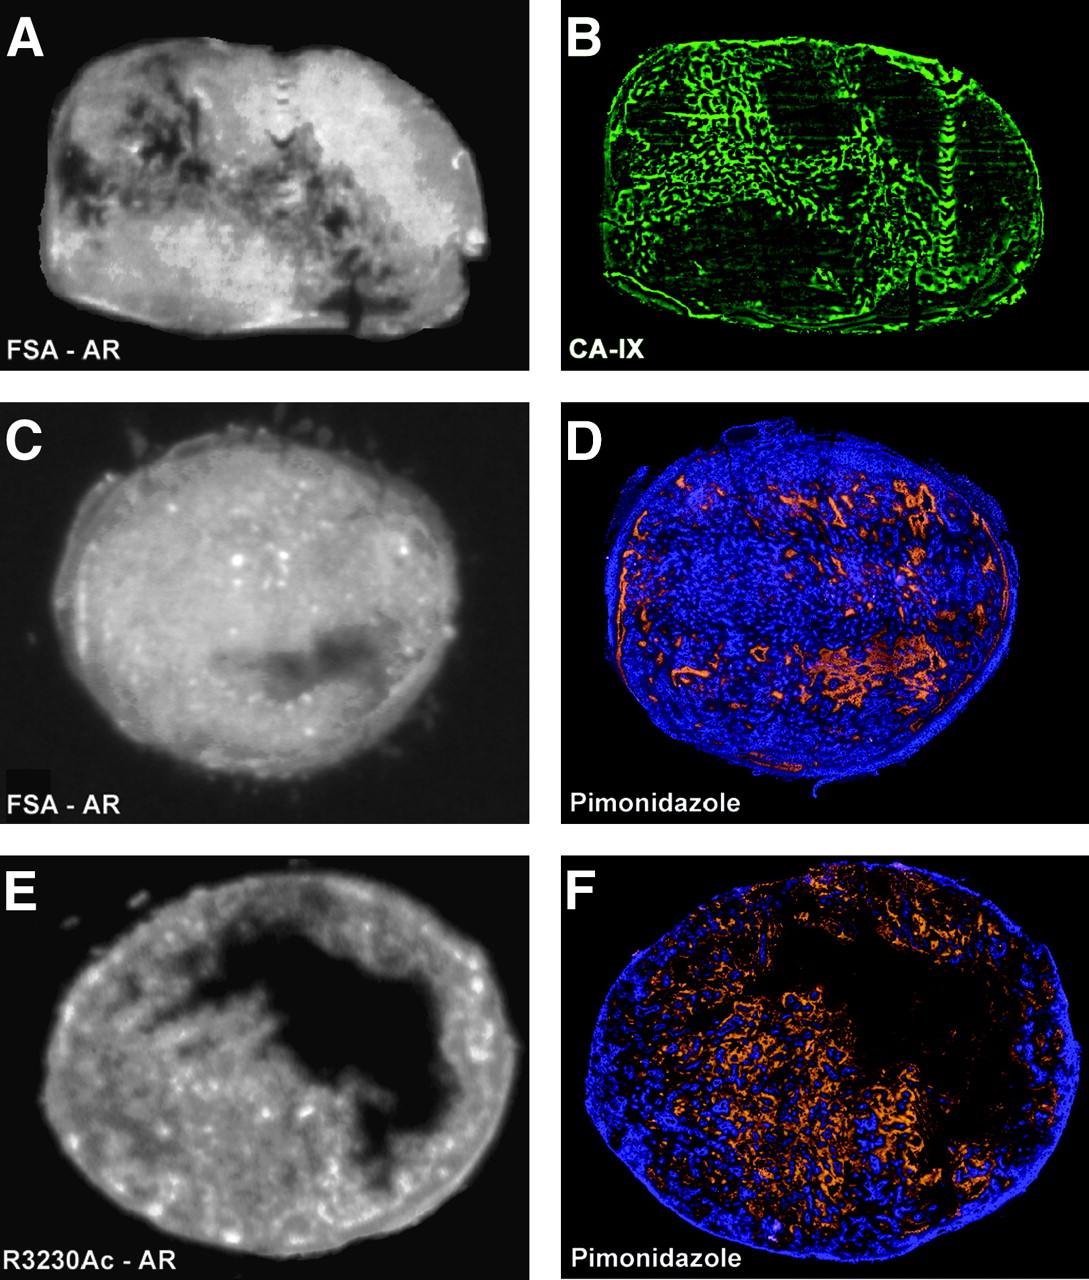
CA-IX and pimonidazole staining on FSA and R3230Ac tumor sections. (A and B) 64Cu-ATSM autoradiography (AR) and CA-IX staining (green) on same FSA tumor section (in same tumor as shown in Fig. 5, FSA panel). CA-IX staining shows a hypoxia distribution that is consistent with EF5 staining. (C and D) 64Cu-ATSM autoradiography and pimonidazole staining (orange) with Hoechst 33342 vascular perfusion marker (blue) illustrate low correlation between 64Cu-ATSM and this hypoxia marker in FSA. (E and F) 64Cu-ATSM autoradiography and pimonidazole staining in R3230Ac tumor. Close correlation can be seen between 64Cu-ATSM uptake and pimonidazole staining.
Carbogen-Breathing Experiments
Three animals bearing FSA tumors were subjected to carbogen breathing (95% Po2) to determine how this would affect binding of EF5 versus uptake of 64Cu-ATSM. A significant decrease of EF5 binding was observed in carbogen-breathing rats compared with air-breathing rats (P < 0.05, Table 3). However, there was not a significant decrease in 64Cu-ATSM uptake area fraction (0.615 ± 0.150 vs. 0.442 ± 0.094, P = 0.23). As in the initial studies, a significant difference between 64Cu-ATSM uptake distribution and EF5 staining was detected. Figure 7 provides an example of 64Cu-ATSM autoradiography and EF5 staining from the same carbogen-breathing FSA-bearing animal, indicating no correlation between the 64Cu-ATSM uptake and tumor hypoxia.
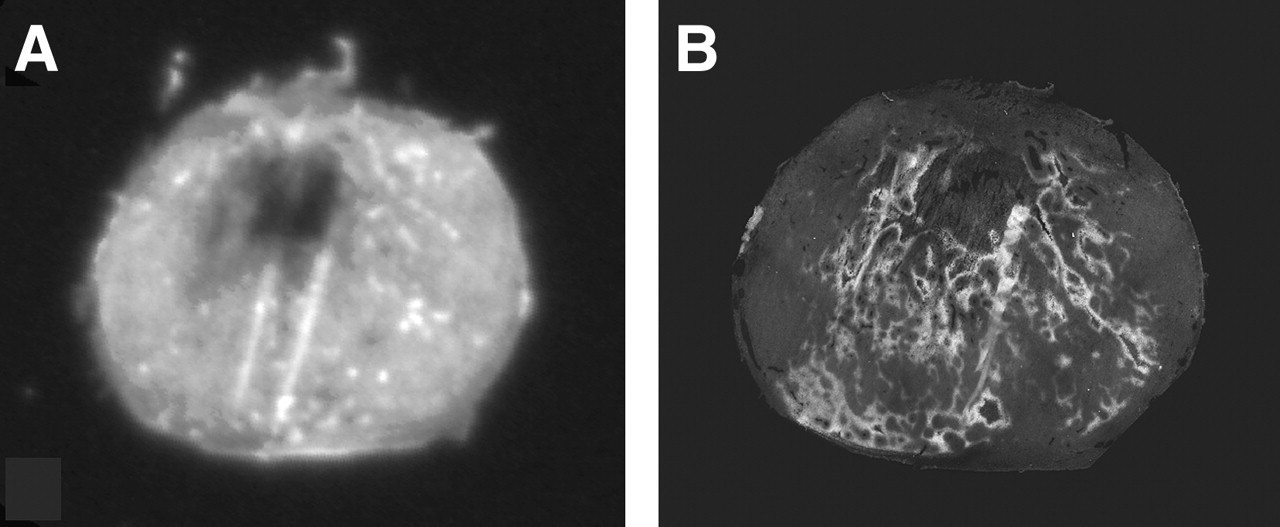
64Cu-ATSM distribution in response to oxygenation. FSA-bearing rats breathed carbogen for 3 h before and during microPET. (A) 64Cu-ATSM autoradiography image. (B) EF5 binding (orange) and Hoechst perfusion (blue) fluorescent staining image for the neighboring tumor section from same animal. There is no correlation between 64Cu-ATSM uptake and hypoxia marked by EF5 binding. A significant decrease in EF5 staining, but not uptake of 64Cu-ATSM, was found in carbogen-breathing animal group (Table 3).
Uptake of 64Cu-ATSM and EF5 Staining in Air-Breathing and Carbogen-Breathing Animals Bearing FSA Tumor
DISCUSSION
To our knowledge, this study is the first comparison between 64Cu-ATSM PET images and EF5 immunohistochemistry in multiple tumor types. We have shown that 64Cu-ATSM is a valid PET hypoxia marker in R3230Ac and 9L. However, we found hypoxia-independent uptake of 64Cu-ATSM in FSA.
Our study showed that 64Cu-ATSM has a relatively high T/M ratio within a short period of time compared with other potential hypoxia markers. At 1 h after injection in the rat mammary tumor R3230Ac, 64Cu-ATSM exhibited a T/M ratio of 2.29 ± 0.22. In contrast, Yang et al. reported a T/M ratio of 1.52 ± 0.17 for FMISO 1 h after injection for the 13762 rat mammary tumor (26), and Barthel et al. reported 1.8 for 18F-fluoroetanidazole (FETA) in the EMT6 mammary tumor (27). 18F-EF5 showed a T/M ratio of 0.9 in 9L tumor at 1 h after injection (28). In the same 9L tumor, we observed a much higher T/M ratio, 3.43, with 64Cu-ATSM within the same time frame.
The biodistribution results showed early uptake followed by washout of 64Cu-ATSM in the brain. However, there was still relatively higher 64Cu-ATSM uptake in the brain compared with muscle tissue. In R3230Ac tumor-bearing animals, for example, the level of 64Cu-ATSM seen in the brain at steady state is very close to that in the tumor (data not shown). The high brain uptake will make it difficult to use 64Cu-ATSM in differentiating a brain tumor from surrounding normal brain tissue. An additional complication was suggested by the study on Cu-ATSM retention mechanisms by Obata et al. in 2001 (13). They found different 64Cu-ATSM retention mechanisms in tumor cells and brain tissue. 64Cu-ATSM in tumor cells was reduced mainly in the microsome/cytosol and was more dependent on bioreductive enzymes, whereas, in mouse brain, it was reduced primarily in the mitochondria (13). Both high brain uptake of 64Cu-ATSM and uncertainty regarding its retention mechanisms limit the use of Cu-ATSM for brain tumor imaging.
A direct spatial correlation between the distribution of 64Cu-ATSM uptake and that of tumor hypoxia was analyzed in 3 tumor lines in this study. Lewis et al. demonstrated hypoxia-dependent uptake of 64Cu-ATSM in EMT6 mammary adenocarcinoma cells in vitro and heterogeneous uptake of 64Cu-ATSM in EMT6 tumors in vivo (8), but no evidence was provided for an in vivo spatial correlation between 64Cu-ATSM uptake and hypoxia. In 2001, Lewis et al. correlated the uptake of 64Cu-ATSM with hypoxia in 9L glioma in vivo using the oxygen needle probe method (9). However, the 1-dimensional nature of needle electrode–based oxygen measurement does not allow a direct spatial comparison between the tissue uptake of 64Cu-ATSM and the hypoxia level in vivo, particularly given the fact that hypoxia in tumors is usually heterogeneous (29). Dehdashti et al. assessed the 60Cu-ATSM PET in patients with non–small cell lung cancer (10) and cervical cancer (11) and reported a correlation between 60Cu-ATSM uptake and tumor response to radiotherapy. However, there was still no attempt to perform image correlation with location of Po2 measurement in their studies.
Recently, O'Donoghue et al. reported that the uptake of 64Cu-ATSM at 4 h after injection does not reflect the level of hypoxia in an R3327-AT anaplastic rat prostate tumor model, as assessed by pimonidazole immunostaining and oxygen needle probes (30). However, imaging at 16–20 h after injection of 64Cu-ATSM showed a good correlation with the distribution of tumor hypoxia. Their study displayed a temporal evolution of 64Cu-ATSM uptake from 0.5 to 20 h after the injection of radiopharmaceutical. This uptake rate was also dependent on tumor type.
Our study further demonstrates that retention of 64Cu-ATSM is dependent on tumor type. One difference is that O'Donoghue et al. measured the uptake at both 0.5 and 20 h after isotope injection (30), whereas we examined the uptake at 1 h after injection. The choice of the 1-h time point was based on the in vitro uptake study of Lewis et al. (8), in which they measured the uptake of 64Cu-ATSM at different time points until 1 h after the administration of 64Cu-ATSM. 64Cu-ATSM is highly permeable to cell membranes and can reach almost 80% of steady-state uptake in 30 min in vivo according to our study. Therefore, measuring the SUV and T/M ratio at 1 h after injection is quite representative. Although the report of O'Donoghue suggests an interesting approach to solve confounding biodistribution issues, the method of waiting 20 h after drug administration is not clinically practical. Although delayed imaging is realistic when using 64Cu-ATSM (t1/2 = 12.7 h), the β-emission from 64Cu also subjects patients to significant radiation dose. 60Cu (t1/2 = 23.7 min) and 62Cu (t1/2 = 9.7 min) do not subject patients to extra β-radiation and are therefore preferred for clinical diagnostic applications. However, the short half-lives of these isotopes preclude delayed imaging.
A possible reason for the low correlation between 64Cu-ATSM uptake and hypoxia distribution in FSA could be the differing redox statuses of the tumor types. FSA tumors may have a lower-than-average redox potential with high concentrations of electron donors. This redox status might be related to the tumor metabolism rate. We recently published results showing that, even though FSA has a comparable level of hypoxia to R3230Ac, it has much higher glucose consumption rate (29). A relatively low redox potential in FSA normoxic cells could lead to 64Cu-ATSM reduction and trapping.
The higher perfusion level surrounding normoxic cells compared with hypoxic cells could also contribute to the higher uptake of 64Cu-ATSM in normoxic FSA cells. Our results from carbogen-breathing experiments have indicated the influence from blood perfusion on the 64Cu-ATSM uptake. We have known that carbogen can enhance the tumor blood flow and, hence, decrease the hypoxia level in FSA-bearing animals. This is consistent with our decreased EF5 binding and the higher initial uptake (first 1 min) we observed in the dynamic uptake curves (data not shown). However, this decrease in hypoxia was not accompanied by the expected decrease in 64Cu-ATSM uptake. A trend of higher 64Cu-ATSM SUV and increased uptake area fraction was observed along with the increased perfusion level. This indicates that the blood perfusion may play a role in 64Cu-ATSM uptake in carbogen-treated FSA tumor. Future research needs to focus on this and other potential mechanisms that may underlie the spurious retention pattern of this marker in FSA.
CONCLUSION
We have demonstrated that the validity of 64Cu-ATSM uptake as a marker of hypoxia is dependent on tumor type. This raises concerns regarding the usage of this marker to identify hypoxia with great certainty. In spite of the evidence that 64Cu-ATSM uptake may not always accurately reflect the level of hypoxia, Dehdashti et al. demonstrated correlations between 60Cu-ATSM PET uptake and treatment outcome in 2 small clinical series of patients with lung (10) and cervical cancer (11) treated with radiotherapy. This evidence strongly suggests that retention of this compound may be associated with poor prognosis. Additional studies that further delineate what this marker is telling us about the environment or metabolism of the tumor cell may still demonstrate its usefulness as a predictive assay.
Acknowledgments
The authors appreciate Dr. G. Allan Johnson, Director of the Center for In Vivo Microscopy at Duke University Medical Center, for the support on use of the microPET facility, Dr. Michael Zalutsky, Director of the Radiolabeling Shared Resource of the Duke Comprehensive Cancer Center, Dr. Gamal Akabani for support on use of the radiolabeling facility and autoradiography instruments, and Dr. Cameron Koch for providing EF5 and the antibodies. The work is supported by grants from the Department of Defense (DAMD17-03-01-0367) and the National Institutes of Health/National Cancer Institute (CA42745, CA40355, R24 CA92656, and R24 CA86307).
References
- Received for publication November 14, 2005.
- Accepted for publication February 15, 2006.


Jump to section
Related Articles
Cited By...
- Addressing Biological Questions with Preclinical Cancer Imaging
- 64Cu-ATSM Reflects pO2 Levels in Human Head and Neck Cancer Xenografts but Not in Colorectal Cancer Xenografts: Comparison with 64CuCl2
- Oxygen-Enhanced MRI Is a Major Advance in Tumor Hypoxia Imaging
- Comparison of the Hypoxia PET Tracer 18F-EF5 to Immunohistochemical Marker EF5 in 3 Different Human Tumor Xenograft Models
- On the Destiny of (Copper) Species
- A Comparison of the Behavior of 64Cu-Acetate and 64Cu-ATSM In Vitro and In Vivo
- Heterogeneity in Intratumor Correlations of 18F-FDG, 18F-FLT, and 61Cu-ATSM PET in Canine Sinonasal Tumors
- Interrogating Tumor Metabolism and Tumor Microenvironments Using Molecular Positron Emission Tomography Imaging. Theranostic Approaches to Improve Therapeutics
- Imaging hypoxia in gliomas
- Preclinical evaluation and validation of [18F]HX4, a promising hypoxia marker for PET imaging
- NADPH oxidase-mediated reactive oxygen species production activates hypoxia-inducible factor-1 (HIF-1) via the ERK pathway after hyperthermia treatment
- PET of Hypoxia with 89Zr-Labeled cG250-F(ab')2 in Head and Neck Tumors
- Retention of the Radiotracers 64Cu-ATSM and 64Cu-PTSM in Human and Murine Tumors Is Influenced by MDR1 Protein Expression
- Noninvasive 64Cu-ATSM and PET/CT Assessment of Hypoxia in Rat Skeletal Muscles and Tendons During Muscle Contractions
- Applications of Nitroimidazole In Vivo Hypoxia Imaging in Ischemic Stroke