


Abstract
The distribution of benzodiazepine receptors in the human brain has been widely studied with SPECT using 123I-iomazenil and semiquantitative approaches, but these methods do not allow quantification of the total receptor site concentration available for binding (B′max) and of the apparent equilibrium dissociation constant (Kd/VR). One of the major obstacles to full quantitative studies is that pharmacologic effects preclude the administration to humans of the high doses of iomazenil required to displace the labeled ligand from the receptors. In this study, we applied a dual-ligand protocol using the unlabeled ligand flumazenil, which lacks pharmacologic effects, to quantify all binding parameters of the benzodiazepine receptor–123I-iomazenil interactions. Methods: 123I-Iomazenil SPECT and MRI were acquired in 8 healthy volunteers, one of whom had participated in a 11C-flumazenil PET experiment. The experimental protocol consisted of injections of 123I-iomazenil and/or unlabeled flumazenil. We developed a kinetic model to integrate the different pharmacokinetics of these 2 ligands. To simplify the model, we assumed linear relationships between iomazenil and flumazenil parameters and adjusted them using a coupled fitting procedure. The resulting constrained 5-parameter model was then used to quantify the biologic parameters. Results: Across regions, we obtained B′max values ranging from 7 to 69 pmol/mL and KdVR values for IMZ from 2.3 to 3.7 pmol/mL. There was a close correlation in the B′max values calculated in the same volunteer using 123I-iomazenil SPECT and 11C-flumazenil PET. Conclusion: The dual-ligand approach can be used to quantify all model parameters with acceptable SEs. This work demonstrates a theoretic framework and initial application of SPECT to quantify binding parameters.
Benzodiazepine receptors have been implicated in the pathophysiology of several neurologic and psychiatric disorders (1–3). In humans, the distribution of these receptors has been mainly studied using PET and 11C-flumazenil (11C-FMZ) (4–6) as well as using SPECT and 123I-iomazenil (123I-IMZ) (4–9).
Because of the increasing use of PET and SPECT for routine clinical diagnosis, quantitative and semiquantitative methods have been developed using 11C-FMZ and 123I-IMZ. PET has been used mainly for quantitative studies with multiinjection protocols (10,11). With an appropriate mathematic model, it is possible to extract from PET kinetic data absolute values of biologic parameters, including the total receptor site concentration available for binding (B′max) and ligand affinity (1/Kd) (Kd is the equilibrium dissociation constant) (10,12). In contrast, although more accessible than PET, SPECT provides little information about B′max and Kd for the 123I-IMZ radioligand. The absolute quantification of benzodiazepine receptors using 123I-IMZ has been hampered by lower sensitivity of the scanners for SPECT than those for PET. Consequently, SPECT studies have been restricted to semiquantitative approaches that typically calculate only an index of receptor concentration, such as the binding potential (BP) or the distribution volume (DV) (7,8,13–15). However, these simplified approaches are based on several assumptions, which should be verified for each radioligand before any routine use. Indeed, the ability to derive accurate receptor-binding information from the DV or BP largely depends on the pharmacokinetic properties of the radiotracer (13). A full quantitative approach is essential to validate these underlying assumptions and, by comparing the indices of binding parameters with the B′max, it evaluates the efficiency and robustness of these indices (14,16).
The emergence of a new generation of SPECT scanners with better resolution and sensitivity has allowed optimization of experimental protocols for estimating B′max and Kd. To do this, the radioligand must be injected at different specific activities along with large doses of unlabeled ligand. However, IMZ is a partial inverse agonist with several pharmacologic effects and, therefore, cannot be administered to humans at high doses (17).
In the present work, we used a full quantitative approach with SPECT to study the interaction between benzodiazepine receptors and 123I-IMZ. This approach was based on the multiinjection protocol defined by Delforge et al. (10) for PET studies. Because FMZ is an antagonist without pharmacologic effects when injected at high doses, we used it instead of IMZ as the unlabeled ligand (18). In addition, we developed a kinetic model to integrate the different affinities of the unlabeled and labeled ligands. We show that this dual-ligand approach allows the quantification of receptor concentration and ligand affinity from SPECT data.
MATERIALS AND METHODS
Subjects
Eight healthy volunteers (mean ± SD, 27.1 ± 7.3 y; range, 22-46 y; 7 males, 1 female) with no history of neurologic or psychiatric diseases participated in this study. Images from SPECT and MRI were acquired for all volunteers. Data from 1 of these volunteers who had already participated in a previous study (14) were used for a direct PET and SPECT comparison of B′max. All volunteers gave informed consent before scanning, and the studies were approved by the Research Ethics Committee of Geneva Hospital.
SPECT Experiments
During the scans, the subjects were lying with the head positioned in a head holder so that the transaxial slices were parallel to the orbitomeatal line. Scans were acquired with a Toshiba GCA-9300A/HG triple-head SPECT system in continuous rotation mode using a superhigh-resolution fanbeam collimator (19,20). Based on a radius of 132 mm, the tomographic spatial resolution at the center was 7.8-mm full width at half maximum with the superhigh-resolution fanbeam collimator. Raw data were reconstructed by filtered backprojection (Shepp and Logan filter) and corrected using the triple-energy window scatter correction method presented by Ogawa et al. (21). The images were corrected for attenuation using the Chang filtered method. The attenuation correction coefficient, μ, was set at 0.150 cm−1, assuming uniform attenuation equal to that of 160-keV γ-ray water within an ellipse drawn around the transaxial plane (22). Images were displayed on a 128 × 128 × 46 matrix (pixel size = 1.72 × 1.72 × 6.88 mm). Activities in cpm/mL were then converted to μCi/mL using a calibration procedure (14). Briefly, the phantom used for calibration was an 123I distributed source (50 MBq) of 6-cm diameter acquired for 15 min and reconstructed with the same protocol used in this study. The average cpm/mL was measured with a large region of interest (ROI) positioned in the phantom image. One sample (1 mL) of the phantom solution was measured with the γ-counting system to determine the calibration factor between SPECT and γ-counting system measurements.
The multiinjection protocol requires injection of a labeled ligand, displacement by injection of the unlabeled ligand, and coinjection of labeled and unlabeled ligand. To ascertain if a low tracer signal level at the time of displacement can influence the estimation of some of the kinetic parameters, we switched the order of the displacement and the coinjection in half of the volunteers. Therefore, SPECT scans were performed using one of the following 2 protocols: protocol 1 included 123I-IMZ injection at the start time (T0), displacement by injection with unlabeled FMZ at T0 + 70 min, and coinjection of 123I-IMZ and unlabeled FMZ at T0 + 110 min; protocol 2 included 123I-IMZ injection at T0, coinjection of 123I-IMZ and unlabeled FMZ at T0 + 70 min, and displacement by injection with unlabeled FMZ at T0 + 110 min.
At the scan start time, approximately 74 MBq of 123I-IMZ were injected intravenously. The displacement procedure consisted of injection of 0.02 mg/kg of FMZ, and the coinjection procedure used a mixture of 74 MBq 123I-IMZ and 0.02 mg/kg FMZ. All injections were administered with a constant volume (30 mL) over a 1-min period using an infusion pump. Details of the injected doses and specific activities are listed in Table 1. A set of 80 sequential 2-min SPECT scans was obtained over 160 min.
Numeric Values of PET and SPECT Protocol Parameters Corresponding to 8 Experiments
PET Experiment
Details of the PET experiment, performed on 1 healthy volunteer with a whole-body scanner (Advance; GE Healthcare), have been previously reported (14).
In brief, the brain transaxial images were reconstructed using a filtered backprojection (128 × 128 matrix; 35 slices; 2.34 × 2.34 × 4.25 mm voxel size). A 10-min transmission scan was obtained to correct for photon tissue attenuation. The data were also corrected for decay.
The PET protocol consisted of 3 intravenous injections: injection of the tracer (148 MBq of 11C-FMZ) at T0, injection of unlabeled 0.01 mg/kg FMZ at T0 + 30 min, and coinjection of labeled (148 MBq) and unlabeled (0.02 mg/kg) FMZ at T0 + 60 min (10). All injections were administered over a 1-min period using an infusion pump. Details of injected doses and specific activities are listed in Table 1. A set of 48 sequential PET scans of increasing duration after each injection of labeled FMZ was obtained over a 104-min period (14).
Analysis of Arterial Plasma
To assess the labeled input function of radiotracers, Cp*(t), an arterial catheter was inserted into the radial artery under local anesthesia and after establishing the presence of satisfactory collateral circulation. Fifty-one 3-mL arterial whole blood samples were manually withdrawn during the SPECT experiments (57 for the PET experiment): 1 sample was taken every 15 s during the first 4 min, after which samples were taken following an additional 30 s and 1, 2, and 5 min. The 123I-IMZ and 11C-FMZ metabolites were measured using 45 and 37 blood samples, respectively. Metabolites were extracted using a chloroform separation procedure (23–25) in which the radioactivity in the chloroform layer represents the amount of unchanged radioligand remaining in the plasma (25). After a rapid centrifugation of the blood (5,000g for 5 min at 4°C), the 123I and 11C radioactivity in the plasma was measured using a γ-counting system (Packard Cobra II; Perkin-Elmer) and corrected for physical decay.
For quantitative purposes, Cp*(t) was fitted using 3- and 1-exponent models for 123I-IMZ and 11C-FMZ, respectively. 123I-IMZ metabolism is faster than that of 11C-FMZ. Therefore, the relative clearance of the free 123I-IMZ parent compound is better described by a 3-exponent model (8,10). Measurements in units of cpm/mL were converted into units of MBq/mL using a calibration factor that had been obtained before each experiment with an appropriate calibrated phantom (14).
Compartmental Models
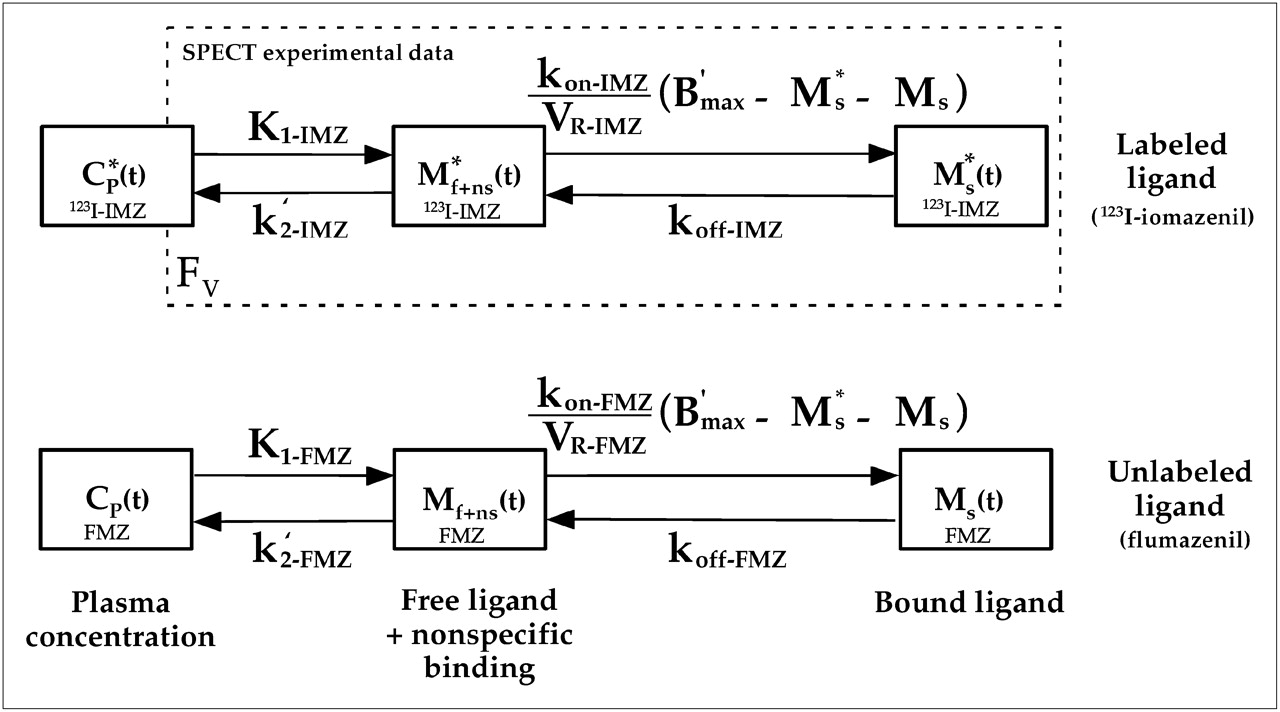
Figure 1 shows the appropriate 3-compartment model used to fit the SPECT data. In this model, the kinetics of the unlabeled ligand affected the local concentration of free receptor sites and must therefore be considered. Moreover, the kinetics of the labeled 123I-IMZ and the unlabeled FMZ ligand are different. Therefore, the model includes competition of the labeled 123I-IMZ and the unlabeled FMZ for the same receptors. The 2 ligands have their own individual parameters except for the total receptor site concentration available for binding B′max, which is common to both ligands. Cp*(t) and Cp(t) are the input functions of the model, and they correspond to the plasma concentration of the unchanged labeled (123I-IMZ) and unlabeled (FMZ) ligands, respectively. Parameter identification and simulations of labeled and unlabeled ligand kinetics were performed using the equation system corresponding to the model shown in Figure 1.

Three-compartment model used to fit SPECT data. This model contains 2 components for labeled and unlabeled ligands with individual parameters for IMZ and FMZ. Compartments Cp*(t) and Cp(t) represent unchanged plasma 123I-IMZ and FMZ, respectively; Mf+ns(t) represents free and nonspecifically bound ligand, and Ms(t) represents specifically bound ligand. Parameters K1 and k′2 are associated with exchanges between plasma and free/nonspecifically bound ligand compartment. B′max represents concentration of receptors available for binding and is defined as the common parameter of the model; kon and koff are association and dissociation rate constants, respectively; and VR is volume of the reaction, which accounts for tissue inhomogeneity (26). Consequently, only the apparent equilibrium dissociation constant, KdVR, can be estimated. Kd is equilibrium dissociation constant, defined as the ratio of koff to kon. Parameter FV represents the fraction of blood present in tissue volume and was fixed at 0.04 (13,27,28).
The labeled IMZ kinetics are described by the following relationships: Eq. 1
Eq. 1 Eq. 2and the unlabeled FMZ kinetics are described by:
 Eq. 3
Eq. 3 Eq. 4where B′max, K1-IMZ, k′2-IMZ, kon-IMZ/VR-IMZ, koff-IMZ, K1-FMZ, k′2-FMZ, kon-FMZ/VR-FMZ, koff-FMZ, are the unknown parameters. The parameters K1 and k′2 are associated with the exchanges between the plasma and the free/nonspecifically bound ligand compartment. The kon and koff parameters are the association and dissociation rate constants, respectively; and VR is the volume of the reaction, which accounts for tissue inhomogeneity (26). Consequently, only the apparent equilibrium dissociation constant, KdVR, can be estimated. Kd is the equilibrium dissociation constant, defined as the ratio of koff to kon. The parameter FV represents the fraction of blood present in the tissue volume and was fixed at 0.04 (13,27,28). Mf+ns(t) represents the quantity of the free and nonspecifically bound ligand; and Ms(t) represents the quantity of specifically bound ligand. The M*(t) and M(t) refer to labeled and unlabeled ligand, respectively.
The SPECT experimental data, denoted by  , collected between times ti-1 and ti, are given by the following integral relationship:
 Eq. 5From the estimated model parameters, the distribution volume can be calculated using the following equation (13):
 Eq. 6Using the first 70 min of the SPECT protocol (data corresponding to the first injection), K1 and k″2 can be estimated with a 1 tissue-compartment model (13) from which the DVT″ parameters are calculated:
 Eq. 7
Eq. 7
Simplification of Model Parameters
The model defined in Figure 1 involves 9 unknown parameters (B′max, K1-IMZ, k′2-IMZ, kon-IMZ/VR-IMZ, koff-IMZ, K1-FMZ, k′2-FMZ, kon-FMZ/VR-FMZ, koff-FMZ). All of these parameters cannot be estimated together using PET or SPECT data. Therefore, we have to simplify the model.
If we consider the following relationship deduced from the Renkin–Crone equation (29): Eq. 8where extraction (E) is related to flow (F), and to the product of permeability (P) and capillary surface area (S):
 Eq. 9and
 Eq. 10and the distribution volume for each tracer:
 Eq. 11and
 Eq. 12we can deduce that:
 Eq. 13where
  and that:
 Eq. 14where
  . Because only the permeability (P) of each ligand is different, we assume that A is a constant. If we consider the following definitions:
 Eq. 15and
 Eq. 16we can deduce that:
 Eq. 17where
 Eq. 18
We used Equations 13, 14, 17, and 18 to define A, B, C, and D parameters, which are expected to be constant in the whole brain. If the A, B, C, and D values are known, the resulting constrained model requires the estimation of only 5 parameters.
Therefore, a coupled fit is first used to correctly estimate for each volunteer the A, B, C, and D IMZ and FMZ common parameters among several ROIs. Briefly, we obtained for each volunteer the time−concentration curves from 8 ROIs (radius = 5 mm) that are to be included in coupled fitting. Using these dynamic data and the constrained model, the coupled fit of the 8 ROIs, finds a separate K1-IMZ, k′2-IMZ, kon-IMZ/VR-IMZ, koff-IMZ, and B′max for each curve, but delivers the A, B, C, and D common to the 8 regions. This method improves the identification of common parameters (30,31).
Finally, in a second fit, these common parameters were used as fixed constants in the model that was applied to the ROIs described in the data analysis, to estimate the kinetic parameters: K1-IMZ, k′2-IMZ, kon-IMZ/VR-IMZ, koff-IMZ, and B′max.
Input Functions of Model
To solve the equation system corresponding to the model shown in Figure 1, the time course of CP(t) (unlabeled ligand) must be known. When using the same ligand for the labeled and unlabeled injections, as is the case for the PET and FMZ experiments, it is possible to calculate CP(t) from the  measurements, using the following equation:
  , where J and
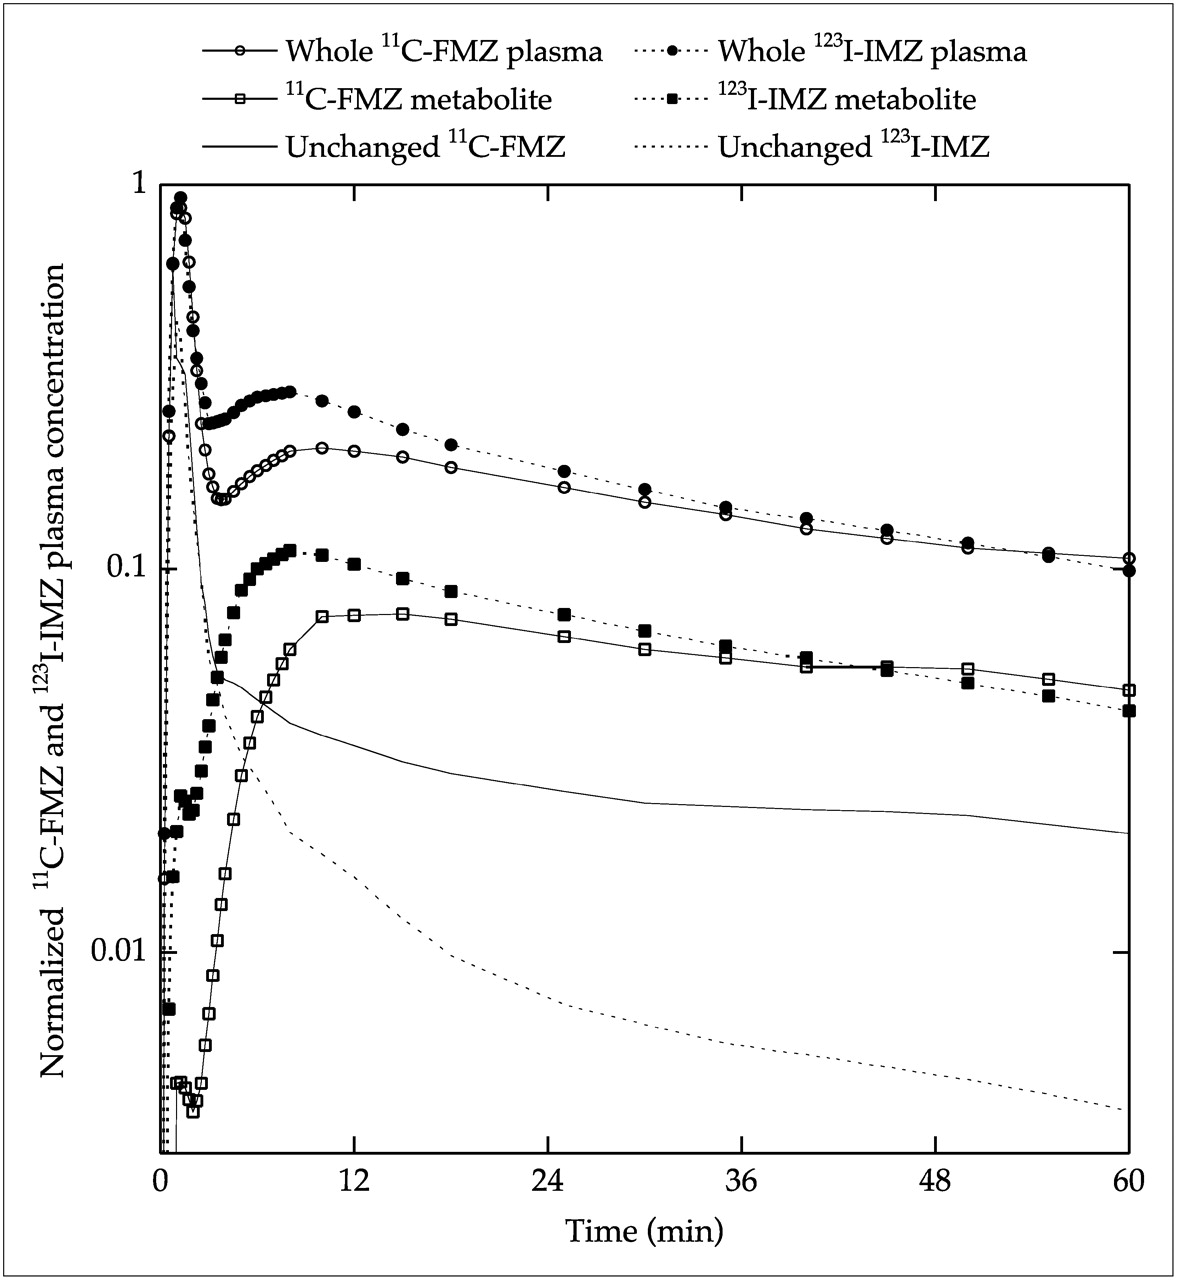
  represent the labeled and unlabeled injected doses, and tD is the delay between labeled and unlabeled injections (32). In the case of our SPECT experiments, the use of different ligands for labeled (123I-IMZ) and unlabeled (FMZ) injections precludes the application of this relationship. Therefore, to obtain the time course for unlabeled FMZ from 123I-IMZ, we calculated the relationship between the plasma kinetics for 11C-FMZ and 123I-IMZ using blood data from a previous study (14). In this former study, we had obtained arterial input functions in 7 volunteers who underwent both 11C-FMZ PET and 123I-IMZ SPECT scans. The averaged 11C-FMZ and 123I-IMZ plasma time–concentration curves obtained from this previous study are shown in Figure 2. 123I-IMZ metabolism was faster than that of 11C-FMZ, which leads to a different whole plasma time course. The time course of unchanged plasma 11C-FMZ can be obtained from that of the unchanged plasma 123I-IMZ using the following relationship: 11C-FMZ = (f1FMZ/f1IMZ) × (123I-IMZ/(0.72 e−0.08[t-6.3])). The values used for the free fraction of plasma parent compound, f1, were f1FMZ = 0.5 and f1IMZ = 0.33 (7,8,33).

Time courses of 11C-FMZ and 123I-IMZ plasma components obtained from previous study for 7 healthy volunteers (14). Time courses of unchanged plasma levels of both tracers are linked by the following relationship: 11C-FMZ = (f1FMZ/f1IMZ) × (123I-IMZ/(0.72 e−0.08[t-6.3])), where f1FMZ = 0.5 and f1IMZ = 0. 33.
Image Processing
For anatomic localization of the cortical structures, a T1-weighted brain MR image volume was obtained for each volunteer (Eclipse, Picker; 1.5 T; repetition time = 15 ms; echo time = 4 ms; pixel size = 0.98 × 0.98 × 1.10 mm). To realign the MRI to the SPECT images, SPECT frames 23–30 were averaged to produce a mean SPECT image, which provided a satisfactory definition of the whole brain anatomy. For each volunteer, the MR image was aligned with the volunteer's mean SPECT image using Automated Image Registration (version 3.08) software (34,35) with a rigid body transformation (6 parameters) algorithm. The PET images were also realigned with the SPECT images.
Data Analysis
Using MR images to identify cerebral structures, ROIs (radius = 5 mm) were placed, including the cerebellum, the pons, and the temporal, frontal, and occipital cortices. These ROIs were then applied to the dynamic SPECT images, and the time–concentration curves were extracted.
For comparison of PET and SPECT B′max for the volunteer who underwent both experiments, we used a set of 146 ROIs (radius = 10 mm) placed in the whole brain on MR images and applied them to the dynamic PET and SPECT images. Because of the high noise level in the SPECT data, there were divergences in kinetic parameters in 5 of the 146 ROIs during the identification procedure. These 5 ROIs corresponded to brain regions involving white matter with a very low signal-to-noise ratio and were not used for further analysis. Model parameters were identified through minimization of a weighted least-square cost function using a Marquardt algorithm (36).
RESULTS
Identification of Common Parameters
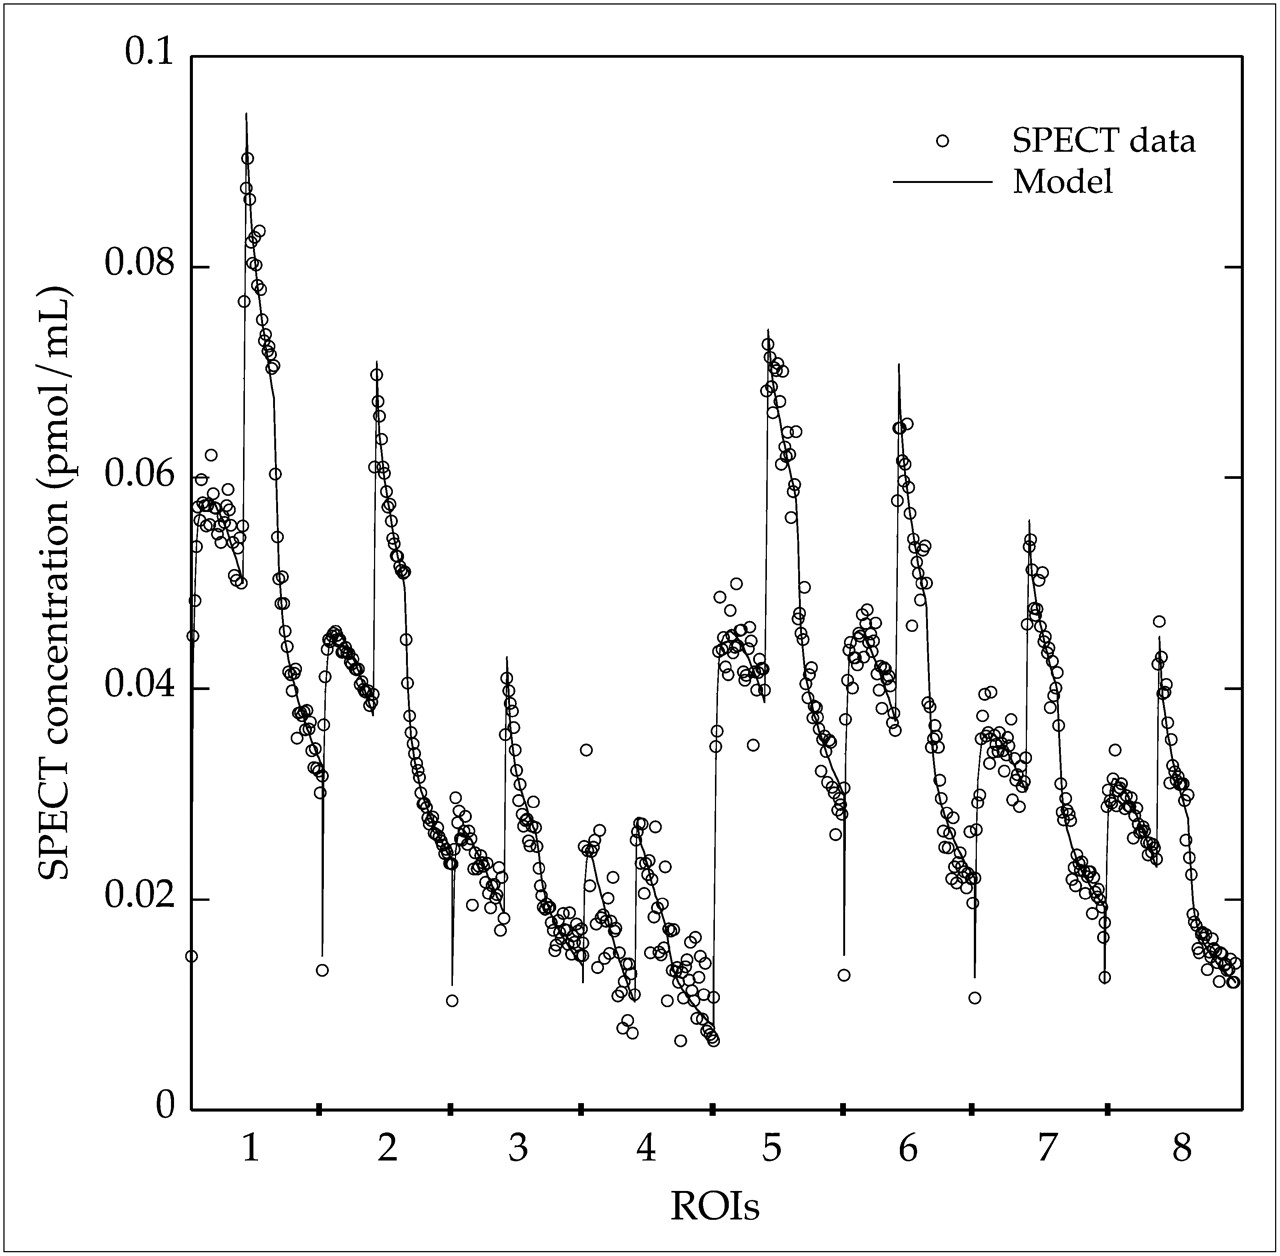
Figure 3 shows an example of a coupled fit for 1 volunteer. All time−concentration curves were correctly fitted by the model shown in Figure 1. The mean values of the common parameters across volunteers were A = 1.18 ± 0.36, B = 5.74 ± 2.39, C = 1.58 ± 0.67, and D = 5.18 ± 3.68. We deduced from A/B that DVf+ns-FMZ/DVf+ns-IMZ = 0.206 and, from D/C, that Kd-FMZ = 3.28 × Kd-IMZ. Afterward, only the constrained model was used to fit IMZ model parameters using individual A, B, C, and D fixed values.

Example with 1 volunteer of a coupled fit obtained among 8 ROIs placed on gray matter (1), whole brain (2), white matter (3), pons (4), occipital cortex (5), frontal cortex (6), temporal cortex (7), and cerebellum (8). Common parameters were estimated simultaneously, and resulting values were used as constants to simplify the model.
SPECT Time–Concentration Curves
Figure 4 shows examples of time–concentration curves obtained with protocols 1 (Fig. 4A) and 2 (Fig. 4B) with a large ROI corresponding to the whole brain. A rapid increase in the concentration of radioligand was observed after each labeled injection. At the time of displacement, a rapid decrease was observed regardless of the protocol used. The injection of FMZ resulted in approximately 30% displacement of 123I-IMZ.

Compartmental analysis allows simulation of time courses for each compartment: free/nonspecifically bound and specifically bound ligand for 123I-IMZ (A and B) and FMZ (C and D). The first column corresponds to protocol 1 and the second column corresponds to protocol 2. Only the labeled input function of the model is represented here. Estimated IMZ model parameters were as follows: for A and C, B′max = 53 ± 1 pmol/mL, K1 = 0.54 ± 0.01 min−1, k′2 = 0.19 ± 0.01 min−1, kon/VR = 0.071 ± 0.003 mL/pmol·min, koff = 0.18 ± 0.01 min−1; and for B and D, B′max = 44 ± 2 pmol/mL, K1 = 0.44 ± 0.01 min−1, k2 = 0.20 ± 0.01 min−1, kon/VR = 0.100 ± 0.003 mL/pmol·min, koff = 0.24 ± 0.01 min−1.
The time courses of the radioligand concentration in all model compartments can be simulated. We found that the measured SPECT activity corresponded mainly to the specifically bound radioligand (Figs. 4A and 4B). The large dose of unlabeled FMZ injected during displacement causes a large decrease in the labeled ligand, and this effect is more accentuated with protocol 2. Figures 4C and 4D show that a large proportion of the receptors were occupied by the unlabeled ligand when FMZ was injected.
Estimates of Individual Parameters
Table 2 shows average values of model parameters estimated for 5 ROIs in the 8 volunteers. Because there was no significant difference in the fit obtained by protocols 1 and 2, we averaged all estimated values. The B′max values varied across the regions from 7 to 69 pmol/mL and the KdVR values ranged from 2.3 to 3.7 pmol/mL. In addition, the K1-IMZ values ranged from 0.55 to 0.77 min−1, and the k′2-IMZ values ranged from 0.14 to 0.83 min−1. We also calculated high values for K1-FMZ and k′2-IMZ, ranging from 0.63 to 0.86 and from 0.76 to 5.03, respectively.
Mean Model Parameter Values Estimated Using Dual-Ligand Approach Across 8 Subjects
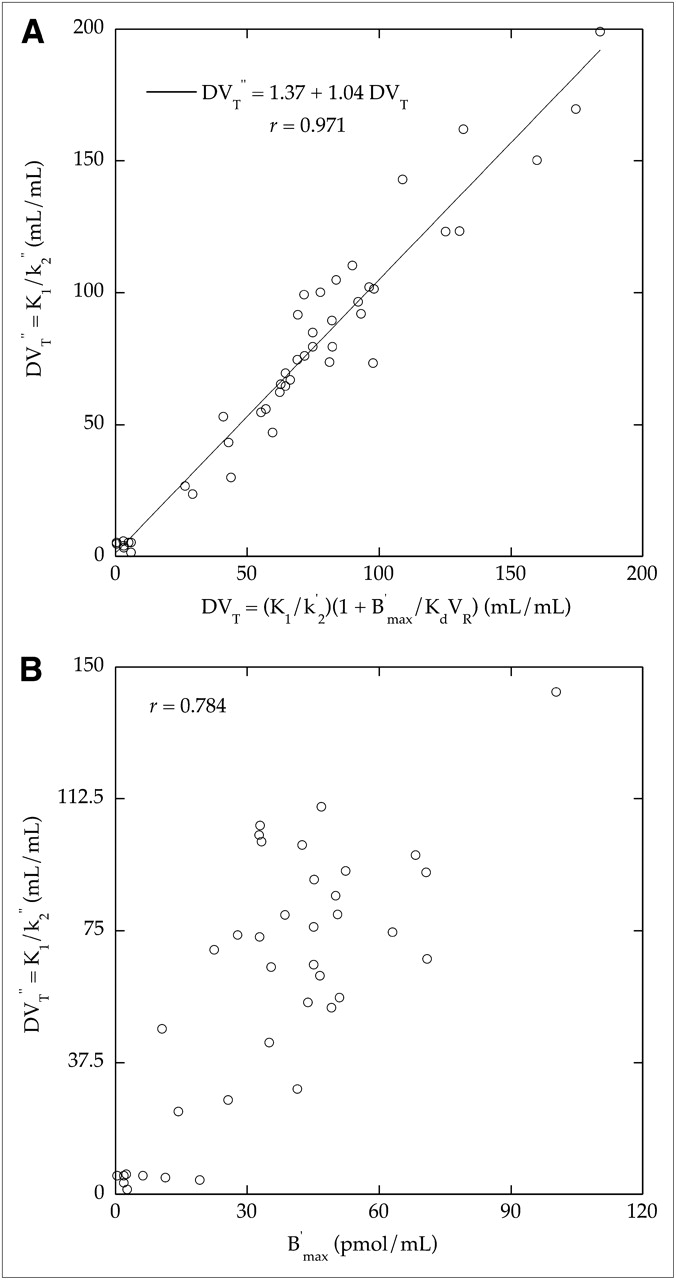
We next compared the distribution volume values (DVT″) calculated using 2-compartment model parameters and the first labeled injection with the DVT values calculated using IMZ parameters estimated from the dual-ligand approach and Equation 6. We obtained a quasilinear relationship with a correlation coefficient close to unity (Fig. 5A). We further compared the DVT″ values with the corresponding B′max values. In spite of some variability, there was an acceptable correlation between these 2 parameters (Fig. 5B).

(A) Comparison across regions and volunteers between distribution volume values estimated using 3-compartment model parameters (DVT) and 2-compartment model parameters (DVT″). Quasiidentity line was obtained between values. (B) Comparison between B′max values and their corresponding DVT″ values estimated with 2-compartment model.
Direct Comparison of SPECT and PET
Figure 6 shows a direct comparison between B′max values obtained in the same volunteer using PET and SPECT. Figure 6 shows a clear relationship between PET and SPECT B′max values.

Direct comparison between B′max values obtained in same volunteer with PET multiinjection approach and with SPECT dual-ligand approach. Dashed line corresponds to identity line.
DISCUSSION
A full in vivo quantification of brain receptors with PET or SPECT requires multiple injections of labeled or unlabeled ligand to change receptor occupancy. However, the administration of a large dose of unlabeled ligand can produce pharmacologic effects, precluding its use in humans. This problem requires the modification of experimental protocols and the adaptation of a kinetic model. This is the case for IMZ, a partial inverse agonist that binds to benzodiazepine sites producing pharmacologic effects when administered at high doses. By replacing unlabeled IMZ with FMZ, an antagonist with negligible pharmacologic effects, it was possible to use 123I-IMZ and SPECT to quantify the benzodiazepine receptors.
In this study, we developed a dual-ligand approach to separately estimate the density of benzodiazepine receptors and ligand affinity. We adjusted the model to take into account the different kinetics of the 2 ligands.
Model Simplifications
IMZ and FMZ have high specificities and affinities for the same type of receptor sites. Time–concentration curves of each ligand can therefore be described by a 2-tissue compartment model including free ligand and specific binding (7–11,14,15,25). The brain distribution of both ligands has been compared in vitro (17) and with many in vivo studies using patients and healthy volunteers (14,37). Similar brain distributions for both ligands have been described after injection of 11C-FMZ and 123I-IMZ. Therefore, we have assumed in this study that both ligands compete for the same type of receptor sites and, thus, had the same B′max.
The compartment model adapted for the dual-ligand approach involves 2 distinct parts to describe separately the kinetics of 123I-IMZ and FMZ. Each part of the model has its own parameters, but the total receptor site concentration available for binding, B′max, is common to both ligands. Thus, the resulting compartment model involves 9 unknown parameters. As previously shown in multiinjection PET studies (33,38), only 5 or 6 parameters can be estimated with acceptable SEs. Thus, to avoid identification problems during the fitting procedure, it was necessary to simplify the model and reduce the number of parameters. Consequently, we assumed a linear relationship between the kinetic parameters for 123I-IMZ and FMZ throughout the brain. In this way, we obtained 4 constants, A, B, C, and D, between IMZ and FMZ parameters that could explain this relationship. We first considered that the DVf+ns values were constant and independent of the receptor density. Inhibition studies in gray matter regions have estimated this value to be 0.68 for FMZ and 3.2 for IMZ (8,33,39). Second, we considered constant the koff parameter value because several authors have shown that its value is independent of the receptor density (39,40). Assuming that the BP parameter is a good index of receptor density, as shown in previous IMZ and FMZ studies (14,16), the  ratio can be considered constant.
These relationships are theoretic, and for each volunteer we adjusted all of the parameters using a coupled fitting procedure. This procedure reduces the number of estimated parameters to 5 and improves the stability of the final fit. The mean  ratio (0.206) that we obtained across subjects is in agreement with other values in the literature (
 = 0.68/3.2 = 0.2125) (7,8,33). In contrast, the dissociation constant calculated using the D/C ratio was between 10 and 20, which was smaller than that previously reported with in vitro studies (9,25,41). Because our study has been performed in vivo, it is difficult to compare these results.
Input Functions of Model
The quantitative approach based on a multiinjection protocol is one of the more complete methods for studying ligand–receptor interactions. However, this model assumes that each injection of labeled or unlabeled ligand, administered with a same volume, results in similar time–concentration plasma curves proportional to the mass injected (10). In this case, the unlabeled input function required to solve the model equations is calculated by simulation using the labeled input function. In our study, we estimated the relationship between 123I-IMZ and 11C-FMZ plasma input functions by comparing the time courses of both ligands in a group of volunteers. We found that the IMZ metabolites in plasma rose faster than the FMZ metabolites. After subtraction of the metabolite time course, the time courses for unchanged IMZ and FMZ plasma compounds were very similar, although the fraction of ligand bound to protein (f1) was higher for IMZ. Therefore, using known values for f1 and by applying the relationship between the 2 ligands, it was possible to calculate Cp(t) for FMZ.
SPECT Time–Concentration Curves and Estimated Values
One of the main interests of the kinetic approach is the possibility to estimate the time course of each compartment. The displacement of 123I-IMZ by injection of FMZ logically has an effect on the specific binding of 123I-IMZ, but the effect was weaker than for 11C-FMZ, where approximately 70% of the labeled molecules were displaced in the occipital cortex with only 0.01 mg/kg of unlabeled FMZ (10). There are several possible explanations for this effect, including differences in lipophilicity, affinity, and nonspecific binding between the 2 molecules (17,25,42).
The range of receptor density values obtained in our study fits well with previous reports (10,14,33). The magnitude of the kon/VR values for IMZ was close to that obtained for FMZ. As expected, we obtained lower koff values, and thus lower KdVR values, for IMZ than for FMZ (7,8,14,25).
The high K1-FMZ values calculated in some volunteers may be due to the use of an incorrect value for the f1 parameter. In the model equations, the f1 parameter is linked with the input function and, hence, with the K1 parameter. Therefore, an erroneously low f1 value would artificially increase the K1-FMZ parameter. However, a similar increase in k′2-FMZ was estimated by the model, leading to a compensated value for the distribution volume (DVf+ns-FMZ).
Furthermore, we compared the distribution volume values estimated using the dual-ligand approach (DVT) with those obtained using the data corresponding to the first tracer injection and a 2-compartment model (DVT″). We also directly compared the DVT″ and B′max values. Our results show an identity relationship between the DVT and DVT″ parameters and a good correlation between DVT″ and B′max. These correlations demonstrate that the model is effective at estimating the parameters despite high variability in the SPECT data.
We did not find significant differences when we switched the order of the displacement and coinjection. The goal of protocol 2, in which the displacement was performed after the coinjection, was to accumulate a higher signal at the time of displacement and produce a stronger displacement of labeled ligand. The lack of differences can be explained by the presence of a significant displacement effect already obtained with protocol 1. However, protocol 2 could be more appropriate for studies with low signal-to-noise ratios, which occur when the size of the ROIs for parametric imaging is reduced.
Direct Comparison of PET and SPECT
Finally, in 1 volunteer, we directly compared the B′max values obtained using the PET multiinjection approach with those obtained using the SPECT dual-ligand approach. Visually, there was a clear correlation between PET and SPECT B′max values. However, noise related to differences between PET and SPECT measurements should be considered. Specifically, the attenuation correction is directly measured in PET but is only corrected by a mathematic model (Chang method) in SPECT. In addition, the partial-volume effects are different for the PET and SPECT data.
CONCLUSION
This work demonstrates a theoretic framework and initial application in SPECT. We have shown that it is possible to quantify binding parameters with SPECT using an adaptation of the multiinjection approach. This new method, named the dual-ligand approach, enables the quantification of all model parameters with acceptable SEs. Moreover, we showed that unlabeled ligands devoid of pharmacologic effects can expand the number of quantification studies that can be performed using PET and SPECT.
Acknowledgments
This work was supported by grant 31-64020.00 from the Swiss National Science Foundation and, in part, by the Société Académique of Geneva.
References
- Received for publication October 12, 2005.
- Accepted for publication February 6, 2006.


Jump to section
Related Articles
Cited By...
- A 3D brain unit model to further improve prediction of local drug distribution within the brain
- Preoperative Central Benzodiazepine Receptor Binding Potential and Cerebral Blood Flow Images on SPECT Predict Development of New Cerebral Ischemic Events and Cerebral Hyperperfusion After Carotid Endarterectomy
- Central Benzodiazepine Receptor Binding Potential and CBF Images on SPECT Correlate with Oxygen Extraction Fraction Images on PET in the Cerebral Cortex with Unilateral Major Cerebral Artery Occlusive Disease
- Postoperative Cortical Neural Loss Associated With Cerebral Hyperperfusion and Cognitive Impairment After Carotid Endarterectomy: 123I-iomazenil SPECT Study