


Abstract
Our purpose was to evaluate the performance of 18F-FDG PET/CT, using data from both the PET and the unenhanced CT portions of the study, in characterizing adrenal masses in oncology patients. Methods: One hundred seventy-five adrenal masses in 150 patients referred for 18F-FDG PET/CT were assessed. Final diagnosis was based on histology (n = 6), imaging follow-up (n = 118) of 6–29 mo (mean, 14 mo), or morphologic imaging criteria (n = 51). Each adrenal mass was characterized by its size; its attenuation on CT, expressed by Hounsfield units (HU); and the intensity of 18F-FDG uptake, expressed as standardized uptake value (SUV). Receiver operating characteristic curves were drawn to determine the optimal cutoff values of HU and SUV that would best discriminate between benign and malignant masses. Results: When malignant lesions were compared with adenomas, PET data alone using an SUV cutoff of 3.1 yielded a sensitivity, specificity, positive predictive value, and negative predictive value of 98.5%, 92%, 89.3%, 98.9%, respectively. For combined PET/CT data, the sensitivity, specificity, positive predictive value, and negative predictive value were 100%, 98%, 97%, 100%, respectively. Specificity was significantly higher for PET/CT (P < 0.01). Fifty-one of the 175 masses were 1.5 cm or less in diameter. When a cutoff SUV of 3.1 was used for this group, 18F-FDG PET/CT correctly classified all lesions. Conclusion: 18F-FDG PET/CT improves the performance of 18F-FDG PET alone in discriminating benign from malignant adrenal lesions in oncology patients.
Incidental adrenal masses are identified in approximately 5% of abdominal CT scans (1) and in up to 8.7% of autopsies (2). In patients without a known malignancy, most of these masses represent adrenal adenomas. Even in patients with a known malignancy, most of the masses are benign (3). However, in patients with a known malignancy, especially lung cancer, the detection of an adrenal mass poses a diagnostic dilemma—is the mass a metastasis or a benign incidentaloma?
18F-FDG PET has previously been suggested as valuable in discriminating benign from malignant adrenal masses, with a false-negative rate of 0%–8% and a false-positive rate of 0%–20% in different reports (4–9). The largest study, published by Kumar et al., evaluated the performance of 18F-FDG PET in characterizing 113 adrenal masses in 94 patients with lung cancer. Comparing uptake in adrenal lesions to background liver activity, the authors found an overall sensitivity of 93% and specificity of 90% (9).
The issue of differentiation between benign and malignant adrenal lesions on CT and MRI has been the scope of many previous articles. The presence of intracytoplasmic lipid within adenomas has been found to accurately separate adenomas from malignant lesions. On unenhanced CT, a threshold of 10 Hounsfield units (HU) or less suggests the presence of intracytoplasmic lipid, and therefore an adenoma, with a sensitivity of 71% and specificity of 98% (10). Despite the high specificity of this parameter—enabling diagnosis of lipid-rich adenomas with a high degree of certainty—approximately 30% of adenomas are lipid poor, with higher attenuation values overlapping those of other adrenal masses, including malignancies.
Previous reports have suggested that in some clinical settings the combined data obtained by PET/CT may improve diagnostic accuracy over that of each of the modalities performed separately (11–13). The purpose of the current study was to evaluate the performance of 18F-FDG PET/CT, using the combined data from both the PET and the unenhanced CT portions of the study, in characterizing adrenal masses in oncology patients.
MATERIALS AND METHODS
Patient Population
A review of PET/CT reports over a 24-mo period yielded 182 patients who had been referred for 18F-FDG PET/CT and for whom adrenal masses had been detected on the CT portion of the studies. Thirty-two patients had been lost to follow-up and were excluded from the study. The remaining 150 patients with 175 adrenal masses composed our study population (61 females and 89 males; average age, 63.2 y; mean, 64 y; range, 1.5 mo to 88 y). 18F-FDG PET/CT was performed because of various malignancies or conditions as summarized in Table 1. Five patients had multiple primary tumors (colon and lung cancer [n = 3]; colon and breast cancer [n = 1]; lung cancer and melanoma [n = 1]). Eight of the patients did not have a known malignancy and were referred for evaluation of a solitary pulmonary nodule (n = 4), an adrenal mass on CT (n = 2), or lymphadenopathy (n = 2). Our institutional review board does not require its approval or informed consent by the patient for review of a patient's records, files, and images.
Indications for Performing 18F-FDG PET/CT
PET/CT Scanning and Data Acquisition
Patients were asked to fast for at least 4 h before undergoing the examination. All patients had glucose levels less than 150 mg/dL. The patients received an intravenous injection of 370–666 MBq (10–18 mCi) of 18F-FDG. Data were acquired 60–120 min after injection using an integrated in-line PET/CT system (Discovery LS; GE Healthcare). CT was performed first, from the head to the pelvic floor, with 140 kV, 80 mA, a tube rotation time of 0.5 s, a pitch of 6, and a 5-mm section thickness, which matched the PET section thickness. Immediately after CT, a PET emission scan was obtained that covered the identical transverse field of view. Acquisition time was 5 min per table position. PET image datasets were reconstructed iteratively using CT data for attenuation correction, and coregistered images were displayed on a workstation (Xeleris; GE Healthcare). One pediatric patient had different imaging parameters: the injected 18F-FDG dose was 74 MBq (2 mCi), and the CT parameters were 140 kV, 30 mA, a tube rotation time of 0.5 s, a pitch of 6, and a 5-mm section thickness.
All adrenal masses on the CT portion of the PET/CT study were evaluated. Size was measured on CT as the longest diameter on axial images. Density was measured on CT using a region of interest covering two thirds of the area of the mass to minimize partial-volume effects. A similarly sized region of interest was used to measure standardized uptake values (SUVs) on the PET portion of the PET/CT study. To determine the performance of PET/CT for small adrenal lesions, a separate analysis was performed for adrenal masses 1.5 cm or less in diameter. In addition, the presence of additional metastatic disease in lymph nodes or distant organs on the whole-body scan was recorded.
Standard of Reference
The final diagnosis of adrenal masses was based on histology (n = 6), imaging follow-up (n = 118) of 6–29 mo (mean, 14 mo), or morphologic imaging criteria (n = 51). The diagnostic algorithm used for final diagnosis and characterization of masses is illustrated in Figure 1. Any mass that measured less than 10 HU (but more than fat attenuation, i.e., more than −20 HU) on CT was considered a lipid-rich adenoma because of the high specificity of unenhanced CT for diagnosing this type of adenoma (10). For masses with attenuation of 10 HU or more, contrast washout of at least 60% on dynamic and delayed contrast-enhanced CT (14) or stability in size for at least 6 mo was considered indicative of a lipid-poor adenoma (a 6-mo follow-up period has previously been used as a standard of reference for adrenal adenomas (14–17)). Biopsy proof, progression of a mass on imaging in a patient with clinical evidence of disease progression and therapy failure, or shrinkage of a mass in response to therapy were considered indicative of malignancy. The final diagnoses of the 175 assessed adrenal masses are summarized in Table 2.
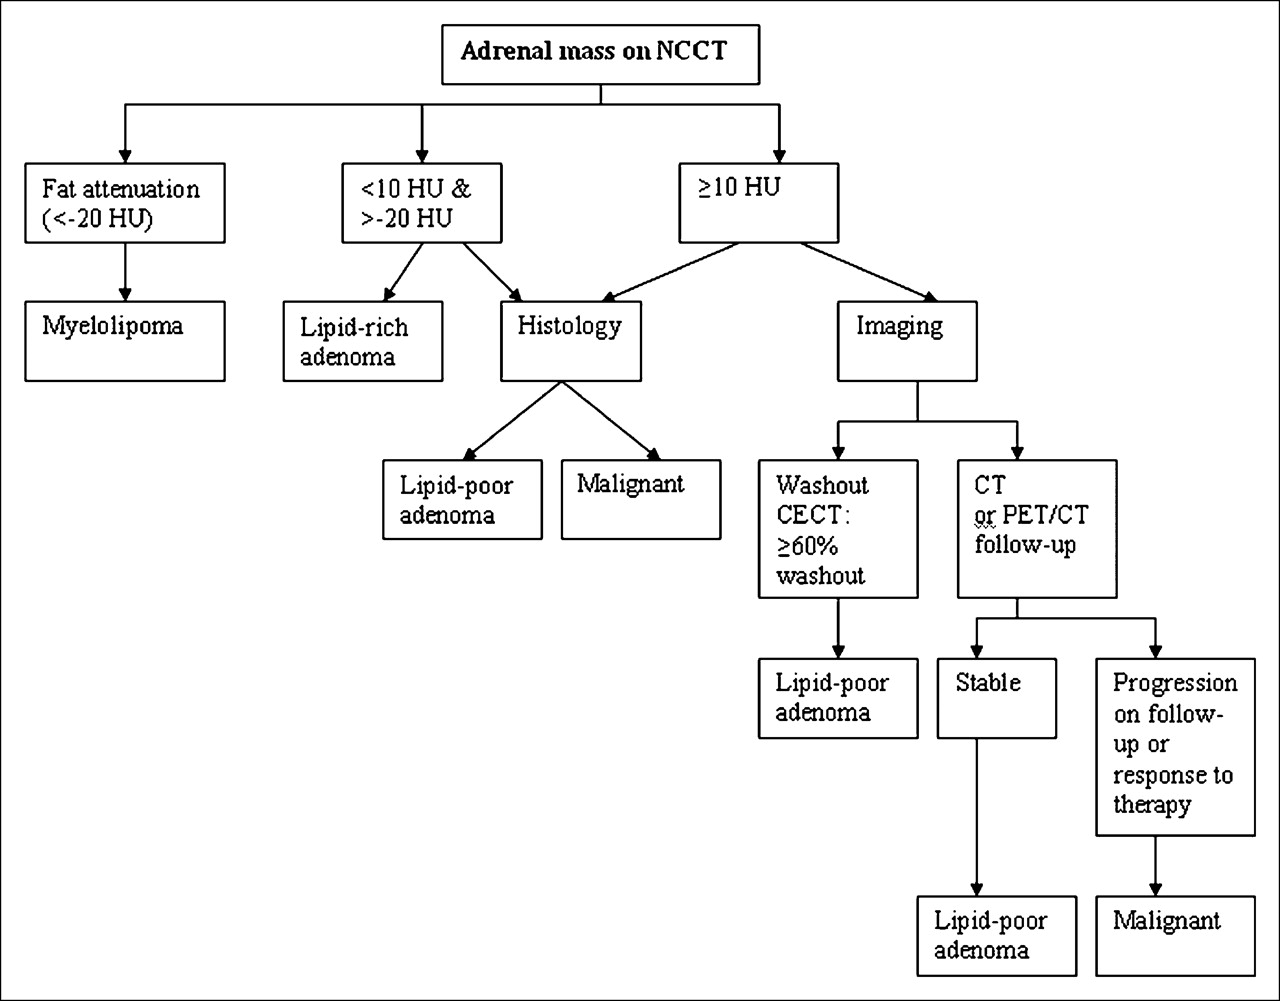
Diagnostic algorithm for characterizing adrenal masses. NCCT = unenhanced CT; CECT = contrast-enhanced CT.
Final Diagnosis for 175 Adrenal Masses Stratified by Primary or Secondary Adrenal Lesions
Statistical Analysis
Patient groups defined on the basis of final diagnosis were compared: malignant versus benign, lipid-rich adenoma versus lipid-poor adenoma, and adenoma versus other benign masses. Patient groups were compared with regard to demographic data, tumor size, density on CT (HU), and uptake of 18F-FDG (SUV) using independent t tests, Mann–Whitney nonparametric tests, and χ2 tests, as applicable. Multivariate logistic regression models were applied to the data to simultaneously study the independent relationship between each factor and the adrenal condition. These models predict the probability of having malignancy as a function of the explanatory variables. (Models refer to comparisons as specified above.)
Receiver operating characteristic (ROC) curves were drawn to determine the cutoff values of HU and SUV that would best discriminate between benign and malignant masses in each model. For each cutoff point, the predictive power of CT and PET/CT in detecting malignancy was demonstrated according to sensitivity, specificity, negative predictive value (NPV), and positive predictive value (PPV). The goodness of fit of each logistic model was assessed by the area under the curve. The statistical significance level was set at 0.05, and SPSS software (version 13.0; SPSS Inc.) for Windows (Microsoft) was used for the analysis.
RESULTS
Mass Size, Density (HU), and SUV
Size, HU, and SUV for the 175 assessed adrenal masses are presented in Table 3. There was a statistically significant difference in size, HU, and SUV between benign and malignant masses (P < 0.0001 for all 3 parameters). However, ROC analysis for size as a single criterion did not reveal a dependable cutoff value (0.65).
Size, Density (HU), and SUV for All Masses and for Benign and Malignant Masses Separately
PET/CT in Differentiating Malignant from Benign Adrenal Lesions
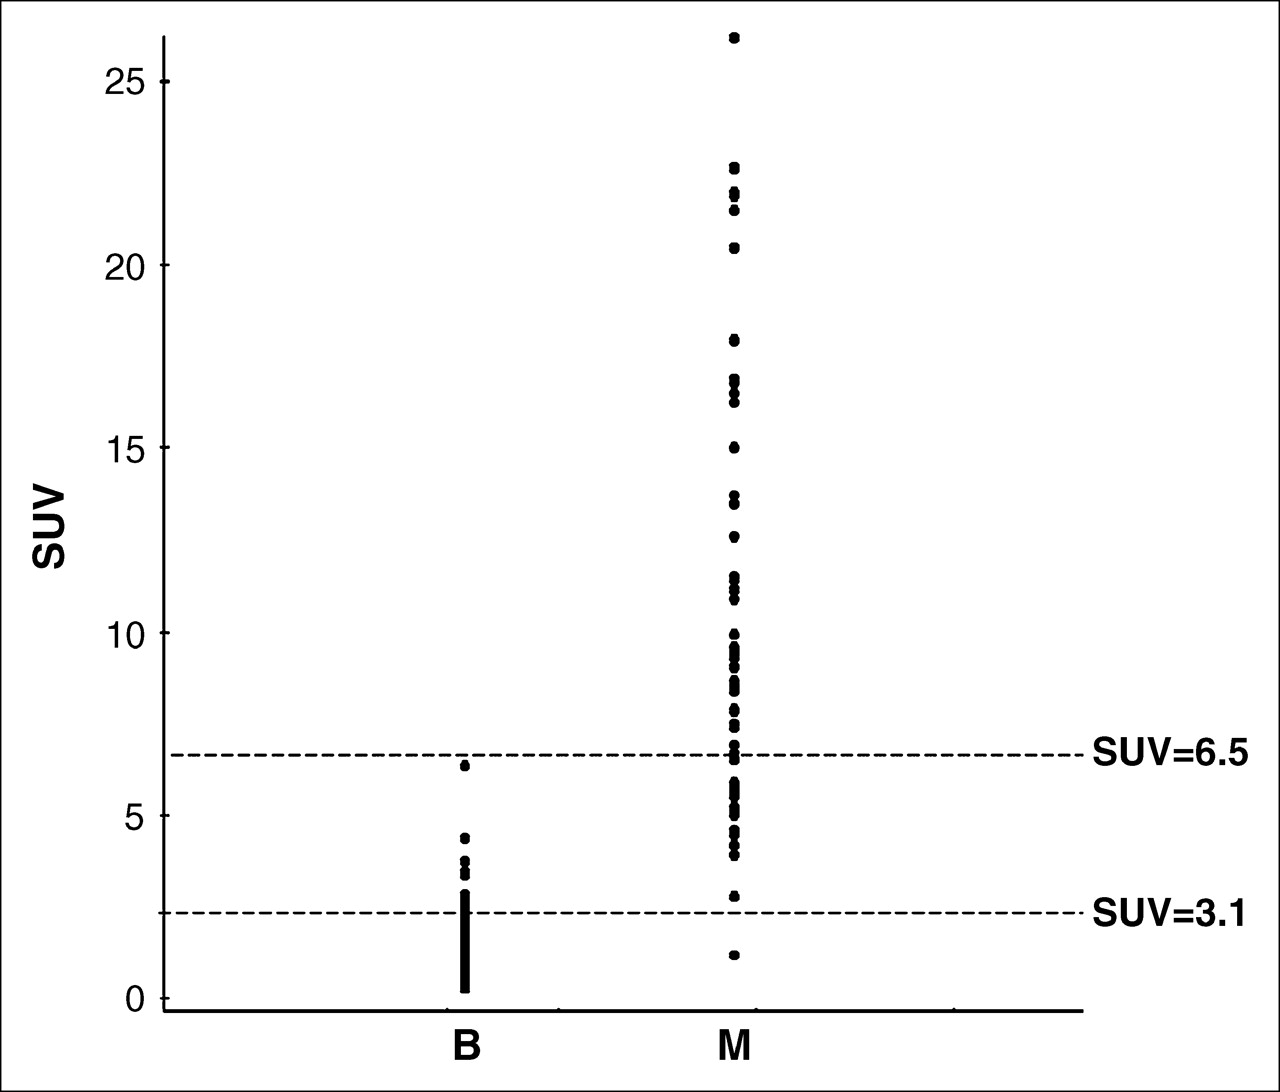
The SUVs of benign and malignant masses are displayed in Figure 2. No significant difference in size or SUV was noted for lipid-rich versus lipid-poor adenomas (P = 0.17 and P = 0.67, respectively). On the basis of the ROC curve analysis, a cutoff SUV of 3.1 was found to best separate malignant lesions from adenomas (lipid rich and lipid poor) on PET, with a sensitivity, specificity, PPV, and NPV of 98.5%, 92%, 89.3%, and 98.9%, respectively.

Scatter plot of SUVs (y-axis) of all adenomas (B) and all malignant lesions (M).
For adrenal lesions of 10 HU or more (lipid-poor adenomas), a subgroup that by definition poses a diagnostic dilemma when unenhanced CT is interpreted separately, an SUV cutoff of 3.1 yielded sensitivity, specificity, PPV, and NPV of 98.5%, 93%, 97.1%, and 96.3%, respectively. Sensitivity, specificity, PPV, and NPV were 100%, 98%, 97%, and 100%, respectively, when the 2 following PET/CT criteria were used as suggestive of adenoma: SUV of 3.1 or less for any HU; SUV greater than 3.1 for masses less than 10 HU. The difference in specificity between PET and PET/CT was statistically significant (P < 0.01; 95% CI, −0.1 to 0.03). Of the 8 adenomas with SUVs higher than 3.1, only 2 were lipid poor (Fig. 3). Figure 4 presents the results of logistic regression of HU and SUV displayed for combined HU and SUV.
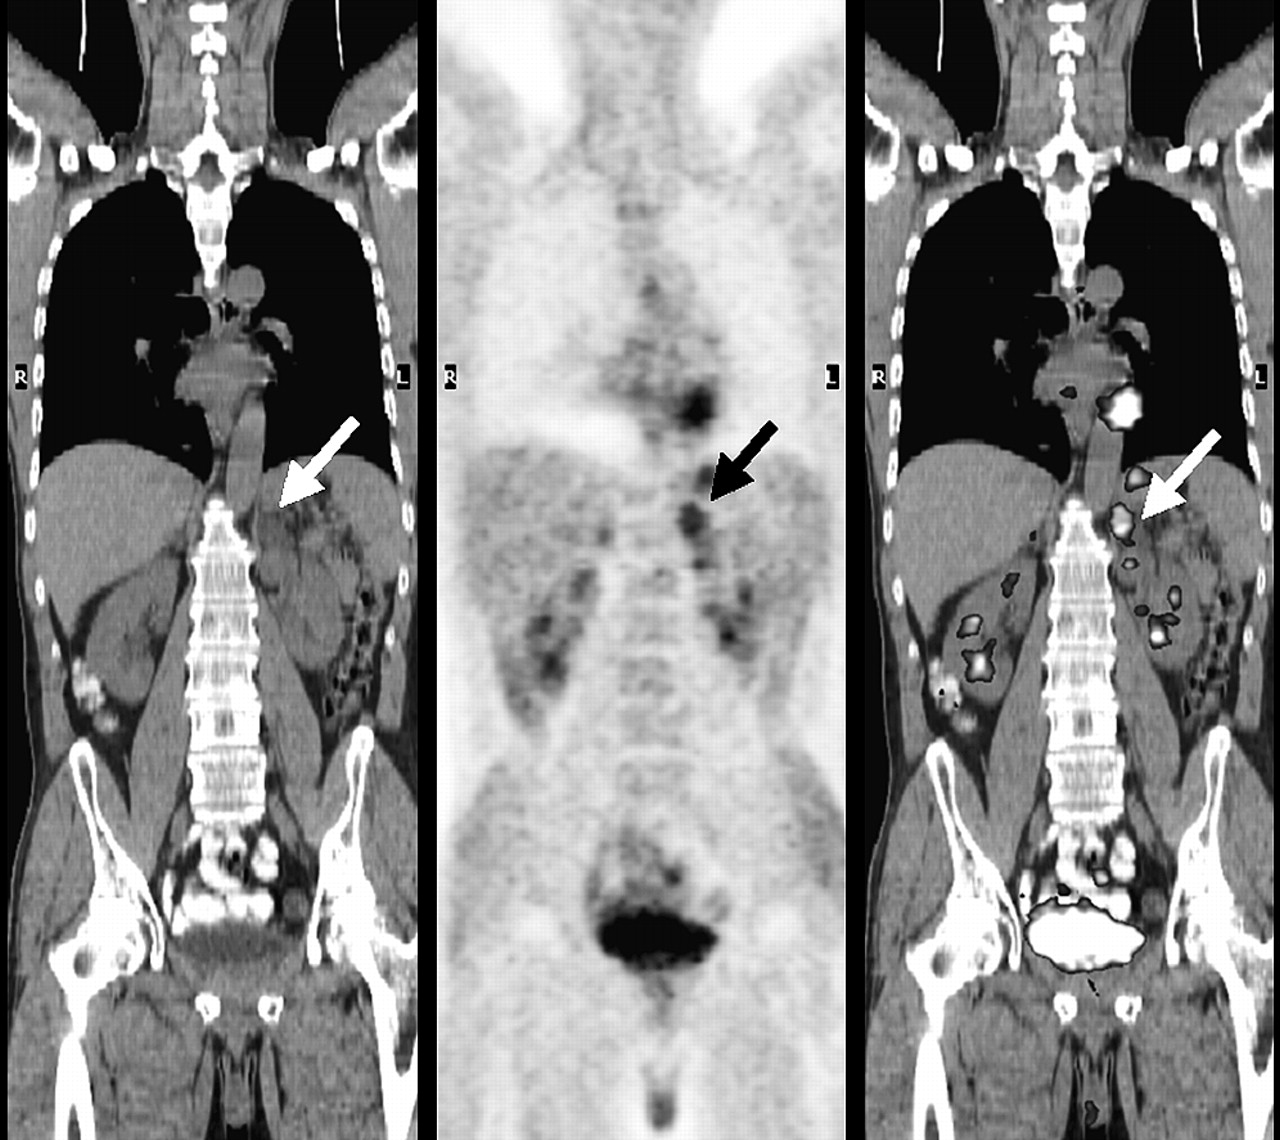
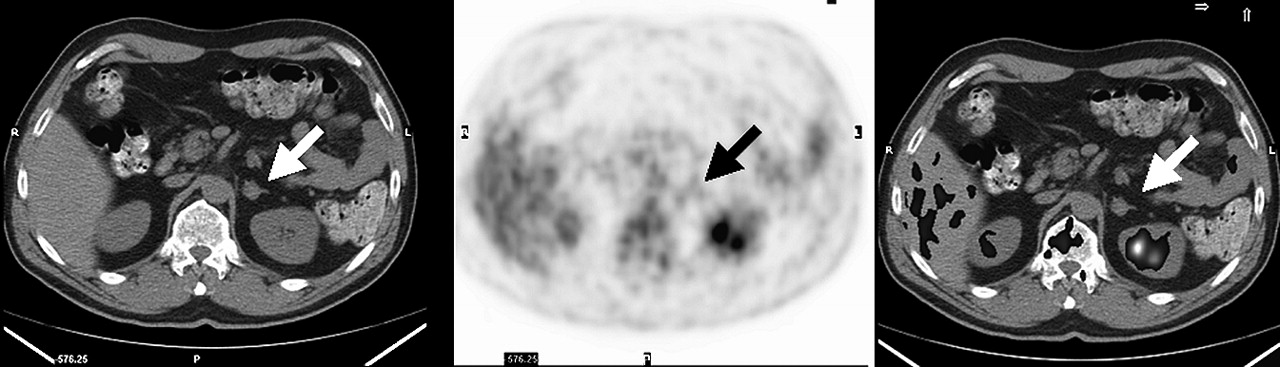
False-positive 18F-FDG PET findings in 59-y-old woman with metastatic colorectal cancer. Coronal 18F-FDG PET/CT images (CT image on left, attenuation-corrected PET image in middle, and fusion image on right) show increased uptake of 18F-FDG (SUV, 4.4) in 2-cm lipid-poor left adrenal adenoma (arrows).
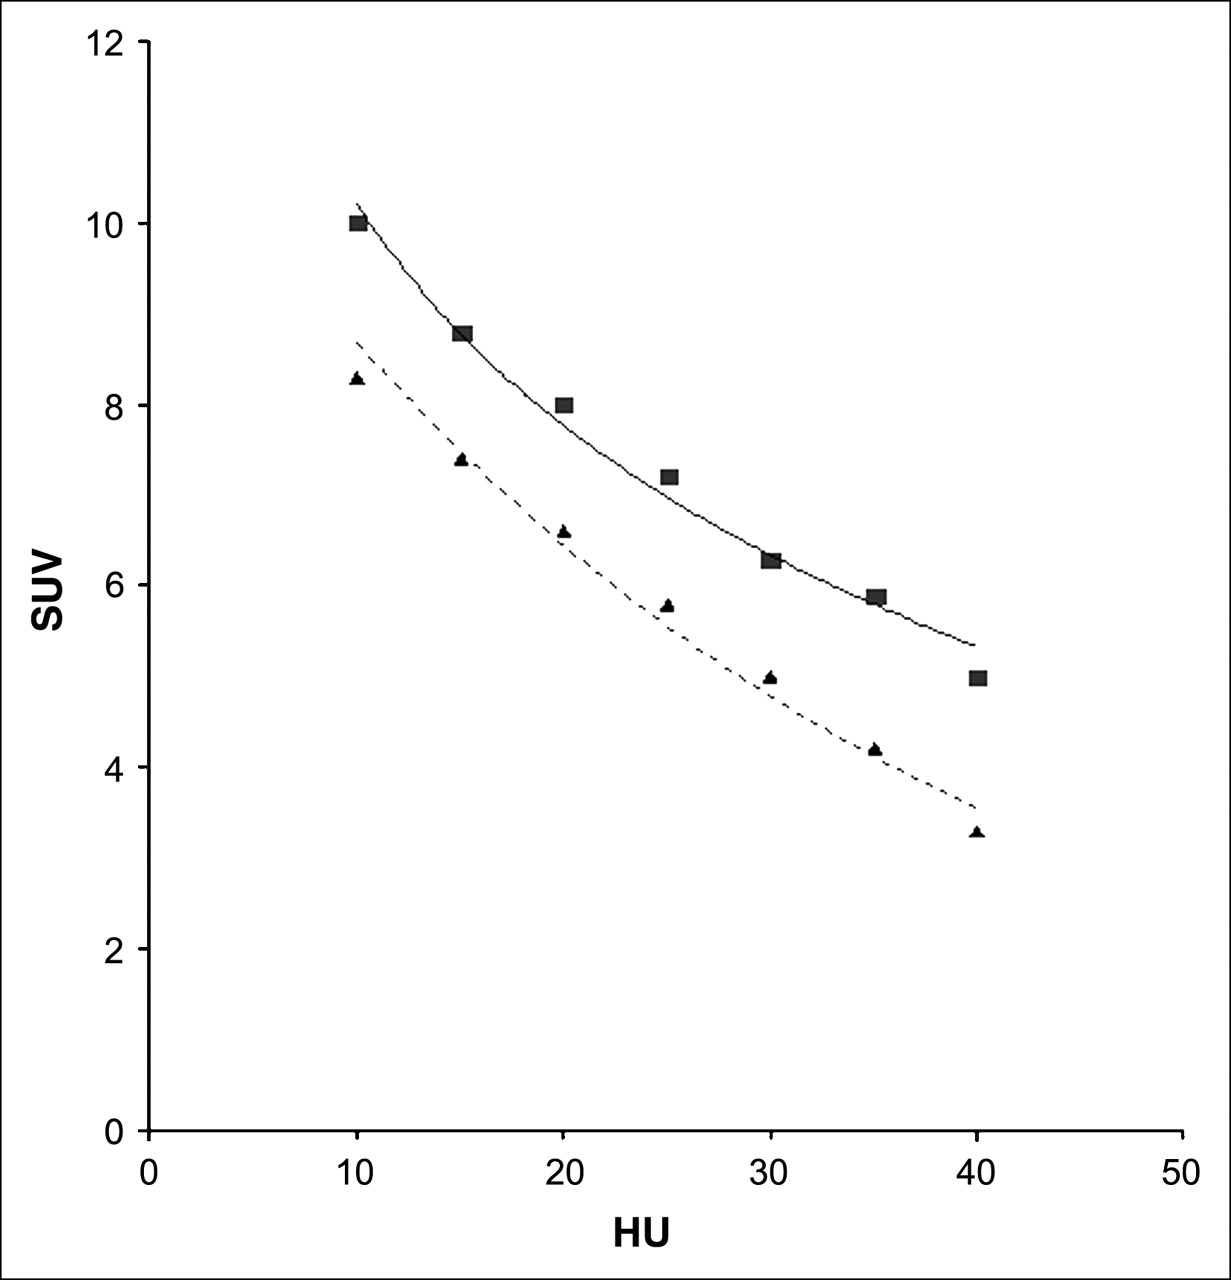
ROC analysis for different cutoff values of HU and SUV in differentiating benign from malignant adrenal masses: 99% (▪) and 92% (▴) probabilities for malignancy.
In addition to the 2 false-positive adenomas on PET/CT, 1 malignant lesion was false negative on 18F-FDG PET and was misclassified. The mass, in a 2-mo-old infant, was highly attenuating (32 HU) on CT but showed low 18F-FDG uptake (SUV, 1.1). Despite negative urinary catecholamines, this mass was suspected to be a neuroblastoma on the basis of its appearance on sonography. Pathologic examination at surgery showed the mass to be a neuroblastoma with a low mitotic rate, perhaps explaining its low uptake of 18F-FDG.
Seven benign adrenal masses that were not adenomas (6 myelolipomas and 1 adrenal cyst) were included in the study. These masses tended to be larger than the adenomas (mean size of 1.94 cm for all adenomas and 3.26 cm for other benign masses, P < 0.001) and took up less 18F-FDG than did the adenomas (mean SUV of 1.81 for all adenomas and 0.54 for other benign masses, P < 0.0001).
PET/CT of Small Adrenal Lesions
Fifty-one of the 175 lesions were small adrenal lesions, that is, 1.5 cm or less in diameter. Of these, 36 were adenomas (23 lipid rich and 13 lipid poor), with a mean SUV of 1.4 (range, 0.7–1.5) and mean attenuation of 5.5 HU (range, −5 to 38 HU) (Fig. 5). Fifteen were malignant lesions (lymphoma [n = 3] and metastases from lung cancer [n = 7], melanoma [n = 3], breast cancer [n = 1], or colon cancer [n = 1]), with a mean SUV of 5.9 (range, 3.3–16.8) and mean attenuation of 35 (range, 24–46 HU) (Fig. 6). When a cutoff SUV of 3.1 was used for this group as well, 18F-FDG PET correctly classified all lesions.

53-y-old man with melanoma. Axial PET/CT images (CT image on left, attenuation-corrected PET image in middle, and fusion image on right) show no abnormal uptake of 18F-FDG (SUV, 1.2) in 1.4-cm soft-tissue–attenuating left adrenal mass (38 HU), stable on imaging for 8 mo, suggestive of lipid-poor adenoma (arrows).
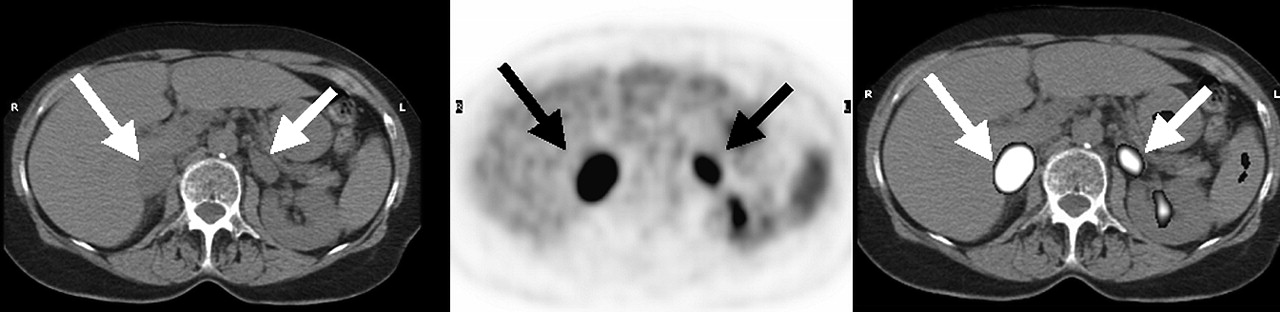
75-y-old woman with metastatic lung cancer. Axial PET/CT image (CT image on left, attenuation-corrected PET image in middle, and fusion image on right) shows abnormal uptake of 18F-FDG (SUV, 7.8–16.9) in soft-tissue–attenuating masses (28−36 HU) in both adrenal glands, consistent with metastatic deposits (arrows).
Clinical Relevance of Adrenal Masses
In 53 (40.2%) of the 132 patients referred for PET/CT because of entities other than lymphoma, the adrenal mass was the only potential site of metastatic disease on CT. Of these adrenal masses, 24.5% (13/53) turned out to be metastases on final analysis. All metastases were correctly identified as malignant by the PET/CT criteria of malignancy. Of the 40 remaining lesions, PET/CT ruled out malignancy in all but 1 false-positive case. Twenty-three patients were referred for PET/CT because of lymphoma. Five had other sites of extranodal lymphoma. The remaining 18 had adrenal masses as the only potential site of extranodal involvement. Only 5.6% (1/18) of these patients had adrenal gland involvement by lymphoma correctly identified on PET/CT. All remaining lesions (except for 1 false-positive case) were true negative on PET/CT.
DISCUSSION
Diagnosis of malignant adrenal involvement in oncology patients is necessary to choose the appropriate treatment approach and to assess prognosis (18,19). In 40% of our study population with adrenal masses and malignant disease other than lymphoma, the adrenal mass was the only potential site of metastatic disease detected on the CT portion of the study. In approximately three quarters of these patients and in most patients with lymphoma, the adrenal mass turned out to be benign (most commonly, adrenal adenoma).
The presence of intracytoplasmic lipid within adenomas has been exploited to identify them on unenhanced CT. An attenuation value of 10 HU or less has been shown to reliably differentiate adenomas from malignant adrenal masses. However, the sensitivity of this criterion is approximately only 71% (4), because almost 30% of adenomas do not have sufficient lipid within them to enable separation from malignancy on the basis of attenuation values alone. In the current study, 28% of all adenomas were lipid poor (CT attenuation values of >10 HU)—a prevalence similar to one previously published (6).
Several former studies have shown that 18F-FDG PET can be used to differentiate benign from malignant adrenal masses in cancer patients, with a sensitivity and specificity ranging from 92% to 100% and from 80% to 100%, respectively (5–9). Most of these studies used visual inspection and considered adrenal 18F-FDG uptake higher than liver uptake to be suggestive of malignancy. False-negative 18F-FDG PET findings have been reported in small malignant lesions, in metastases from non–18F-FDG-avid tumors such as tumors of neuroendocrine origin, or in the presence of central necrosis (5,7,9). Increased 18F-FDG uptake may be seen in pheochromocytomas and in some adenomas. It is not fully understood why some adenomas show increased 18F-FDG uptake and some do not. A previous article has suggested that the functional state of an adenoma is a factor determining the intensity of uptake, with 18F-FDG uptake being increased in functioning adrenal masses (20).
In our study population, 18F-FDG uptake did not differ between lipid-rich and lipid-poor adenomas. Furthermore, an SUV cutoff of 3.1 resulted in a sensitivity of 98.5% and specificity of 92% for differentiating all adenomas from malignant lesions, with similar results (sensitivity of 98.5% and specificity of 93%) for lipid-poor adenomas only. Use of 18F-FDG PET alone, with a threshold SUV of 3.1, led to misclassification of 9 of the 175 adrenal masses. However, when the CT data were used as well (with attenuation values of <10 HU for diagnosing an adenoma), only 3 masses (1.7%) were misclassified, for an overall sensitivity and specificity of 100% and 98%, respectively. The other 6 masses were shown to be adenomas by unenhanced CT. 18F-FDG–avid adrenal adenomas are a small fraction of all adenomas (8% in our series); however, because approximately 70% of adrenal adenomas are lipid rich, most 18F-FDG–avid adenomas can correctly be classified as such on unenhanced CT, obviating additional imaging studies or biopsy. If staging or patient management might be altered, further imaging (calculation of relative percentage washout of contrast material on dynamic and delayed enhanced CT scans or chemical-shift MRI) or biopsy should be considered to confirm the nature of moderately 18F-FDG–avid soft-tissue–attenuating adrenal masses (≥10 HU).
In contrast to previously published data by Kumar et al. (9), all small adrenal lesions identified on CT were correctly classified as benign or malignant on 18F-FDG PET alone using an SUV cutoff of 3.1. This result may be attributed to the precise fusion capabilities of PET/CT and the ability to identify adrenal lesions not clearly detected or inaccurately localized on PET alone (Fig. 7).

66-y-old man with disseminated metastatic disease due to lung cancer. Axial PET/CT image shows abnormal uptake of 18F-FDG (SUV, 16.8) in 0.6-cm soft-tissue–attenuating (36 HU) mass in medial portion of left adrenal gland, consistent with metastatic deposit (arrows). Large metastatic deposit is seen in left kidney.
CONCLUSION
For differentiating benign from malignant adrenal masses in oncology patients, combined information from the 18F-FDG PET and unenhanced CT portions of a PET/CT study is more specific than 18F-FDG PET information alone (P < 0.01).
References
- Received for publication August 19, 2005.
- Accepted for publication September 23, 2005.


Jump to section
Related Articles
Cited By...
- Lung cancer staging: a concise update
- Diffuse large B-cell lymphoma of the adrenal gland: a rare cause of primary adrenal insufficiency
- Utilisation of combined 18F-FDG PET/CT scan for differential diagnosis between benign and malignant adrenal enlargement
- AME Position Statement on adrenal incidentaloma
- Assessment of Patient Exposure to X-Radiation from SPECT/CT Scanners
- Adrenal Masses in the Cancer Patient: Surveillance or Excision