


Abstract
Molecular imaging by small-animal PET is an important noninvasive means to phenotype transgenic mouse models in vivo. When investigating pathologies of the left ventricular (LV) myocardium, the serial assessment of LV volumes is important. By this, the presence of LV dilation as a sign of developing heart failure can be detected. Whereas PET is usually used to derive biochemical and molecular information, functional parameters such as ventricular volumes are generally measured using echocardiography or MRI. In this study, a novel method to monitor LV dilation in mice with PET is presented and evaluated using cardiac MRI. Methods: A semiautomatic 3-dimensional algorithm was used to delineate the LV myocardial wall on static PET images depicting myocardial glucose metabolism (18F-FDG PET) for 20 mice: 10 wild-type and 10 genetically modified littermates designed to develop a dilative cardiomyopathy phenotype (cardiomyocyte-specific knockout of survivin). The volume enclosed by the 3-dimensional midmyocardial contour was calculated as a measure for LV volume for each mouse. Data were compared with ventricular volumes measured by MRI in the same animals. Results: LV volumes obtained by PET and MRI correlated well (R = 0.89) for hearts with small and large left ventricles. In accordance with the hypothesis, the LV volumes were increased significantly for transgenic mice examined at an older age compared with those examined at a younger age (MRI: 160.5 ± 25.7 μL vs. 114.7 ± 15.2 μL [P = 0.012]; PET: 129.3 ± 15.3 μL vs. 73.8 ± 15.0 μL [P < 0.001], all values shown as mean ± SD; for MRI, mean of end-diastolic and end-systolic volumes are given), whereas they did not for their wild-type littermates (MRI: 106.2 ± 12.3 μL vs. 94.7 ± 14.6 μL [P = 0.214]; PET: 82.6 ± 20.9 μL vs. 65.0 ± 16.9 μL [P = 0.185]). Conclusion: Evaluation and quantitation of LV dilation in both control and cardiomyopathic mice can be reliably and serially performed using small-animal PET and 18F-FDG, yielding useful functional information in addition to metabolic data.
PET has been extensively used in humans to characterize the heart with respect to properties such as perfusion (1–3), metabolism (4–6), innervation (7,8), and cardiac function (9,10) in vivo.
High-resolution small-animal PET promises to extend PET methodology to small animals such as rats and mice. These animals are being increasingly used to study genetic defects and their phenotypic expression. Measurement of myocardial gene expression and measurement of their phenotypic expression in cardiac parameters such as perfusion and metabolism have been recently reported for rats and mice (11,12).
The evaluation of geometric and functional parameters such as ventricular volumes and ejection fraction with PET has been published for rats (13), but corresponding data for mice are largely absent. Their much smaller heart size makes noninvasive imaging by PET more challenging. It requires equipment capable of obtaining excellent resolution. The 32-module quadHIDAC PET scanner (Oxford Positron Systems) satisfies this condition with an achievable resolution of <1 mm using a resolution recovery reconstruction technique (14–16).
The measurement of parameters of cardiac function such as left ventricular (LV) dilation in addition to biochemical properties of the myocardium within the same PET scan is desirable because it obviates the need for a second imaging modality such as echocardiography or cardiac MRI. This approach reduces study complexity and, therefore, facilitates time- and cost-effective serial measurements.
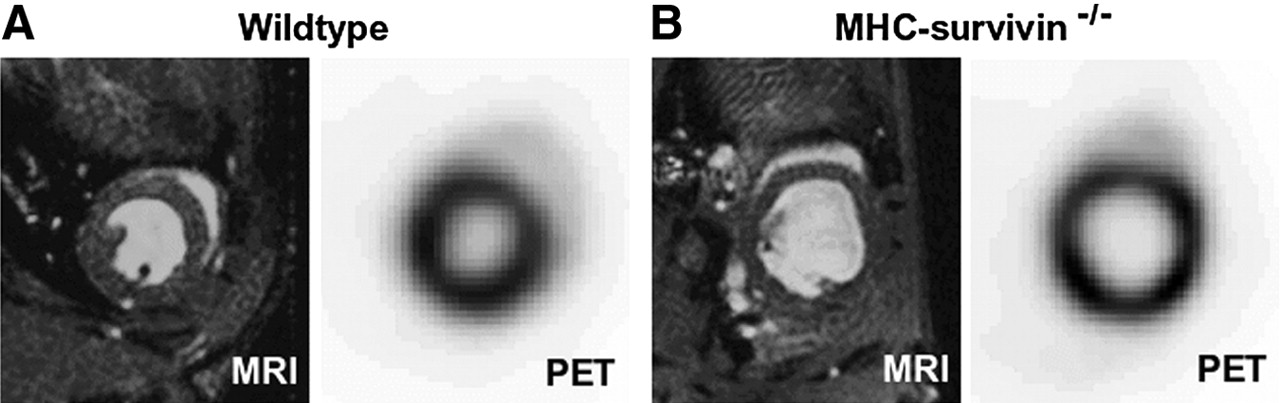
In this work, the feasibility and accuracy of the assessment of LV dilation using a semiautomatic contour-detection algorithm working on nongated 18F-FDG PET images were investigated. The contour-detection algorithm has previously been successfully applied to PET and SPECT in humans (17,18) and was adapted to small-animal PET. The assessment was based on the comparison with MRI in 20 mice (10 wild-type, 10 transgenic), which underwent both PET and MRI. In Figure 1, a short-axis slice through the left ventricle of a wild-type mouse (Fig. 1A) and a transgenic mouse (Fig. 1B), as obtained by PET and MRI, respectively, is shown as an illustration of the 2 imaging modalities.

PET and MR images depict a short-axis slice through the heart of a wild-type mouse (A) with normal heart size and a transgenic mouse (B) with dilated left ventricle. MR images shown were acquired in end-diastole.
MATERIALS AND METHODS
Animals
Twenty mice were scanned with both PET and MRI within 1 wk. To validate the PET methodology in normal and diseased hearts, both wild-type mice and their genetically modified littermates designed to develop a dilative cardiomyopathy phenotype (cardiomyocyte-specific knockout of survivin (19); n = 10 each) were investigated in groups of 5 at an early age (18 wk) and a late age (36 wk). Wild-type and transgenic mice were matched for sex and weight (Table 1). Survivin is a member of the family of apoptosis-inhibiting proteins, the most potent endogenous inhibitors of caspases known so far. Deficiency of survivin in vitro enhances apoptosis and promotes caspase activation in several experimental systems. For this study, mice were used with a cardiac-specific knockout of the survivin gene (20). These mice were generated by crossing homozygous survivin flox/flox mice with mice expressing Cre recombinase under cardiac-specific α-myosin heavy chain (courtesy of Michael D. Schneider, Baylor College of Medicine, Houston, TX). On inspection, knockout mice were indistinguishable from their non–knockout littermates.
Weight and Sex of Wild-Type and Transgenic Mice (Matched Pairs)
Data Acquisition
PET.
PET was performed using a near-millimeter-resolution dedicated small-animal PET system (32-module quadHIDAC; Oxford Positron Ltd.), which utilizes wire chamber detectors and offers an almost uniform spatial resolution (14,16,21). The quadHIDAC scanner consists of 4 stacks of 8 detector modules each, positioned perpendicularly to each other and enclosing a cuboid field of view. Additionally, this setup rotates around the axial direction to improve homogeneity; a 180° rotation takes 6 s before the direction of rotation is reversed for the next 6 s.
For data acquisition, the mouse was placed on a heating pad to maintain a body temperature within the normal range. Cardiac excitation and respiration were monitored throughout the scan to exclude anomalies. All vital parameters were measured with a dedicated system (BioVet; Spin Systems Pty Ltd.). The temperature was measured rectally, electrocardiogram (ECG) electrodes were placed on both forepaws and the left hindpaw, and respiration was measured with a small pressure detector attached to the mouse. The animals were anesthetized by inhalation of isoflurane (1.5%) and intravenously injected with approximately 10 MBq 18F-FDG in 100 μL of saline solution.
One hour after injection data acquisition was started. List-mode data were acquired for 15 min and subsequently reconstructed into an image volume of 110 × 60 × 20 mm3, voxel size of 0.4 × 0.4 × 0.4 mm3, using a resolution recovery reconstruction algorithm (15). A resolution of 0.7 mm is achieved (full width at half maximum).
MRI.
MRI was performed using a Bruker DRX 9.4-T wide-bore NMR spectrometer equipped with an actively shielded 40-mm gradient set (capable of 1 T/m maximum gradient strength and 110-μs rise time at 100% gradient switching) and a 30-mm birdcage resonator (1H). Mice were anesthetized by inhalation of isoflurane (1.5%). High-resolution images of mouse hearts were acquired using an ECG-triggered fast gradient echo cine sequence with a flip angle of <45°. To obtain a maximum of images over the entire cardiac cycle (∼100 ms at a heart frequency of 600 beats/min), the shortest possible echo time (1.8 ms) was applied. Using a repetition rate of 3.8 ms allowed for the acquisition of 26 frames during one R–R interval, which leads to a sufficient temporal resolution to accurately determine diastole and systole within the cardiac cycle. The resulting pixel size was 117 × 117 μm2 (field of view, 30 × 30 mm2; 256 × 256 matrix). The total acquisition time per slice for one cine sequence was ∼2 min (22). After acquisition of scout scans, one short-axis slice at the height of the papillary muscle was acquired in cine mode as the basis for volume analysis.
Data Processing
PET.
Data were transferred to a personal computer with a 900-MHz AMD Athlon central processing unit (Advanced Micro Devices Inc.) running the Linux operating system for further analysis. Processing of PET images to obtain a measure for LV volumes was performed using in-house software programmed in MATLAB (The Mathworks) and C programming languages. The interactive preprocessing steps as well as the automatic contour-detection algorithm are described elsewhere (17,18).
In brief, the left ventricle is interactively aligned along its long axis and the valve plane is specified perpendicularly. Image data are automatically transformed from the original cartesian matrix to heart coordinates, a combination of spheric polar coordinates toward the apical portion and circular cylindric coordinates in the midventricular and basal portions of the left ventricle. The midmyocardial contour is mathematically represented in 3 dimensions as an elastic membrane. Internal forces inherent in the membrane model ensure a continuous contour and allow bridging the gaps in the tracer distribution—for example, in the presence of a myocardial scar. The distribution of tracer activity within the PET image data is the source of an attractive field of force acting on the membrane. Because the tracer accumulation is high in the myocardium, the midmyocardial contour is locally attracted toward the accumulated tracer in the myocardium. The shape of the midmyocardial contour umid is modeled as the solution to a second-order partial differential equation, where (x, y) denotes the myocardial position in heart coordinates, umid denotes the radial displacement of the midmyocardial contour, and F denotes the external force exerted on the contour:


fact is the activity distribution and g is a nonlinear weighting function dependent on the distance between contour umid and radial position z, where z is relative to the origin of the spheric polar coordinate system in the apical portion and to the long axis in the midventricular and basal portions of the left ventricle. a and b are scaling parameters:

The problem is discretized using 24 azimuth steps of equal angle, 16 polar/axial steps, and 96 radial steps and solved numerically using a successive overrelaxation (SOR) algorithm.
The volume enclosed by the calculated midmyocardial contour (Fig. 2) is taken as a measure for LV size and denoted as LV volume index (LV-VIPET). Because PET data were acquired in static mode and LV contraction was consequently ignored, the obtained values are only indicative of LV size and are not to be mistaken for the LV volume.

Midmyocardial (solid line) and endo- or epicardial (dashed lines) contours superimposed on 18F-FDG PET short-axis image (A) and vertical long-axis image (B) of mouse heart as measured by PET. Only the midmyocardial contour is used in this study.
MRI.
Cavity and myocardial areas were determined according to the method of Teichholz et al. (23). From these MRI data, the following functional parameters were derived: end-diastolic volume (VolED, μL), end-systolic volume (VolES, μL), and myocardial volume (VolMyo, μL).
Because PET data were acquired in static mode, LV-VIPET is comparable to neither the end-diastolic nor the end-systolic LV volumes measured by MRI. Therefore, a new parameter LV-VIMRI is calculated in the following way:
 where VolED and VolES are the intraluminal volumes of the left ventricle during end-diastole and end-systole, respectively; VolMyo is the volume of the myocardium; and xED/xES are the fractional contributions of end-diastolic and end-systolic LV volumes (xED + xES = 1).
Comparison of PET and MRI.
The agreement of PET and MRI measurements was analyzed by calculating correlation and linear regression as well as by using a graphical analysis method according to Bland and Altman (24). The fractional contributions xED and xES were varied to determine whether the choice for xED and xES significantly influences the result.
Additionally, as an example of application, the development of LV size with age in both wild-type and transgenic mice was analyzed with PET and MRI. Differences in behavior between the 2 groups of animals (wild-type vs. transgenic) were demonstrated. All calculations were performed twice, xED set to 0.5 and 0.8 (xES set to 0.5 and 0.2), again to exclude a relevant dependency on the particular choice of xED/xES.
Statistical analysis was performed using standard statistical software (JMP 5.1; SAS Institute Inc.). The groups of animals are described by their mean and SDs. Comparisons between groups were performed by the 2-sided Student t test (level of significance, 0.95).
RESULTS
Duration of Analysis
The method to calculate LV volumes within midmyocardial contours with PET, as presented here, is very time-efficient, requiring only little additional time for analysis. The manual steps are limited to reangulation with respect to the LV long axis and the manual indication of the valve plane position perpendicularly to the LV long axis. An experienced operator does not need >60 s for this task, especially when doing serial measurements. The calculations after these manual steps are performed within a few seconds on a reasonably recent personal computer.
Correlation
Measures for LV dilation (LV-VIPET/MRI) obtained by PET and MRI correlated well. Variation of the fractional contributions xED and xES in the calculation of LV-VIMRI had only little influence on the result (Table 2) with R = 0.89 for a wide range of values for xED and xES. The intersect of the correlation line naturally differed; the slope remained nearly constant. For display in the figures, xED and xES were set to 0.5. A scatter plot of this correlation is shown in Figure 3A. The linear regression (Table 2) shows that the PET measure for LV dilation (LV-VIPET) underestimates the corresponding measure for MRI (LV-VIMRI) for all sensible estimates of xED/xES. Graphical analysis according to Bland and Altman (24) does not reveal a dependency on volume (Fig. 3B). The data support the assumption of a linear relationship between values obtained by PET and MRI.
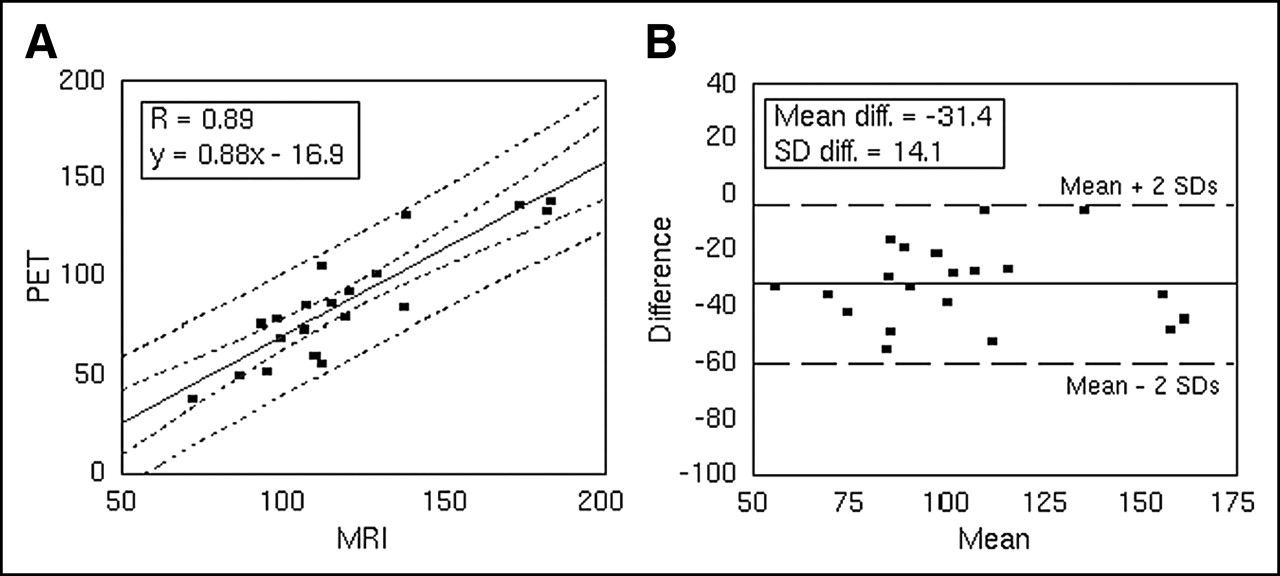
Comparison of LV volume indices LV-VIPET/MRI (in μL) measured by PET and MRI. Equal fractional contributions of end-diastolic or end-systolic volumes were used for LV-VIMRI (xED = xES = 0.5). (A) Scatter plot of LV volume indices measured by PET vs. MRI. Confidence curves for regression fit as well as confidence curves of individual values are also shown (dashed lines, α = 0.05). (B) Difference of PET and MRI measurements plotted against the mean of both measurements. Horizontal lines for mean (solid) and mean ± 2 SD (dashed) are included. Values for linear fit (intercept, 30.0; slope, 0.011) are not shown.
Choice of Fractional Contributions of End-Diastolic and End-Systolic Volumes in Calculation of LV-VIMRI and its Influence on Correlation Between PET- and MRI-Derived LV-VI
Example of Application: Comparison of Mouse Strains
The results of determination of the LV-VI for all 4 groups of mice (young vs. old, wild-type vs. transgenic) are given in Table 3 together with the results of the Student t test for all pairs.
Matrix of Group Results
When comparing transgenic mice measured at a younger age with those measured at an older age, LV-VI was significantly higher for the older mice, suggesting LV dilation with age for survivin-deficient mice (Table 3). This result was obtained irrespective of the measurement technique (PET, MRI). In contrast, LV-VI was not significantly changed in wild-type mice between young and old mice. Likewise, LV-VI was significantly higher in transgenic mice than in their wild-type littermates when compared at an older age. No significant difference was found between those groups scanned at a younger age. Here again, the choice of imaging technique did not affect this result. The choice of xED had little influence on the results.
DISCUSSION
This study showed the feasibility of obtaining information about LV dilation in groups of mice on the basis of static PET using high-resolution equipment (14,16). The calculation takes little additional time when analyzing serial 18F-FDG PET images of tracer uptake in murine hearts. Serial measurements can be facilitated by separating the steps of interactive reangulation and user-independent calculations. The reangulation parameters are stored with the image data and can be reused for other calculations—for example, bull’s eye representation, mean myocardial 18F-FDG uptake, and so forth.
The results of this study show a good correlation of LV dilation measured by PET and MRI. Results were consistent over a large range of LV volumes; a systematic variation with LV volume was not observed. Whereas measurement of cardiac geometry and functional parameters have been reported for PET in rats (13), the results published for PET in mice are lacking, likely because of the fact that accurate imaging of mouse hearts requires a much higher resolution due to the difference of cardiac dimensions between rats and mice. In the future, one would expect to see more PET studies of murine hearts as more high-resolution PET systems are installed.
Despite a good correlation between PET and MRI, the values for LV dilation obtained by PET were consistently lower than the corresponding values for MRI (mean for end-diastolic or end-systolic states). Obviously, the PET methodology in this work yields instead an index of LV dilation rather than the real end-diastolic or end-systolic volumes. This fact is reflected in the choice of terminology (LV-VI) we have used in the study. Because PET in this study relied on static nongated images, whereas MRI did not, identical measurements between the 2 modalities were not expected. In static PET, myocardial activity over different contraction states is integrated, thus rendering the method unsuitable to assess LV contraction—that is, in the presence of severe myocardial ischemia. Therefore, the objective of this study was limited to the investigation of whether PET is indicative of the presence of LV dilation in groups of transgenic mice with nonischemic cardiomyopathies. This objective can be achieved largely independent of the fractional contributions xED and xES of the end-diastolic and end-systolic volumes assumed in the calculation of LV-VIMRI, as the results clearly illustrate. The possible future usage of gated PET acquisition could expand the versatility of the methodology to also cover the measurement of LV volumes during the cardiac cycle and the assessment of global and regional LV function, albeit at the expense of a higher methodologic complexity. Also, correction of respiratory motion in PET—which, unlike in MRI, is difficult to avoid because of longer acquisition intervals—should be a goal in future development.
In our study, the midmyocardial contour has been chosen for analysis rather than the endocardial or epicardial contours because it is better defined and is less dependent on resolution and wall thickening. It is worth mentioning that the described contour-detection algorithm can be easily extended to the additional calculation of the endocardial and epicardial contours (18), possibly rendering it suitable for the calculation of the LV volumes and the ejection fraction on the basis of ECG-gated data acquisition. However, the midmyocardial contour is also affected by the limited resolution of PET. Volumes within the midmyocardial contour tend to be smaller in images obtained by imaging modalities with a lesser resolution such as PET when compared with higher-resolution imaging modalities such as MRI. This is an effect of convolution of the “real” myocardial signal (which is spatially curved) with the scanner’s point-spread-function, resulting in a shift of the midmyocardial contour toward the convex side in the reconstructed PET images.
Another limitation of the study is the usage of the method of Teichholz et al. (23) applied to one short-axis slice instead of a 3-dimensional reconstruction for the calculation of LV volumes in MRI. This approach reduces acquisition time and allows easy comparison with echocardiography. This approach was considered for our study because the investigated animals developed a cardiomyopathy with global but not regional wall motion abnormalities. In the case of regional wall motion abnormalities, it is known that the Teichholz method is often not adequate. Our own studies have shown a very close agreement between volume calculations using the Teichholz method and a 3-dimensional analysis for mice, with LV volumes ranging from 50 to 100 μL (unpublished data). The methodologic approach was identical to that used in this study. However, we would expect an even better agreement between PET and MRI when using a 3-dimensional approach also for MRI, especially in a future application to ECG-gated PET with the aim of an exact PET-based volume measurement.
Many progressing heart diseases are associated with changes in both metabolism and heart size, and transgenic mouse models are successfully used to obtain insight into the genetic and molecular mechanisms involved. One of these is the mouse model used in this study: the cardiomyocyte-specific survivin knockout mouse (19,20). These mice progressively develop dilated cardiomyopathy and die prematurely. Specialized imaging techniques, among them PET and MRI, were specifically adapted to the imaging and data acquisition in these mice. In general, MRI has been used routinely to study geometric and functional properties of the heart such as LV volumes (22), whereas PET has generally been used previously to study biochemical properties (25). The comparison of groups between the cardiomyocyte-restricted survivin-deficient and wild-type mice presented in this study exemplifies this approach: The data indicative of LV dilation were obtained using either MRI or PET. However, the 2 imaging modalities may show a different power for detecting significant differences, which may also depend on the underlying disease process, making further studies desirable to elucidate these differences and their additive diagnostic potential. The value and significance of our study lie in its ability to allow the simultaneous analysis of LV metabolic properties such as glucose uptake together with a reliable estimation of LV size and, in diseased hearts, the extent of LV dilation.
CONCLUSION
The possibility of obtaining a measure for cardiac dilation with PET in transgenic mice yields a valuable additional parameter for the assessment of cardiac pathophysiologic states from serial myocardial PET. This parameter is obtained with little additional effort from myocardial PET images and, thus, is more time-, effort-, and cost-efficient than the additional use of other imaging modalities such as MRI or echocardiography, while offering a similar diagnostic value.
State-of-the-art equipment for obtaining such results in murine hearts is currently available. Further development of this method should strive to include gated imaging and even correction for respiratory motion.
Acknowledgments
We thank Christine Baetza for help with image analysis and the staff of the cyclotron and radiochemistry facilities, University Hospital Münster, for radiotracer preparation. This work was supported in part by the Interdisciplinary Centre of Clinical Research Münster, grant ZPG 4b, the H.-H. Deichman Foundation for Atherosclerosis Research, grants from the Deutsche Forschungsgemeinschaft (SFB 656, SCHA 758/5-1, LE 940/3-1), and the Fund for Scientific Research–Flanders, Belgium.
Footnotes
Received Jan. 18, 2005; revision accepted Apr. 27, 2005.
For correspondence or reprints contact: Lars Stegger, PhD, Department of Nuclear Medicine, University Hospital Münster, Albert-Schweitzer-Strasse 33, 48149 Münster, Germany.
E-mail: stegger{at}uni-muenster.de
REFERENCES
In this issue


Jump to section
Related Articles
Cited By...
- Micro-Positron Emission Tomography in the Evaluation of Trypanosoma cruzi-Induced Heart Disease: Comparison with Other Modalities
- Quantification of Left Ventricular Volumes and Ejection Fraction in Mice Using PET, Compared with MRI
- Accurate Noninvasive Measurement of Infarct Size in Mice with High-Resolution PET