


Abstract
111In-Capromab pendetide imaging is indicated for postprostatectomy patients at risk for residual or recurrent disease. However, this study is complicated by relatively long times for tumor uptake and background washout that require imaging to be performed several days after radiopharmaceutical administration. In addition, 111In-capromab pendetide demonstrates uptake in normal structures that produce images that are interpreted best using correlation with anatomic imaging. Finally, the visual quality of radionuclide imaging can be improved with corrections for photon attenuation and for the geometric response of the radionuclide collimator. Therefore, we have evaluated the advantages of using a commercially available dual-modality SPECT/CT system. In this article, we evaluate a novel iterative reconstruction algorithm using the SPECT/CT data obtained from phantoms and 111In-capromab pendetide patient studies. Methods: Phantom data acquired with the dual-head SPECT camera were reconstructed using both filtered backprojection (FBP) and an iterative maximum-likelihood expectation maximization (MLEM) algorithm incorporating corrections for (a) attenuation coefficient at the effective energy of the radionuclide (either 99mTc or 111In) and (b) collimator response based on experimentally measured depth-dependent spatial resolution of the camera. The collimator response model used the coregistered CT image to estimate the source–target distances produced by the patient-contouring logic of the SPECT camera. Spatial resolution was measured using SPECT images of 2 line sources and uniformity from a uniform cylindric tank. Clinical 111In-capromab pendetide SPECT/CT data were acquired according to the radiopharmaceutical manufacturer’s protocol. Region-of-interest (ROI) analysis of a transverse slice at the level of the sacral base produced mean, median, maximum, and minimum counts per pixel for bone marrow and surrounding soft-tissue ROIs. Ratios of the mean capromab pendetide uptake within marrow to uptake within soft tissue were compared for images reconstructed with FBP versus that obtained from the MLEM method with photon attenuation and collimator response corrections. Results: The source–target distances reconstructed from the patient-specific CT image agreed well with the corresponding values recorded manually from the camera display unit. This information was incorporated into the iterative reconstruction algorithms and improved the quality of SPECT images from phantoms and patients versus SPECT images reconstructed without the depth-dependent collimator response model. Qualitatively, SPECT images reconstructed with corrections for photon attenuation and collimator response showed less background activity and improved target contrast compared with those images reconstructed with FBP. The target-to-background ratio (marrow uptake-to-soft-tissue uptake) was significantly better using MLEM reconstruction than with FBP when mean uptake values were measured. Conclusion: A priori anatomic data can be used to enhance the quality of the SPECT image when reconstructed using iterative techniques (e.g., MLEM) that use the CT data to produce a patient-specific attenuation map and a collimator response model based on the body contour produced during the SPECT acquisition.
- dual-modality SPECT/CT
- iterative reconstruction
- attenuation correction
- collimator model
- 111In
- capromab pendetide
- prostate cancer
Radionuclide imaging, including SPECT and PET, is finding increasing roles in the detection and staging of cancer. Moreover, the interpretation of oncologic studies with nuclear medicine often is enhanced by the availability of anatomic information from CT and MRI that helps the interpreter to differentiate uptake of the tracer due to the disease process from that associated with normal physiologic function. Correlated anatomic information also improves the differentiation of primary and metastatic disease to improve staging and to guide treatment-planning decisions. For these reasons, dual-modality techniques that combine CT with either SPECT or PET recently have gained acceptance for several clinical applications, including those in oncologic imaging. SPECT/CT (1) and PET/CT (2) facilitate functional–structural correlation by producing coregistered functional and anatomic images during a single patient procedure. In addition, SPECT/CT (1) and PET/CT (2) also use the correlated CT image to produce high-quality, patient-specific attenuation maps that can be used for attenuation correction to improve both the visual quality and the quantitative accuracy of the radionuclide image data.
Dual-modality imaging has had its greatest impact in the form of combined PET/CT of cancer using 18F-FDG. These procedures take advantage of the high avidity of malignant tissues for FDG, the high-sensitivity of PET for imaging 18F-FDG distributions in vivo, and the excellent image quality and fast scan speeds afforded by modern multislice CT scanners (3). SPECT/CT systems now are available commercially, but its use has been moderated by the limited number of radiolabeled oncologic agents clinically available for single-photon imaging. Nevertheless, significant efforts have been devoted to the development of tumor-specific antibodies that can be labeled with single-photon emitters for radionuclide imaging. 111In is commonly used as a radiolabel for tumor-specific antibodies since its physical half-life (67.3 h) is compatible with the tumor uptake and background washout times of these agents. However, 111In emits 2 γ-rays having energies centered around 171 and 245 keV, which requires SPECT to be performed with a medium-energy collimator that compromises spatial resolution and geometric efficiency. For these reasons, SPECT studies of cancer using 111In must be designed in a way that takes these features into account so that the resulting images have the highest possible quality for visual interpretation.
111In-Capromab pendetide (111In-ProstaScint; Cytogen Corp.) now is available for imaging assessments of prostate cancer staging and recurrence (4). This application represents the type of study in which traditional SPECT of this agent is complicated by both the low counting rate and the limited spatial resolution contributed by the medium-energy collimator of the scintillation camera and by nonspecific radionuclide uptake. Several investigators (4, 5) have found that interpretation of 111In-capromab pendetide is aided significantly by the addition of correlated anatomic information that improves differentiation of normal uptake from that associated with disease. In addition, the correlated anatomic information also provides landmarks that can be used to guide biopsy or targeted treatment with brachytherapy or intensity-modulated radiation therapy (6).
In this article, we present techniques of reconstructing phantom and patient images of 111In-capromab pendetide using a commercial dual-modality SPECT/CT system manufactured by GE Healthcare (Discovery VH). The combined SPECT/CT system facilitates image fusion by generating both the SPECT and the CT images without having to move or reposition a phantom or a patient during the study. The coregistered CT image also can be used to obtain a patient-specific attenuation map that can be incorporated into iterative SPECT reconstruction algorithms (7, 8), such as maximum-likelihood expectation maximization (MLEM) (9, 10) or ordered-subsets expectation maximization (OSEM) (11) for correction of photon attenuation in the radionuclide data.
Since 111In emits γ-rays at 2 energies (i.e., 171 and 245 keV), the reconstruction process, in theory, requires separate attenuation maps to be calculated and applied to the radionuclide data collected at each photon energy. However, in this study, we derive a single attenuation map from the x-ray data that is calculated at the “effective” photon energy of 111In and that can be applied to pooled radionuclide data from the 2 γ-ray photopeaks. In addition, since the 111In-capromab pendetide images are obtained with a medium-energy collimator that can compromise spatial resolution, the iterative reconstruction techniques incorporate a depth-dependent collimator response model to improve the spatial resolution characteristics, and potentially the quantitative accuracy, of the reconstructed image. The process of calculating the depth-dependent collimator response is complicated by the use of patient contouring by the Discovery VH for radionuclide imaging, especially because the system does not record the radius of rotation as a function of rotation angle during the acquisition. Since this information is needed for the depth-dependent collimator response model (12, 13), we have calculated the radius of rotation from the correlated CT data produced by the Discovery VH. The overall goal of this study is focused on using the SPECT/CT data acquired with the Discovery VH system to correct the radionuclide data for photon attenuation using a single attenuation map and to implement a depth-dependent collimator response correction that includes body-contour information. These techniques are applied to 111In-capromab pendetide images acquired from patient volunteers enrolled in an on-going clinical protocol that uses SPECT/CT to improve both image quality and quantitative accuracy of 111In-capromab pendetide imaging performed with the combined SPECT/CT system.
MATERIALS AND METHODS
Overview and Goals of Study
In this article, we present techniques of reconstructing phantom and patient images using a commercial dual-modality SPECT/CT system manufactured by GE Healthcare with a general goal of improving cancer staging with 111In-capromab pendetide imaging. The technical goal of our study focuses on corrections of photon attenuation and depth-dependent collimator response using patient-specific anatomic information derived from the coregistered CT image using the Discovery VH Hawkeye SPECT/CT system. Finally, we present preliminary patient images and quantitative measurements from an on-going clinical 111In-capromab pendetide study that demonstrates the role of iteratively reconstructed SPECT images having corrections for photon attenuation and collimator response derived from the coregistered CT image.
Equipment
This study used the Discovery VH Hawkeye SPECT/CT system with a 25.4-mm-thick NaI(Tl) crystal manufactured by GE Healthcare installed in the nuclear medicine clinic in the Department of Radiology at University of California, San Francisco (UCSF), Long/Moffitt Hospital. The system includes an x-ray tube and detector arrays that are offset along the axial direction from the 2 scintillation cameras. The radial positions of the x-ray tube and detector array are fixed with respect to the axis of rotation, but the radial position of the rotating scintillation cameras can vary to enable automatic body contouring during the acquisition of the radionuclide image.
In addition, the study used a personal computer running Windows XP (Microsoft Corp.) for image display and fusion. Tomographic image reconstruction was performed using a dual-processor (2.66-GHz Intel Xeon) computer under a Linux operating system (Rad Hat, Inc.) with a GNU Compiler Collection (“gcc”) version 3.2.3 (Free Software Foundation, Inc.) and Intel C Compiler (“icc”) version 8.0 (Intel Corp.) with appropriate optimization methods used for SPECT image reconstruction.
Acquisition Protocols
All SPECT data in this study were acquired using a 128 × 128 matrix with a 3.45-mm pixel size and with patient contouring. In most phantom and patient studies, the SPECT acquisition was performed with 60 stops at 30–60 s per stop for a 360° rotation of the dual-head camera.
The CT acquisition, which was common to every SPECT/CT study in this article, was performed using a 256 × 256 matrix and a 10-mm slice thickness over an angular extent of approximately 215° (i.e., equal to 180° plus the x-ray fan angle). The CT data were acquired at 140 kVp and 2.5 mA. The CT acquisition took approximately 15 min and was performed after the SPECT acquisition. The CT reconstruction was performed using a filtered backprojection (FBP) algorithm provided by the manufacturer.
Attenuation Map Generation
To reconstruct the SPECT images with attenuation correction, CT-derived attenuation maps that are radionuclide and object specific were generated using 2 different methods: one method developed by our group and the other provided by the camera manufacturer. SPECT images reconstructed using attenuation maps from the 2 methods then were compared to evaluate the relative characteristics of these techniques. The 2 methods used different energy-calibration techniques but used a FBP algorithm provided by the manufacturer to produce the x-ray–based attenuation maps using x-ray projection data acquired using the protocol described.
The first method acquired calibration measurements of a bone mineral densitometry phantom with elliptic cross-section having dimensions of 275-mm long axis, 215-mm short axis, and 45-mm thickness (Mindways) that contained 4 smaller cylindric chambers filled with aqueous solutions of K2HPO4 with known chemical compositions and densities. The K2HPO4 concentrations in these 4 small cylinders ranged from 50 to 200 mg/mL. After the calibration phantom was imaged and reconstructed, the CT numbers for each cylindric chamber were extracted from the tomograms and were plotted versus their known linear attenuation coefficients (14). These values were plotted with a piecewise linear calibration curve that could be used to convert the CT numbers from the patient to their corresponding energy-corrected linear attenuation coefficients on a pixel-by-pixel basis to produce an object-specific attenuation map. This technique can be used directly to produce an attenuation map for radionuclides emitting γ-rays of a single energy (e.g., 99mTc at 140 keV). However, this method must be modified to calculate an attenuation map for 111In, which emits 2 γ-rays of different energies. In this case, the attenuation map for 111In was calculated using a technique developed by Wong et al. (15), in which the effective attenuation coefficient for photons of 2 different energies from a single radionuclide is expressed by:
 Eq. 1 where μ1 and μ2 are attenuation coefficients for each γ-energy, α is the ratio of the branching ratios, and x is the thickness of the medium through which the γ-rays pass. The linear attenuation coefficients μ1 and μ2 are also obtained from tabulated values (14), with α calculated from the branching ratios (i.e., 94%, 90.2%) of the 171- and 245-keV γ-rays (i.e., α = 94%/90.2% = 1.042). Wong et al. observed that for 111In, the effective linear attenuation coefficient μeff is relatively constant as a function of object thickness x, thereby producing an attenuation map at a single effective energy at Eeff = 210 keV that can be applied to pooled data acquired from 111In.
The second method used the calibration technique provided by the manufacturer (GE Healthcare) to automatically generate an attenuation map based on the CT image data acquired from the patient. The version of the software available at the time of this study generates an attenuation map that compensates only for a higher energy peak (245 keV) of the 2 γ-ray energies of 111In. A newer version of software now is available from the manufacturer that produces an attenuation map that accounts for both photon energies of 111In (16). The 2 methods of generating the attenuation map were compared using an acrylic resolution phantom with cylindric holes (3- to 36-mm diameter) and contained within a water-filled cylindric container. CT images of the resolution phantom were acquired with the resulting x-ray data and used to generate attenuation maps using 2 different methods as described. We chose this phantom for comparing the different 111In attenuation map–generation techniques because it provides 2 materials (acrylic, water) with linear attenuation coefficients that were different from one another but both similar to that of soft tissue. In addition, the phantom had a geometry from which linear attenuation coefficients can be easily compared when linear pixel profiles are extracted from the reconstructed CT tomographic image. We used the CT reconstruction algorithms provided by the manufacturer to produce CT images used in this comparison study.
Collimator Response Correction with Body-Contouring Adjustment
The depth-dependent spatial resolution response was measured experimentally for 111In imaging using the GE medium-energy collimator (model VPC-5) and for 99mTc point sources with the GE low-energy, high-resolution collimator (LEHR; model VPC-45). These measurements were performed by placing a small drop of the radionuclide in a syringe needle cap to form small cylindric sources having approximately 2 mm both in diameter and in height. Planar images (500,000 counts each) of the small source were acquired at different source–collimator distances in 20-mm increments ranging from 206.3 to 396.3 mm from the collimator surface. At each distance, a profile was defined across the point-spread function and fitted with a gaussian distribution using linear least-squares regression to extract the SD as a function of the source–collimator distance. The SD function was used to model the depth-dependent collimator blurring in the iterative SPECT reconstruction algorithm.
The Discovery VH uses patient contouring to acquire the SPECT data with the best possible spatial resolution but does not record the radius of rotation during the acquisition process. However, the depth-dependent collimator response correction requires that the distance between the center of rotation of the SPECT cameras and the detector surface is known, so the appropriate width of the blurring function can be applied at a specific point in the object. The body-contouring orbit of the SPECT camera also cannot be estimated only from preset geometric parameters and must be derived from the anatomic characteristics of the patient. Therefore, we estimated the radius of rotation at each angular position of the scintillation cameras by extracting the patient contour from the coregistered CT image. This was performed by collapsing the entire 128 CT slices that cover the extent of the patient body into a single slice image from which the maximum extent of the body could be defined over the SPECT camera’s field of view. These values then were incorporated into the iterative reconstruction algorithm to estimate the source–collimator distances generated by the body-contouring logic of the SPECT camera for each frame of the SPECT acquisition to correctly implement the depth-dependent collimator response model. The estimated contouring trajectory of the SPECT camera was verified by comparing it to the actual camera trajectory recorded manually from the system display unit during the acquisition from an anthropomorphic cardiac-torso phantom (Data Spectrum, Inc.).
Reconstruction Algorithms
The SPECT images from the phantom and clinical studies were reconstructed using both FBP and iterative MLEM reconstruction methods. The FBP reconstruction included a Butterworth filter with a 0.5 Nyquist cutoff frequency for imaging 99mTc and a Hanning filter with a 0.85 Nyquist cutoff frequency for imaging 111In. The SPECT data reconstructed using the MLEM algorithm incorporated photon attenuation and system-specific collimator response corrections that accounted for body-contouring during the SPECT acquisition.
One of the goals of this study was to quantify the spatial resolution and uniformity of the images reconstructed with FBP versus those reconstructed with MLEM, including corrections for photon attenuation and collimator response. However, it is well known that the spatial resolution and signal-to-noise ratio (SNR) characteristics (and therefore the uniformity) of the images reconstructed with MLEM change as a function of iteration number. To make a reasonably fair comparison between the results from FBP versus those from MLEM, we reconstructed the MLEM images using the number of iterations that produced images that most closely matched the SNR characteristics of those reconstructed using FBP. In this study, the analysis of the SNR characteristics versus iteration number of the MLEM algorithm was performed for both 99mTc and for 111In.
The SNR versus iteration analysis for 99mTc was performed by acquiring emission data from a uniform cylindric phantom (180 mm in diameter) filled with an aqueous solution of 99mTc-pertechnetate (65 MBq). The SPECT data were acquired as 128 × 128 matrices with a LEHR collimator for approximately 60 min (i.e., 60 stops at 60 s per stop) using a 360° rotation of the dual-head camera. The image data were reconstructed using (a) FBP, (b) MLEM without any corrections, (c) MLEM with photon attenuation correction only, (d) MLEM with collimator response and body-contouring corrections only, and (e) MLEM with corrections for photon attenuation, collimator response, and patient contouring. The SNR was assessed quantitatively by computing the statistical mean of pixel values as signal and the SD of pixel values as noise on a region of interest (ROI) that contained 1,340 pixels within the uniformity phantom. The same SNR calculation was repeated for 12 sequential tomographic slices from the same region of SPECT data. The statistical mean of the 12 SNR values from the SPECT acquisition was plotted against with the MLEM iteration number. To compare the SNR characteristics of the SPECT-reconstructed image using FBP versus that using MLEM reconstruction, we calculated the SNR value from the FBP-reconstructed image using the same ROI that was used to analyze the data from the MLEM reconstructions and included the result as a constant value at each iteration number in the same plot that was described earlier.
To analyze the SNR characteristics versus MLEM iteration number for 111In, we acquired SPECT projection data of an anthropomorphic torso phantom (Data Spectrum) in which the liver compartment (1.2 L) contained approximately 130 MBq of 111In (0.108 MBq/mL). Five repetitive SPECT acquisitions were performed using a 128 × 128 matrix with a medium-energy collimator with 60 stops at 30 s per stop (approximately 30-min acquisition time) and a 360° rotation of the dual-head camera. Images were reconstructed using FBP and then using MLEM with corrections for attenuation, collimator response, and contouring. The SNR was assessed quantitatively by computing the statistical mean of pixel values as signal and the SD of pixel values as noise on a ROI with 374 pixels within a uniform region of the liver compartment. The same SNR calculation was repeated for 4 sequential tomographic slices in the same SPECT reconstructed images. The same procedure to calculate the SNR was repeatedly performed for the 5 SPECT acquisitions using the same phantom. The mean of the 4 SNR values from a single SPECT acquisition was used to represent an average SNR for the SPECT uniformity data and plotted against the MLEM iteration number. The statistical mean of 20 SNR values from 4 tomographic slices of all 5 SPECT acquisitions was plotted against the MLEM iteration number. To compare the SNR characteristics of the SPECT image using FBP versus that using MLEM, we calculated the SNR ratio from the FBP-reconstructed image using the same ROI that was used in the SNR versus the MLEM iteration number analysis and included that result as a constant value at each iteration number in the same plot that was described earlier.
Phantom Measurements
Phantom measurements were performed to evaluate the validity of our MLEM reconstruction method with corrections for photon attenuation, collimator response, and body-contouring corrections. This was performed by (a) measuring field uniformity and spatial resolution and (b) verifying the improvement in target-to-background ratio from MLEM-reconstructed SPECT images acquired with body contouring in comparison with that acquired with a conventional circular-orbit SPECT acquisition.
The system uniformity of the SPECT image was assessed by acquiring emission data from a uniform cylindric phantom (180 mm in diameter) filled with an aqueous solution of 99mTc-pertechnetate (65 MBq) at a concentration of 0.033 MBq/mL. The SPECT data were acquired as 128 × 128 matrices with a LEHR collimator for approximately 60 min (i.e., 60 stops at 60 s per stop) using a 360° rotation of the dual-head camera. The image data were reconstructed using both FBP and MLEM with corrections for photon attenuation, collimator response, and patient contouring. The image uniformity was assessed quantitatively by comparing linear profiles of pixel values in the reconstructed images. We assessed the merged images formed by adding 12 sequential tomographic slices representing a total thickness of 41.4 mm. We then extracted the linear profiles over 128 pixels in the horizontal direction crossing the center of the summed reconstructed images.
The system spatial resolution of the SPECT camera was measured using two 25.4- mm-long 20-gauge syringe needles to form line sources containing approximately 55 and 75 MBq of 99mTc-pertechnetate, respectively. The line sources were placed parallel to each other and directly on the patient table with a separation of 70 mm. SPECT data were acquired as 128 × 128 matrices with a LEHR collimator with 60 stops at 30 s per stop (approximately 30-min acquisition time) with a 360° rotation of the dual-head camera. Although we used the body contouring to acquire these data, the actual camera trajectory during the acquisition was limited because the SPECT camera could not move closer than approximately 120 mm from the center of rotation, and the SPECT camera was limited to a minimum source–detector distance of approximately 210 mm due to the need to clear the outer extent of the patient table. Images were reconstructed using both FBP and MLEM with corrections for photon attenuation, collimator response, and body contouring. Line profiles were used to extract the point-spread functions from the reconstructed line source images. We then calculated the full width at half maximum (FWHM) of a gaussian function fit to the extracted point-spread function.
The target-to-background ratios obtained using body contouring versus that obtained with the circular orbit were verified by imaging the liver compartment of the anthropomorphic phantom. In this study, the liver compartment (1.2 L) was filled with an aqueous solution of 111In at a concentration of 0.11 MBq/mL. In addition, 2 water-filled spheric inserts were placed in the liver compartment. The larger sphere (19 mL) contained 6 MBq of 111In (i.e., 0.32 MBq/mL), whereas the smaller sphere (5 mL) contained 4 MBq of 111In (i.e., 0.80 MBq/mL). The radionuclide concentrations in the liver compartment and 2 sphere inserts were configured to mimic the radionuclide concentrations typical of those found in a human subject with prostate cancer (17). We acquired 2 sets of SPECT data with the same acquisition parameters used for the SNR versus iteration analysis, with the first acquired with body contouring and the other acquired with a circular orbit having a radius of 312 mm. Images were reconstructed using MLEM with corrections of photon attenuation and collimator response. The target-to-background ratio was adopted as a quantitative metric to compare these 2 reconstructed images. The target activity was measured by placing a circular ROI with 24 pixels on the image of a small spheric insert. The background activity was measured by placing an irregular ROI with 104 pixels adjacent to the edge of the small spheric insert. These ROIs were used to calculate the target-to-background ratio for these SPECT data.
Preliminary Clinical Studies
111In-Capromab pendetide studies of patient volunteers were performed with the Discovery VH SPECT/CT system using the techniques developed from the phantom studies. The patient studies used SPECT and CT data from patients referred to the UCSF Nuclear Medicine Clinic for 111In-capromab pendetide imaging. All volunteers enrolled in this study signed informed consent approved by our institutional Committee on Human Research. Data from these patients were processed and archived according to the HIPAA (Health Insurance Portability and Accountability Act of 1996) requirements. The patient protocol was not modified from the acquisition procedure recommended by the 111In-capromab pendetide vendor (Cytogen Corp.). For the clinical 111In-capromab pendetide SPECT/CT, we administered approximately 200 MBq of 111In to each patient and acquired image data approximately 93 h after injection. The SPECT data were acquired in a 128 × 128 format using a medium-energy collimator with an acquisition time of approximately 60 min (i.e., 60 stops at 60 s per stop) with a 360° rotation of the dual-head camera. After completion of the 111In-capromab pendetide study, the correlated SPECT and CT data were reconstructed using algorithms provided by the camera manufacturer and were interpreted following the normal clinical protocol. In addition, the SPECT and CT data were transferred to an off-line computer for processing and reconstruction for this experimental protocol. The experimental protocol included reconstruction of the SPECT data using 40 iterations of a MLEM method with corrections for photon attenuation, collimator response, and body contouring. In addition, as part of the experimental study, we gathered information on the patient’s prostate cancer history, including the prostate-specific antigen level and treatment history for those patients with recurrent prostate disease.
We performed a preliminary study to quantify the target-to-background ratio of 111In-capromab pendetide uptake in the region of the bone marrow and a region of soft tissue surrounding the bone marrow. The measurement was performed using transaxial SPECT images of 111In-capromab pendetide at the level of the sacral base and reconstructed using both the FBP and a MLEM iterative reconstruction that included corrections for photon attenuation, collimator response, and patient contouring. To obtain a semiquantitative measure of activity within the bone marrow for comparison with background activity in the soft tissues, ROIs were selected manually around the iliac wings, including cortical and trabecular bone on transaxial projections using the coregistered CT image as a template. ROIs for soft tissue were defined around the muscles of the posterior hip in a similar manner. These ROIs were used to produce ratios of the activity within normal bone marrow (target) to the activity localized to soft tissue (background).
RESULTS
Photon Attenuation Map Generation and Comparison in 2 Methods
We derived attenuation maps for 111In from the coregistered CT image using both the effective energy method (Eq. 1) and the algorithm provided by the manufacturer as part of the Discovery VH system. The CT-derived 111In attenuation maps in units of inverse centimeters (cm−1) for the acrylic hot-lesion resolution phantom (holes of 3- to 36-mm diameter) are displayed in Figure 1 as derived from these 2 methods. These data show that the absolute values of linear attenuation coefficients in water differ by approximately 6%, whereas the shapes of the 2 attenuation profiles are similar. The result is consistent with the published tabulated values (14); for example, linear attenuation coefficients for water are 0.135 cm−1 for 210 keV (the effective energy of 111In) and 0.127 cm−1 for 245 keV (the energy on which the manufacturer’s algorithm is based). The reconstructed SPECT images using either attenuation map yielded visually similar results in both phantom and patient images. In addition, the quantitative values should be more accurate in SPECT images reconstructed using attenuation maps calibrated at an effective energy of 210 keV rather than those calculated for a 245-keV γ-ray energy.
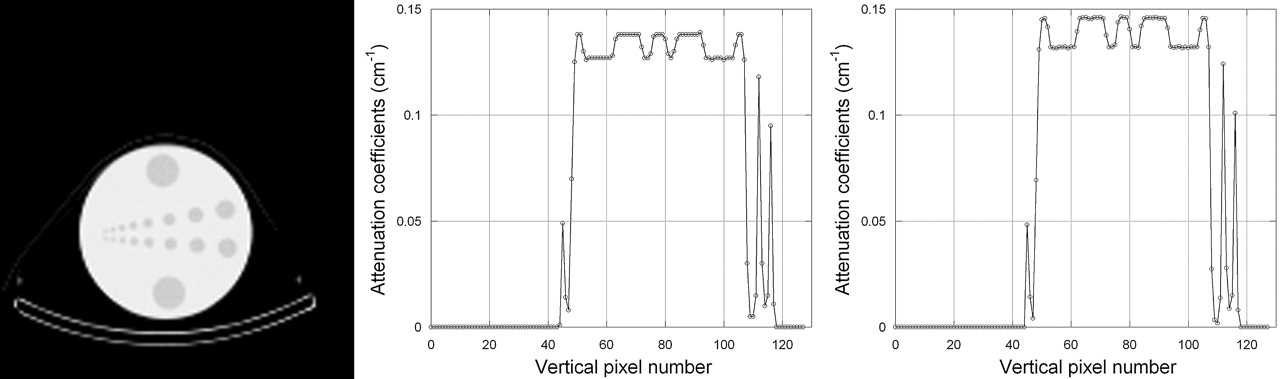
CT image of acrylic water-filled resolution phantom (left). Linear attenuation coefficients were extracted along a line from attenuation maps from GE Discovery VH (middle) and using effective energy method (Eq. 1; right).
Collimator Response Correction on SPECT Reconstruction
The SD of the gaussian point-spread function was measured and was expressed as a linear function of the source–collimator distance to be used in our MLEM reconstruction algorithms for collimator response corrections. When the VPC-5 (medium energy) collimator was used to image an 111In point source, the linear function expressing the SD versus source–collimator distance had a slope of 0.0146 and y-intercept of 0.0951 when both the SD and the source–collimator distance were expressed in centimeters. Similarly, when the 99mTc point source was imaged with a VPC-45 LEHR collimator, the linear function relating the SD to the source–collimator distance had a slope of 0.0183 and a y-intercept of 0.0733 with all dimensions expressed in centimeters.
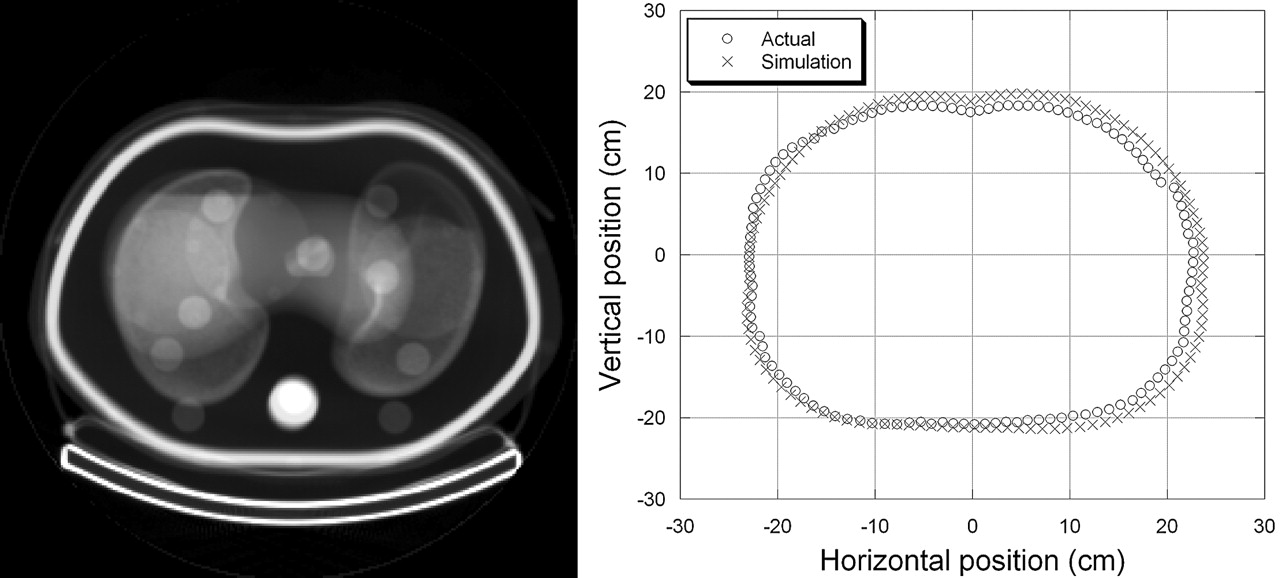
The body-contour dimensions recorded manually from the display unit of the Discovery VH and the measurements derived from the patient-specific CT data from the Data Spectrum anthropomorphic torso phantom are shown in Figure 2 for a 360° rotation of the SPECT system. The 2 patient contours are in good agreement and indicate that the patient contour derived from the CT data can be used in the SPECT iterative reconstruction algorithm for correction of the depth-dependent collimator response. The root-mean-square of the difference in the radii of 2 camera trajectories for this specific example was 1.07 cm.

Composite CT image representing sum of all 128 slices from anthropomorphic phantom (left) and contours representing actual and calculated camera trajectories (right).
Signal-to-Noise Versus Iteration Analysis
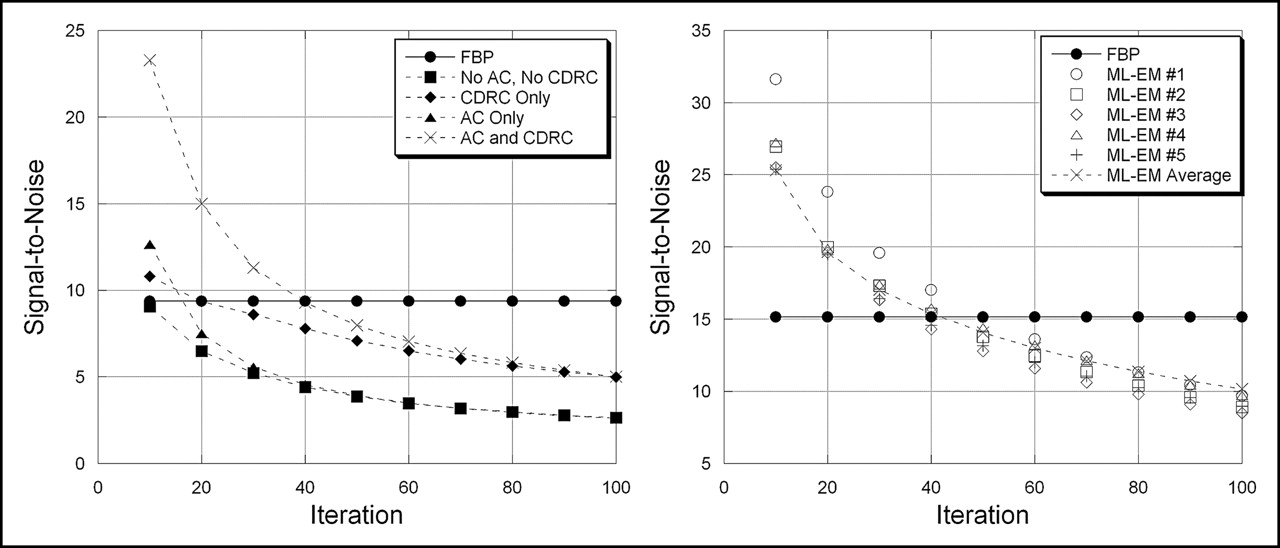
The SNRs were measured as a function of iteration number from SPECT images reconstructed using MLEM for both 99mTc and 111In phantom data (Fig. 3). The ratios also were measured from the SPECT images reconstructed with FBP using the same projection data as those reconstructed using MLEM. The SNRs from MLEM then were plotted versus iteration number to identify the number of iterations that yielded the signal-to-noise characteristics that agreed primarily with those obtained from FBP.

SNRs are plotted against iteration number for SPECT images reconstructed with MLEM algorithm for data from uniform cylindric phantom filled with 99mTc (left) and from anthropomorphic torso phantom filled with 111In (right). Curves are shown for FBP, for MLEM with attenuation correction only (AC), and for MLEM with correction for collimator response (CDRC).
Figure 3 shows the SNR versus iteration number for SPECT images obtained from the 99mTc-filled cylindric phantom. The SNR obtained from FBP is plotted as a constant value (i.e., independent of iteration number) and produces a SNR similar to that obtained with MLEM at (a) iteration 10 when the image was reconstructed using the MLEM method without any corrections, (b) iteration 20 when reconstructed using the MLEM method with only collimator response and body-contouring corrections, (c) iteration 15 when reconstructed using the MLEM method with only photon attenuation correction, and (d) iteration 40 when reconstructed with corrections of photon attenuation, collimator response, and body contouring. We then used these numbers of iterations to compare SPECT images reconstructed with MLEM versus those reconstructed with FBP so the tomograms obtained with the different methods would exhibit the equivalent SNR characteristics.
Figure 3 also shows the SNR versus number of iterations obtained from the cardiac torso phantom imaged with 111In. In this case, the SNRs at iteration 40 of the MLEM algorithm with corrections for photon attenuation, collimator response, and body contouring approximates that obtained with FBP. It is interesting that the same number of iterations (i.e., 40) using MLEM produced the SNR that most closely matched the SNR obtained using FBP for both 111In and 99mTc. On the basis of this result, throughout this article, we used 40 iterations to reconstruct SPECT data of phantoms and patients imaged with 111In using the MLEM algorithm with corrections of photon attenuation and collimator response when these results were compared with those obtained with FBP.
Uniformity and Resolution of SPECT Camera
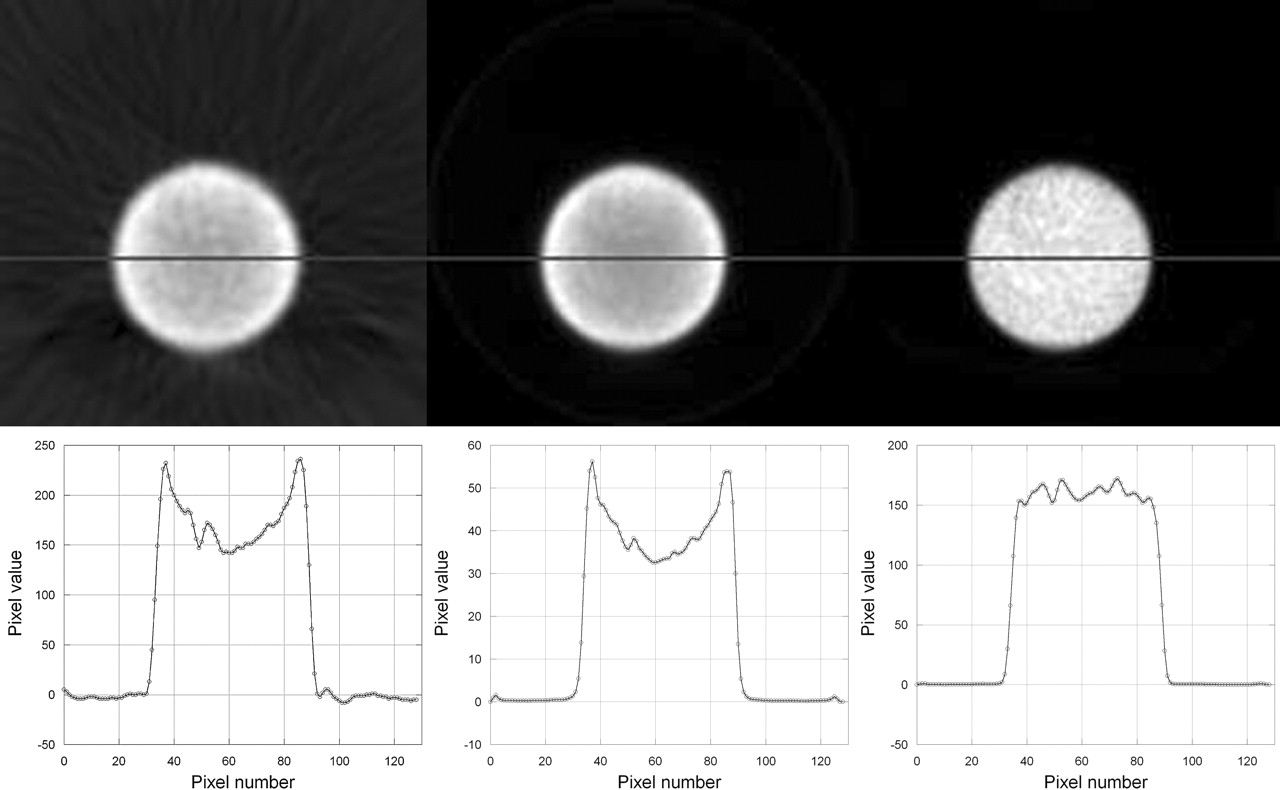
The uniformity of radionuclide tomograms was measured from a cylindric tank filled with a uniform radionuclide (99mTc) concentration and was assessed by comparing horizontal linear profiles defined across the reconstructed images. Figure 4 demonstrates differences in the visual quality and in linear count profiles for SPECT images reconstructed with (a) FBP, (b) 20 iterations of MLEM using a correction of collimator response that included patient contouring, and (c) 40 iterations of MLEM with corrections for both photon attenuation and collimator response. If perfectly reconstructed, we expect the profiles to be flat, reflecting the uniform radioactivity distribution in the cylindric tank. However, profiles of the 2 images without photon attenuation correction (Fig. 4, left and middle) show a “cupping artifact,” indicating the effects of photon attenuation. The SPECT image reconstructed using MLEM with CT-derived attenuation correction shows a slight “capping artifact,” probably reflecting the lack of scatter compensation in the reconstruction of the radionuclide data.

SPECT images (top) of uniform cylindric phantom and corresponding count profiles (bottom) along a line through center of image. SPECT images were reconstructed with FBP (left), with MLEM including collimator response correction but without attenuation correction (20 iterations, middle), and with MLEM including corrections for both collimator response and photon attenuation (40 iterations, right).
The system spatial resolution was measured using parameters obtained from the gaussian fit of point-spread functions of the imaged line sources. These values improved approximately 60% (from 24.3 to 9.91 mm FWHM) when the image was reconstructed using 40 iterations of the MLEM algorithm that included corrections for both photon attenuation and depth-dependent collimator response in comparison with the value when the image was reconstructed using FBP.
Circular Orbit Versus Body Contour
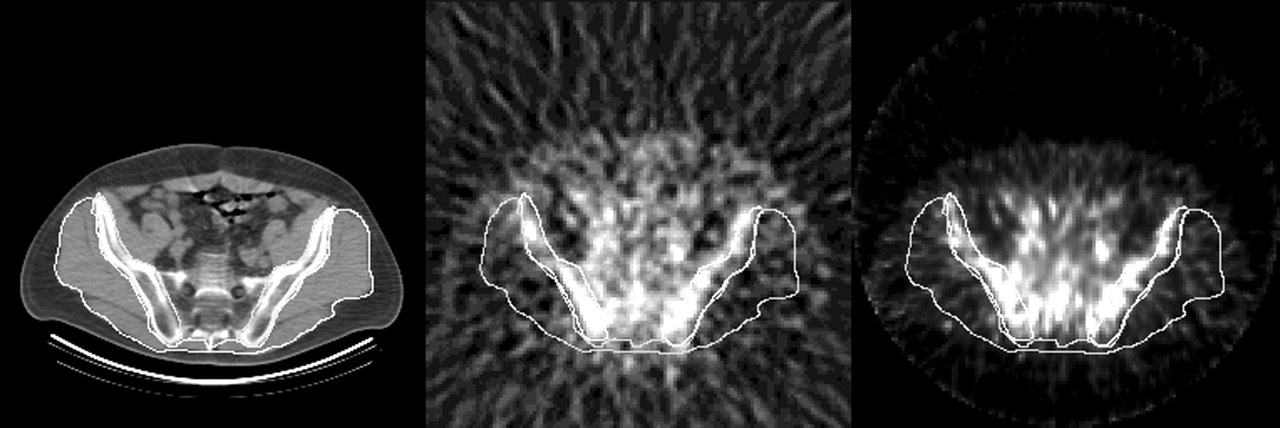
SPECT data acquired with body-contouring records the radionuclide data with improved spatial resolution and, subsequently, should improve measurements of the target-to-background ratio in comparison with those acquired with a circular orbit. Therefore, we calculated the mean pixel value in target and background regions from SPECT images of the anthropomorphic torso phantom filled with 111In. Figure 5 shows ROIs drawn on corresponding slices from CT, from SPECT using data acquired with a circular orbit, and from SPECT using data acquired with body contouring. Both SPECT images were reconstructed with 40 iterations of a MLEM algorithm and included corrections for photon attenuation and collimator response. In this measurement, the SPECT data acquired with a circular orbit produced a target-to-background ratio of 3.87. In comparison, the SPECT data acquired with body contouring produced a target-to-background ratio of 4.24. The actual target-to-background ratio for these ROIs was approximately 7. This result indicates that the target-to-background ratio could be improved when the SPECT is acquired using the body-contouring orbit rather than the conventional circular orbit.

Target-to-background was analyzed using anthropomorphic phantom with 111In-filled liver compartment containing 2 spheric lesions with higher concentrations. CT image (left) of phantom with corresponding SPECT images reconstructed using 40 iterations of MLEM with corrections for photon attenuation and collimator response from acquisitions with circular orbit (middle) and with body contouring (right). Circular ROI in hot spheric lesion was used to define target activity, whereas irregular ROI in liver compartment was used to define background activity.
Preliminary Clinical Studies
The techniques developed from the phantom studies were incorporated into a MLEM algorithm to reconstruct clinical 111In-capromab pendetide SPECT images. The MLEM algorithm incorporated corrections for photon attenuation and for depth-dependent collimator response that included the body-contour measurement obtained from the correlated x-ray tomograms. The tomographic data reconstructed with the MLEM reconstruction then were compared with images reconstructed from the same projection data using a conventional FBP algorithm. The SPECT data reconstructed with the MLEM algorithm displayed fewer streak artifacts than FBP, especially in low-radioactivity regions that were adjacent to high concentrations of radioactivity. These results showed that the MLEM algorithm with corrections for photon attenuation and depth-dependent collimator response generally improved the visual quality of the SPECT image in comparison with conventional FBP SPECT images or in comparison with SPECT images reconstructed with the MLEM algorithm without the depth-dependent collimator response model.
The image data reconstructed using FBP also were compared quantitatively with those obtained using the MLEM algorithm with corrections for photon attenuation and depth-dependent collimator response. These measurements were performed on correlated SPECT and CT tomograms at the level of the sacral base as shown in Figure 6. ROIs were defined on the CT image and used to quantify radionuclide uptake in the corresponding SPECT image in the bone marrow as a target region and in soft tissues posterior to the pelvis as a background region. For this specific image, the target-to-background ratio was 2.79 for the SPECT image with the MLEM reconstruction with attenuation and collimator response corrections and 1.98 for the FBP-reconstructed image. Four such images from 4 patient studies were analyzed in the preliminary study, and we found that the MLEM increased the measured target-to-background ratios in all 4 images. These results demonstrate that the target-to-background contrast could be improved using the MLEM algorithm in comparison with the results obtained with FBP or iterative reconstruction algorithms without such corrections.
SPECT/CT images from clinical 111In-capromab pendetide study including CT (left) and SPECT images reconstructed using FBP (middle) and using 40 iterations of MLEM with correction for photon attenuation and collimator response (right). Images show ROIs to differentiate radioactivity concentration in bone marrow and in soft-tissue regions.
DISCUSSION
The dual-modality SPECT/CT system facilitates anatomic localization of the SPECT and CT data in comparison with techniques that register images obtained from 2 separate systems. Our methodology also uses the correlated patient-specific CT data to correct the SPECT data for photon attenuation and depth-dependent collimator response. Though corrections for both photon attenuation and depth-dependent collimator response for SPECT have been reported by other investigators (7, 8, 12, 13, 18), this project developed a technique to estimate the body-contouring motion of the SPECT system to facilitate the correction of the depth-dependent collimator response in the SPECT reconstruction. We have found that corrections for both photon attenuation and the depth-dependent collimator response are important to improve both the visual quality (Fig. 7) and the quantitative accuracy (19) (Fig. 4) of any SPECT studies, especially for imaging high-energy radionuclides or when the size of the target approximates the spatial resolution of the system.
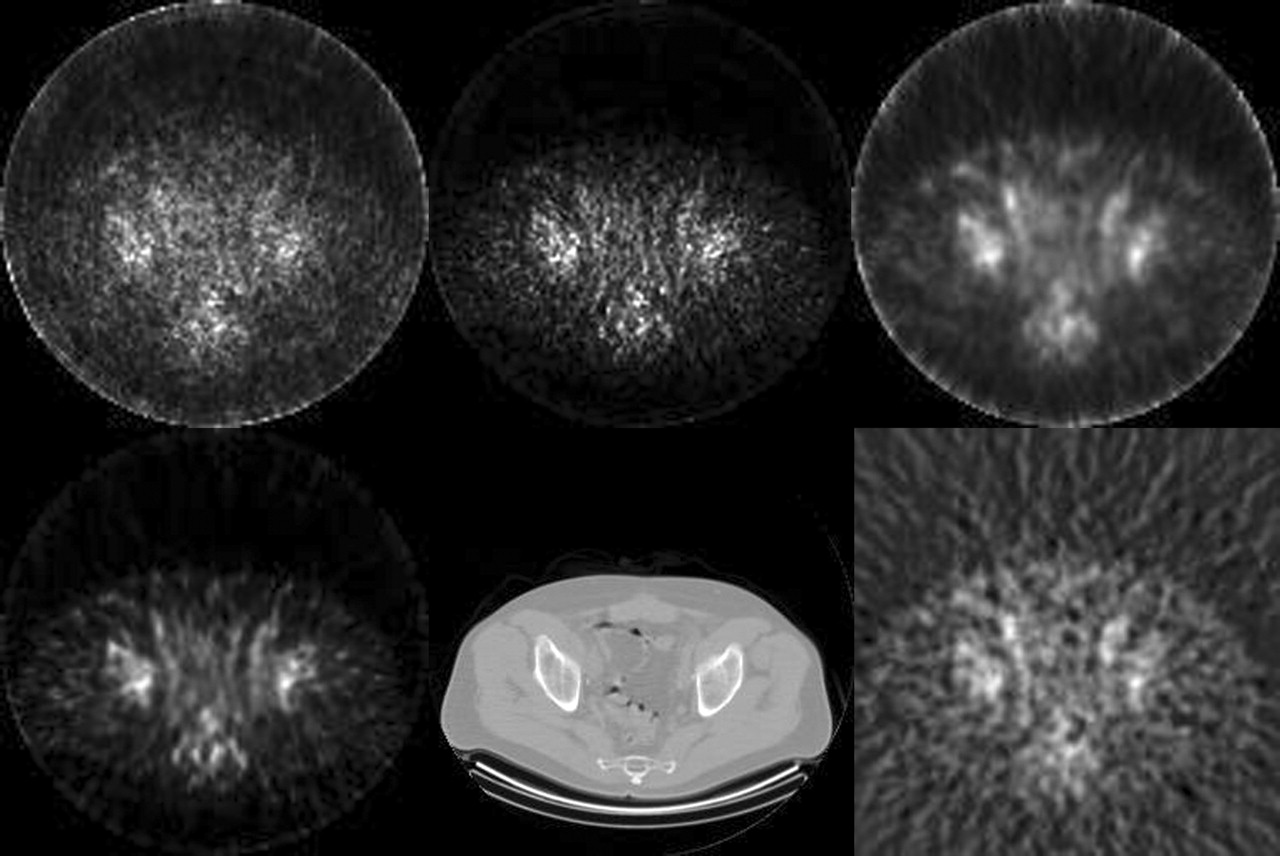
SPECT/CT images from clinical 111In-capromab pendetide study show SPECT images reconstructed using MLEM without photon attenuation and collimator response corrections (10 iterations, top left), using MLEM with photon attenuation correction only (15 iterations, top middle), and using MLEM with collimator response correction only (20 iterations, top right), using MLEM with corrections for both photon attenuation and collimator response (40 iterations, bottom left), and with FBP (bottom right). Corresponding CT image is shown at bottom middle.
One caveat of our studies is that we used published narrow-beam values for linear attenuation coefficients for generating attenuation maps, whereas the SPECT data were acquired with a broad-beam geometry. In addition, we did not use any explicit scatter correction in our MLEM reconstruction algorithms. However, our reconstructed images did not show any signs of overcorrection that might be expected by performing attenuation correction with an attenuation map containing narrow-beam versus broad-beam attenuation coefficients. Similarly, our SPECT images did not show any significant artifacts due to the absence of scatter correction. We are uncertain why the lack of scatter correction did not result in any apparent artifacts in our data and intend to explore this issue in future studies.
CONCLUSION
We performed phantom and preliminary clinical studies of 111In-capromab pendetide imaging with a commercially available dual-modality SPECT/CT system and a novel SPECT iterative reconstruction method. The correlated CT scan was used to produce a patient-specific attenuation map that accounts for the dual-photon nature of the 111In spectrum and also was used to define the body outline so that the geometric response of the collimator could be corrected in SPECT data acquired with body contouring. Using the techniques presented in this article, a SPECT/CT system, such as the GE Discovery VH Hawkeye, is capable of improving the visual quality of 111In-capromab pendetide SPECT images for prostate cancer detection and staging in comparison with a stand-alone SPECT system using conventional reconstruction algorithms.
Acknowledgments
The authors gratefully acknowledge expert technical advice from Aharon Peretz and Eyal Shai at GE Healthcare Global Nuclear Medicine and from Barbara Rogers and John Wolodzko at Cytogen Corp. This work is supported by the National Cancer Institute (grant R21 CA86893), the University of California Industry–University Cooperative Research Program (grant bio 02-10296), and GE Healthcare.
Footnotes
Received Apr. 13, 2004; revision accepted Dec. 15, 2004.
For correspondence contact: Youngho Seo, PhD, Department of Radiology, University of California, San Francisco, 185 Berry St., Suite 350, San Francisco, CA 94107-1739.
E-mail: youngho.seo{at}radiology.ucsf.edu
REFERENCES
In this issue


Jump to section
Related Articles
Cited By...
- Influence of a Headrest on Reconstruction and Attenuation Correction of Human Brain SPECT Images
- SPECT-CT: applications in musculoskeletal radiology
- In Vivo Tumor Grading of Prostate Cancer Using Quantitative 111In-Capromab Pendetide SPECT/CT
- SPECT/CT
- SPECT-Guided CT for Evaluating Foci of Increased Bone Metabolism Classified as Indeterminate on SPECT in Cancer Patients