


Abstract
PET with 18F-FDG may be useful for quantifying neutrophilic activation. We previously demonstrated that pulmonary neutrophil sequestration could be detected during acute lung injury (ALI), even without migration into the alveolar compartment. Using the influx constant Ki as the method to quantify lung 18F-FDG uptake, we also showed that Ki correlated positively with in vitro assays of 3H-deoxyglucose (3H-DG) uptake in cells harvested via bronchoalveolar lavage. In the present study, we have reanalyzed data from that study to determine if simpler nonkinetic methods of quantifying the pulmonary uptake of 18F-FDG could be as powerful as calculating Ki. Methods: 18F-FDG uptake was quantified as Ki, calculated by 3-compartmental model analysis (used as the gold standard) and Patlak graphical analysis, with and without normalization for initial volume of tracer distribution; the standardized uptake value; and the tissue-to-plasma activity ratio (TPR). Results: Values for Ki, determined either from a 3-compartmental model analysis of the time–activity data or by Patlak graphical analysis, were highly correlated (R2 = 0.97). The correlation was worse if these variables were normalized for the initial volume of tracer distribution. TPR was highly correlated with Ki determined by the compartmental model (R2 = 0.96) and with in vitro measurements of 3H-DG uptake (R2 = 0.63). Conclusion: The TPR is a simple and equally effective alternative to dynamic imaging in determining net 18F-FDG uptake during ALI. Normalization of the kinetic data for differences in the initial volume of tracer distribution does not contribute significantly to signal interpretation during ALI.
In recent years, PET imaging with 18F-FDG has become a mainstay for the diagnosis and management of cancer. However, potential new applications for 18F-FDG PET imaging continue to be explored, including a role in inflammation imaging (1,2). Using a visual assessment of 18F-FDG uptake, several recent studies have shown that 18F-FDG PET imaging may be useful in detecting inflammation due to infection (3–5). Other studies suggest that although quantitation may not be necessary for distinguishing infectious foci from malignant lesions (6), it may enable differentiation of acute from chronic active infectious lesions (7).
Recently, we showed that 18F-FDG PET imaging may be a useful tool to study the kinetics (onset, magnitude, duration) of neutrophilic activation during acute lung injury (ALI) (8). In that study, the lung uptake of 18F-FDG, quantified as the influx constant Ki (calculated by Patlak graphical analysis) (9,10), was used to detect the sequestration and influx of activated neutrophils into the lungs during ALI. In addition, we showed that neutrophil activation, not nonspecific leak of 18F-FDG into the air spaces, was the primary determinant of the imaging signal.
The issue of how best to quantify 18F-FDG PET uptake in the lungs is important because basal uptake of glucose by the lungs, compared with other organs such as heart and brain, is very low, and a significant portion of the lung activity simply represents activity within the pulmonary blood pool. These conditions make it difficult to identify changes in pulmonary uptake of 18F-FDG visually. No studies to date, however, have systematically compared available methods of quantifying 18F-FDG PET imaging during acute inflammation or ALI.
Compartmental modeling of time–activity data obtained during 18F-FDG PET imaging—generally considered the gold standard against which other methods are compared (11–13)—can be used to estimate rate constants that define the movement of 18F-FDG between the blood and tissue compartments. An analysis of these data may also allow one to determine which steps limit the rate of 18F-FDG uptake into a specific tissue (11).
A simplified but related method is the graphical analytic approach originally described by Patlak et al. (9,10). This method allows one to calculate the overall net rate of 18F-FDG uptake (often referred to as the net influx constant Ki). Patlak analysis, however, depends on certain assumptions being met, including equilibrium being reached between the blood and tissue compartments and complete entrapment of the tracer without loss (in this case, by de-phosphorylation) from the tissue region of interest (ROI) during the scan period.
The standardized uptake value (SUV) is perhaps the most widely used method of quantifying 18F-FDG tissue uptake in general, including studies of inflammation imaging (2). The SUV is simply the radioactivity measured in a tissue region corrected for the dose of radioactivity injected and for body mass. In a related approach, regional tissue activity can be normalized to blood activity at the time of the scan (14).
Finally, Jones et al. introduced the concept of correcting rates of 18F-FDG uptake in the lungs, as calculated by Patlak graphical analysis, for differences in the initial volume of distribution of 18F-FDG (15,16). The intercept component of the linear regression used to calculate the influx constant from a Patlak plot represents this initial volume of distribution in both the tissue and the blood. Such a correction could be especially relevant in the lungs because lung “tissue” on PET images includes air and blood as well as the parenchymal tissue itself. Changes in density due to atelectasis, pulmonary edema, or inflammatory recruitment of cells might therefore alter the volume of distribution of 18F-FDG and its subsequent rate of uptake.
The purpose of this study, then, was to compare these various methods for quantifying 18F-FDG uptake in the lungs against the gold standard of compartmental modeling, specifically in the setting of ALI.
MATERIALS AND METHODS
The animal preparation, study design, and implementation of these experiments has been described in detail elsewhere (8) and will be described briefly here. The main focus of this study is a reanalysis of the imaging data as a comprehensive comparison of different approaches to quantifying the uptake of 18F-FDG into the lungs during ALI.
Animal Preparation and Experimental Groups
The protocol for these studies was approved by the Animal Studies Committee at Washington University School of Medicine. Studies were performed on 24 healthy adult male mongrel dogs. Animals were divided into 4 groups: (a) a normal control group that received no experimental interventions (n = 5), (b) a group with lung injury induced by 0.08 mL/kg of oleic acid (OA) diluted in 1.5 mL of 70% ethanol (OA group, n = 6), (c) a group treated with 15 μg/kg of endotoxin (Etx) (Etx group, n = 6), and (d) a group with lung injury induced by OA preceded by treatment with the same dose of Etx (Etx+OA group, n = 7). The injury model was implemented by giving either Etx or placebo intravenously first, followed 30 min later by either OA or placebo. Animals were sedated using an intravenous pentobarbital sodium infusion, intubated, and mechanically ventilated with a Harvard pump respirator using a tidal volume of 15 mL/kg and a fraction of inspired oxygen (Fio2) of 1.0. An intravenous catheter was placed in the femoral vein for drug and radionuclide administration.
PET Data Acquisition
The same scanning protocol was used in all animals. All data were acquired using 2-dimensional mode on an ECAT EXACT HR+ scanner, and all images were reconstructed using filtered backprojection. Scatter correction was performed by deconvolving the measured projection data using a spatially invariant kernel (17); scatter contribution to the data was negligible. A 15-min attenuation scan was done initially, 1.5 h after experimental treatments were initiated, with placement of the animal such that the most caudal slice was approximately at the dome of the diaphragm. After completing the transmission scan, the following scans were obtained:
Blood volume (BV) was determined using 15O-labeled CO (C15O). The animal was disconnected from the ventilator, and ∼1,480 MBq (∼40 mCi) C15O were administered via a bag respirator in 2 breaths through the endotracheal tube. Two minutes later, a 5-min scan was performed.
Lung water concentration (LWC) was determined using 15O-labeled water (H215O) by methods previously described (8). A 5-min scan was performed 3 min after intravenous injection of ∼1,665–1,850 MBq (45–50 mCi) H215O to allow equilibration of the radiolabeled water between the lung tissue and blood compartments.
18F-FDG (181 ± 19 MBq [4.9 ± 0.5 mCi]) was injected intravenously at the start of a 58-min period of dynamic scan acquisition with the following protocol: twenty 5-s, six 30-s, six 60-s, four 120-s, and eight 300-s imaging frames. One-milliliter blood samples were drawn manually from a pulmonary artery catheter according to the following schedule: every 30 s for the first 2 min, every minute for the next 8 min, every 5 min for the next 20 min, then every 10 min for the remaining 30 min, with 2 blood samples drawn at the end of the scan. Activity in 200 μL of the plasma portion was measured in a γ-counter calibrated to the PET scanner. The data from these samples were used to determine the input function for compartmental modeling of the 18F-FDG time–activity data and for the Patlak graphical analysis.
PET Data Analysis
ROIs were drawn on 5 slices (slice thickness = 0.24 cm, spaced 0.95 cm apart) of the PET scans, using the transmission and lung water scans to define the lung borders (8). These ROIs were then used for all analyses.
The SUV was calculated from activity data obtained during the last frame of the 18F-FDG scans as:
 Eq. 1
Eq. 1
The tissue-to-plasma activity ratio (TPR) was calculated by dividing the tissue activity data during this same last imaging frame by the radioactivity in the plasma determined from the mean of 2 blood samples obtained at the end of that frame period.
The Patlak influx constant (Patlak Ki) was obtained from a plot constructed from an area-weighted average of activity in the ROIs and the activity of 18F-FDG in plasma, measured from blood samples. Linear regression was performed on all data points after 10 min of scanning with visual confirmation of linearity. All regressions had a correlation of determination (R2) of 0.92 or greater. Ki was calculated from the slope of the equation generated by the regression. Examples of Patlak curves from these experiments are presented elsewhere (8). The following equation was used to construct the Patlak plots and to generate the linear regressions:
 Eq. 2 where CT(t) and CA(t) are, respectively, tissue and blood radioactivity at each sample time point (t); τ is the integration variable; Ki is the Patlak influx constant; and Int is a parameter representing the initial volume of distribution of the tracer in both the tissue and blood (the intercept when plotted graphically).
The Patlak Ki was expressed simply as Ki and as Ki normalized for the initial volume of distribution (Ki/Int).
The kinetics of 18F-FDG uptake in the lungs were also analyzed with a standard 3-compartmental model using nonlinear regression (18), where K1 is the forward rate constant between the blood and tissue compartment, k2 is the reverse rate constant between the same 2 compartments, and k3 is the rate constant representing trapping of 18F-FDG intracellularly after phosphorylation by hexokinase. Model parameters were obtained by fitting the experimental time–activity data to the following equation:
 Eq. 3 where α2,1 = 1/2(k2 + k3 + k4 ± ≪(k2+k3+k4)2−4k2k4), ⊗ is the convolution operator, BV is the estimated blood volume component, and K1, k2, k3, and k4 represent the individual rate constants.
It was assumed that dephosphorylation in the lungs is negligible over the 1-h scanning period, so k4 was set to 0 and dropped from the equation. K1, k2, k3, and BV were then estimated by nonlinear regression using 0.04, 0.04, and 0.03 as initial estimates for the rate constants.
The influx constant Ki was also calculated from the compartmental model (CM) rate constants (9,19) as follows:
 Eq. 4
Eq. 4
The rate constants can also be used to estimate a tissue volume of distribution for the 18F-FDG tracer (9,19), as follows:
 Eq. 5
Eq. 5
The compartmental model estimate of the BV was added to Vt to give the compartmental model equivalent of the Patlak intercept (9):
 Eq. 6
Eq. 6
Extravascular lung water (EVLW) was calculated by the following equation (20):
 Eq. 7 where LWC is the total lung water concentration obtained from the H215O scan, BV is BV measured by the C15O scan, and 0.84*BV is the concentration of water in the intravascular space.
Biologic Markers
After PET data acquisition, bronchoalveolar lavage (BAL) was performed by wedging a bronchoscope in a distal segment of the lung, instilling 30 mL of normal saline, and aspirating the fluid using low wall suction, sampling 2–4 different segments in each animal. Aspirated fluid was pooled and used to determine the in vitro 3H-deoxyglucose (3H-DG) uptake. Cells from BAL fluid were simply washed with phosphate-buffered saline (PBS) and then resuspended in Krebs–Ringer phosphate (KRP) buffer before assaying for 3H-DG uptake. Neutrophils from blood samples taken before initiation of experimental interventions were purified as previously reported (8).
The 3H-DG uptake assay was performed as previously described (8). Briefly, all cell pellets were washed 3 times with KRP buffer and then divided into tubes containing 5 × 10⁵ cells per tube. One tube in each sample group was preincubated with cytochalasin B, an inhibitor of glucose uptake, to determine background 3H-DG uptake. All tubes were then incubated with 37 kBq 3H-DG at 37°C for 6 min and then spun down immediately at 4°C and washed with ice-cold KRP buffer 3 times. Cells were then lysed with PBS with 1% Triton X-100, cell debris was spun down, and supernatant was collected for scintillation counting and for assaying for amount of protein using the bicinchonic acid protein assay (Pierce Technology). Results from the 3H-DG uptake assay could be compared with PET data in only 3 of 6 dogs in the OA group and 3 of 7 dogs in the Etx+OA group, due to either insufficient cells for analysis in the BAL (6 cases) or incomplete (i.e., <1 h) PET data (1 case). The data were expressed as pmol/mg protein/min. The data from BAL cells were corrected for the percentage of neutrophils.
Statistical Tests
Group data are expressed as the mean ± SD. Standard 1-way ANOVA tests were used to compare results among groups if data were normally distributed. Post hoc comparisons were done using the Holm–Sidak method. For non-normally distributed data, ANOVA was performed by the Kruskall–Wallis test on ranks, and subsequent post hoc comparisons were performed by the Dunn method. Statistical significance was set at P < 0.05. Sigma-Stat version 3.0 (SPSS, Inc.) was used for statistical testing. Nonlinear regression analyses were performed using the Levenberg–Marquardt optimization method and residuals plotted to determine goodness of fit. Bland–Altman plots were constructed to compare how well Patlak Ki values agreed with the compartmental model estimates (21).
RESULTS
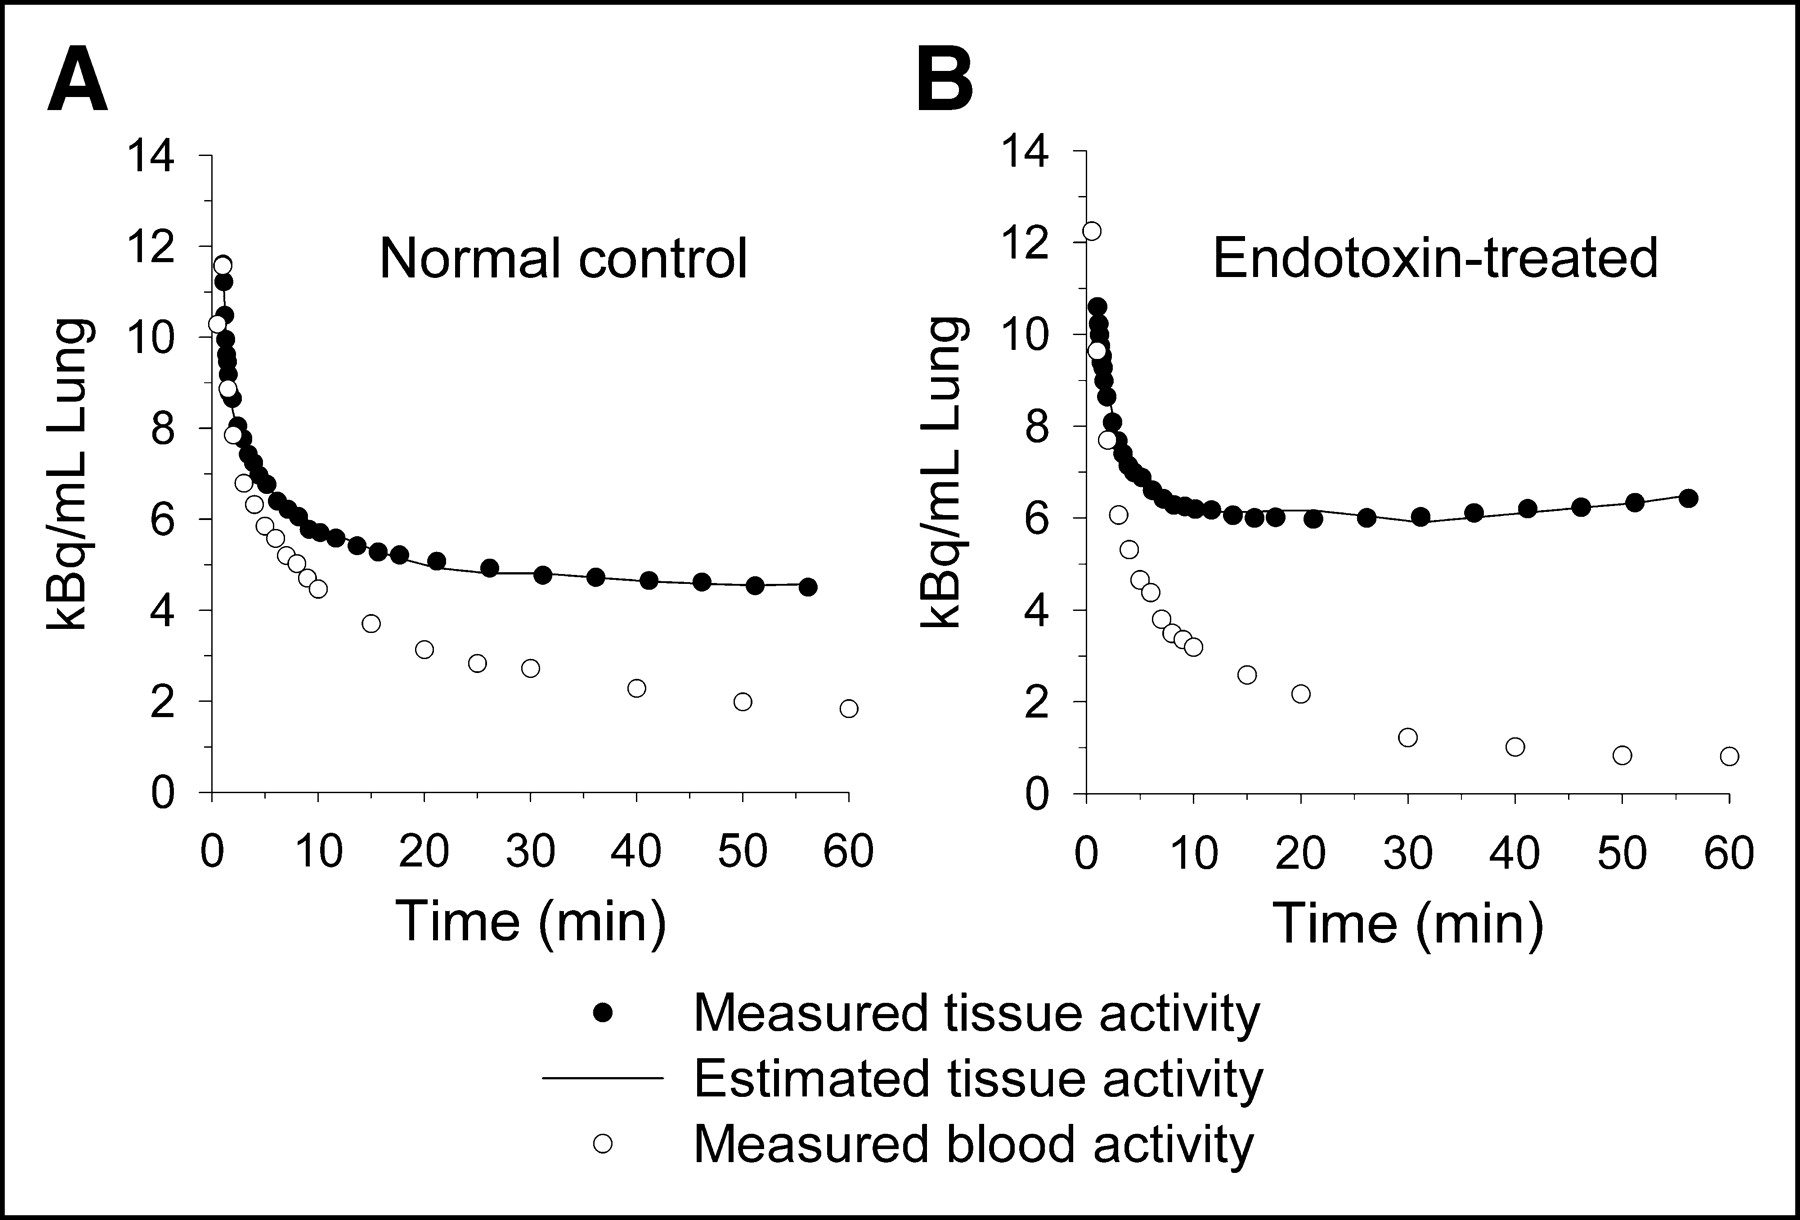
Examples of time–activity data and the associated compartmental model fits from representative animals in the normal control and Etx-treated groups are shown in Figure 1. Values for the rate constants computed from the compartmental model are shown in Table 1. In general, the highest values for K1 and k3 were found in animals exposed to Etx. The highest mean value for K1 was in the Etx+OA group, which was statistically different from both the normal and OA groups. The highest mean value for k3 was in the Etx group. Mean values for k2 were not different from one another. For all data considered as a whole, K1 was a stronger determinant of Ki than k3 (Fig. 2).

Examples of residual plots from 3-compartmental model analyses. (A) Representative plot of 1 animal in normal control group. (B) Representative plot of 1 animal in Etx-treated group. Plasma activity curve shows activity measured in plasma from direct blood sampling multiplied by fractional BV estimated by compartmental model.

Correlations of rate constants K1 (mL blood/mL lung/min; A) and k3 (min−1; B) estimated by 3-compartmental model with calculated influx constant, Ki (mL blood/mL lung/min), from compartmental model. K1 represents transport of 18F-FDG from vascular space into intracellular space, and k3 represents hexokinase activity (“trapping” of 18F-FDG within cell).
Compartmental Model Rate Constants
Ki calculated from the estimated rate constants by compartmental modeling was highly correlated with the values of Ki calculated by Patlak analysis (Fig. 3A). A Bland–Altman plot of the Ki values (Fig. 3B) shows that there is a tendency for Patlak analysis to slightly overestimate Ki compared with the compartmental model analysis, primarily at the lower range of measured values.

Comparisons of influx constant Ki (mL blood/mL lung/min) calculated by compartmental modeling and Patlak graphical analysis, before and after normalization for initial 18F-FDG volume of distribution (int, mL/mL lung). (A) Correlation of Ki computed by the 2 methods. (B) Bland–Altman plot compares calculation of Ki values. (C) Correlation of Ki after normalization. (D) Bland–Altman plot compares normalized Ki values. Solid line shows mean value of difference in Ki estimated by the 2 methods.
Mean values for Ki both by compartmental modeling and by Patlak analysis, before and after normalization with the computed or measured intercept, are given in Table 2. Again, in general, values for normalized Ki were highest in the groups exposed to Etx. The intercept values themselves, by either method, were highest in the Etx+OA group and lowest in the normal group (Table 2). Values in the other groups were intermediate. However, the correlation between normalized Ki by the 2 methods was worse than that without the intercept correction (Fig. 3C), and though there was a tendency for the Patlak analysis to slightly overestimate normalized Ki again at lower values, there was also a tendency to underestimate the normalized Ki at the higher range of measured values (Fig. 3D). The correlation of normalized Ki to 3H-DG uptake was also worse (R2 = 0.48; data not shown) when compared with our previously reported results (8).
Comparison of Compartmental Model and Patlak Estimates of Ki, With and Without Intercept Correction, and TPR
As noted earlier, the intercept measured from the Patlak regression analysis is equivalent to the tissue volume of distribution (Vt) computed from the rate constants plus the estimated BV. These variables are compared in Table 3. There was no statistically significant difference for the mean values among the experimental groups either for the estimated pulmonary BV from the compartmental analysis or for BV measured from the C15O scan. In contrast, both Vt (estimated from the compartmental model analysis) and EVLW (calculated from the lung water and BV scans) were highest in the groups that developed lung injury after being exposed to OA. There was no statistically significant difference in the mean values of either variable in the Etx group versus the normal group. The Patlak intercept was strongly correlated with the calculated intercept from the compartmental model (Fig. 4A) and was more strongly correlated with Vt (R2 = 0.67; data not shown) than with the compartmental model estimate of BV (R2 = 0.30; data not shown). Furthermore, Vt and EVLW were positively and significantly correlated to one another (Fig. 4B).

Correlations of initial 18F-FDG volume of distribution in tissue (Vt) and blood (BV) calculated by compartmental model (CM intercept = Vt + BV) and Patlak graphical analysis and primary determinants of distribution space. (A) Correlation of CM intercept and intercept determined from Patlak linear regression. (B) Correlation of EVLW and Vt.
Comparison of Components of Compartmental Model Intercept with Independently Measured PET Variables
Mean SUVs were calculated for each group. The mean SUV for the Etx+OA group (1.08 ± 0.15) was significantly higher when compared with all 3 other groups (P < 0.05). The mean SUV for the OA group (0.69 ± 0.11) was also significantly higher when compared with the normal group (0.45 ± 0.92; P < 0.05). The mean SUV of the Etx group (0.61 ± 0.18) was not statistically different from the OA or normal control groups. There was a weak correlation between SUV and the Ki estimated by the compartmental model (Fig. 5). However, there was no statistically significant correlation between SUV and Ki normalized by the intercept correction by either method (unlike the modest correlation shown in Fig. 5 for the uncorrected Ki).
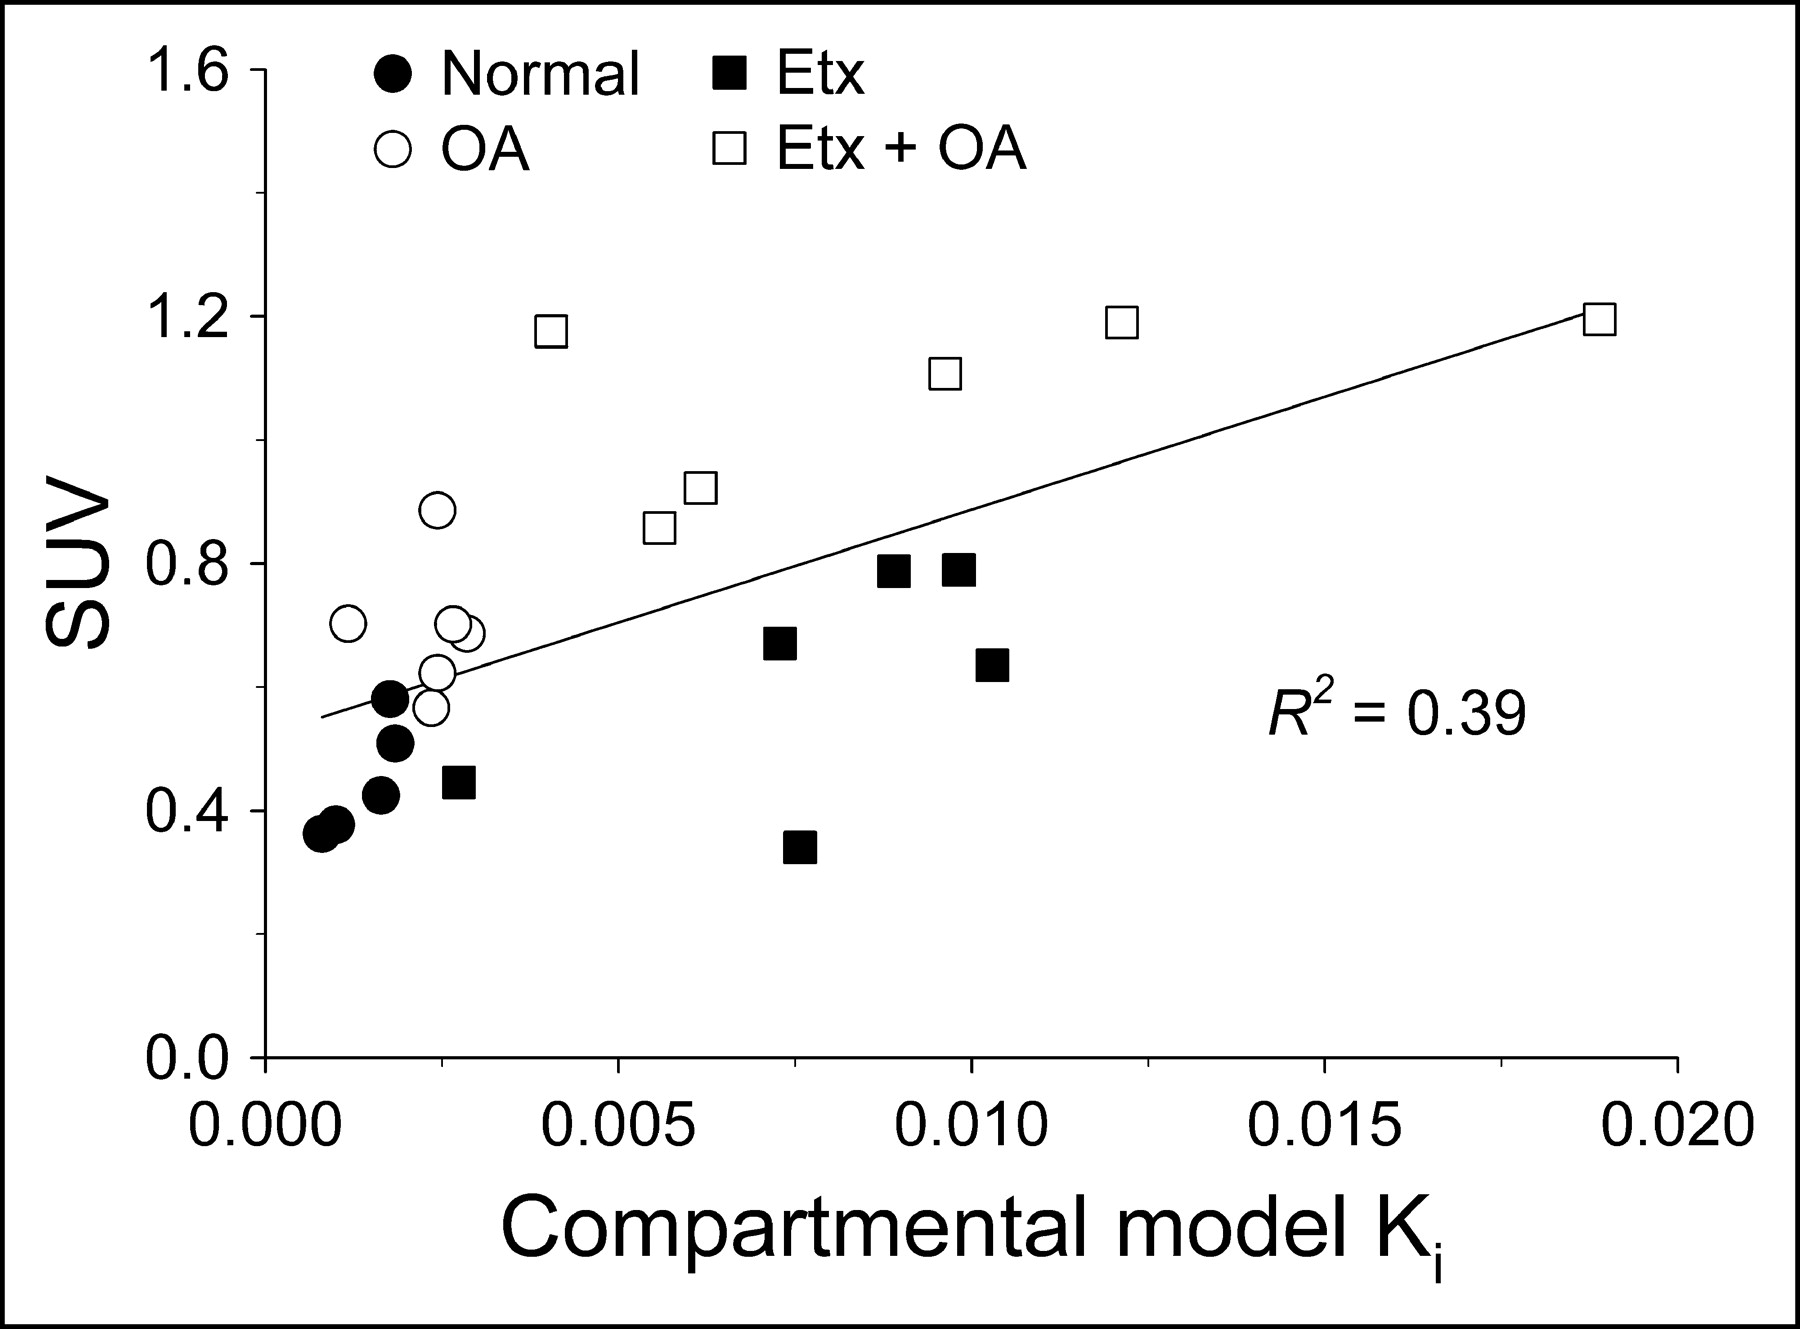
Correlation between influx constant Ki (mL blood/mL lung/min) calculated by compartmental model and SUV.
Mean TPR values for each group are shown in Table 2. The mean values in the Etx+OA and Etx-only groups were statistically higher than that in the normal control group. TPR was highly correlated with the compartmental model estimate of Ki (Fig. 6A) and was also positively correlated with 3H-DG uptake in neutrophils harvested from the BAL fluid (Fig. 6B).
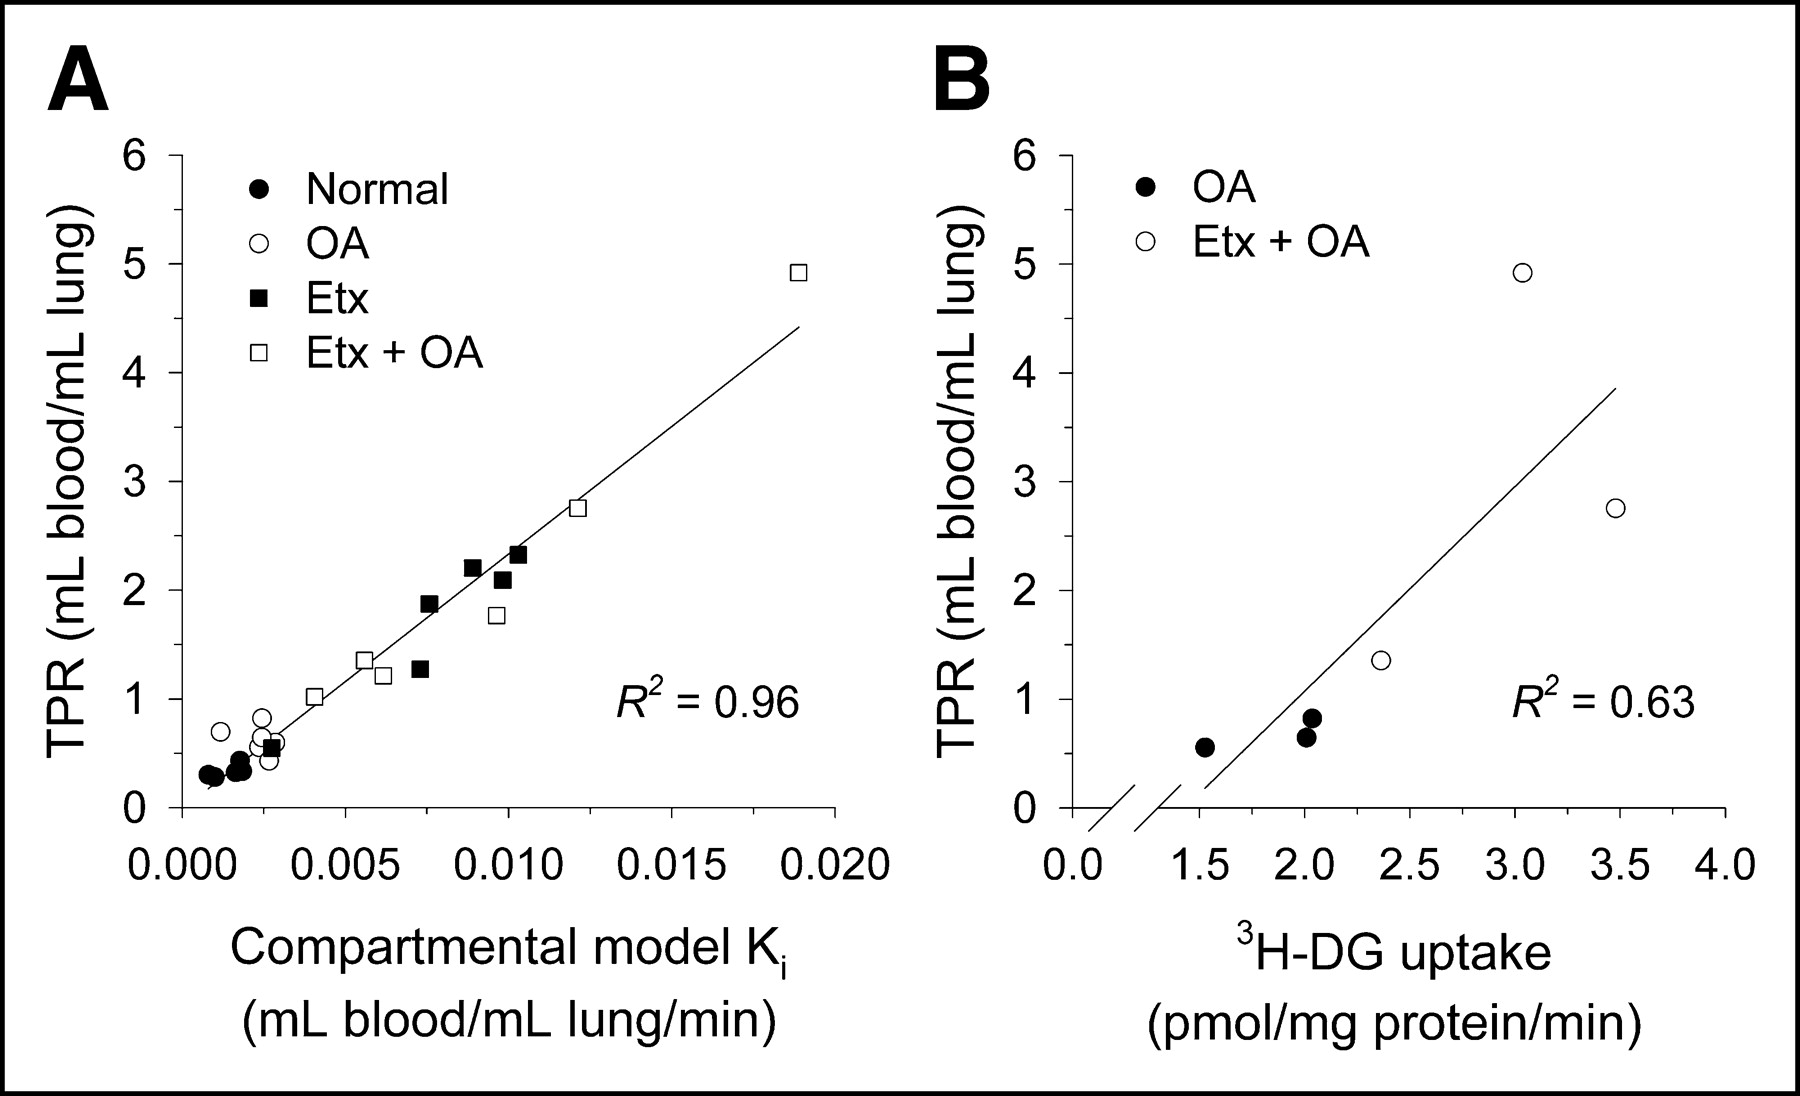
Correlation of TPR estimates to influx constant Ki (mL blood/mL lung/min) and in vitro measures of 3H-DG uptake. (A) Correlation of TPR with compartmental model-estimated Ki. (B) Correlation of TPR with in vitro 3H-DG uptake.
DISCUSSION
We used compartmental modeling of the PET and blood time–activity data as the gold standard against which the different analytic methods were compared (11–13). We found that, in the current studies, modeling produced excellent fits to the observed data (Fig. 1).
The net uptake of 18F-FDG into a tissue is often summarized as the “net influx rate constant” Ki. This constant can be computed from either the compartmental model rate constants or by a graphical approach first reported by Patlak et al. (9,10). In this study, we found that the 2 methods of computing Ki correlated strongly (Fig. 3). We take this observation to indicate that the assumptions underlying the use of the Patlak approach to computing Ki are valid under our experimental conditions. As such, they strengthen the inferences drawn in our previous report concerning differences in the rate of 18F-FDG uptake among the experimental groups (8).
In that report, the principal finding was that Ki increased significantly in animals exposed to Etx compared with normal animals or those exposed only to OA injury. Independent in vitro measurements of the rate of 3H-DG uptake on cells recovered from the lungs not only supported these findings but also showed that the primary cell source of the imaging signal was the neutrophil. Thus, we interpreted the Ki measurements to indicate that the increased rate of 18F-FDG uptake seen in animals exposed to Etx was primarily a function of neutrophil activation with pulmonary sequestration or infiltration into the lungs, and not from nonspecific leak of the tracer into the alveolar air spaces in the presence of ALI.
Our inferences would have been different had we adopted alternative forms of quantifying the time–activity data. For example, if we had based our interpretations on the SUV, we would have concluded that the PET signal was primarily due to the effect of OA on the lungs, implying that the combination of FDG leaking into the air spaces and inflammatory cell recruitment in response to lung injury contribute equally to the generation of the PET signal. This is clearly a different result from data obtained by compartmental modeling (Table 2).
As another example of how interpretation can be affected by the method of quantitation, Jones et al. measured the rate of 18F-FDG uptake in the lungs as Ki normalized for potential differences in the initial volume of distribution. They did this by dividing Ki by the intercept value of the linear regression used to compute Ki from the Patlak graphical approach (15,16). Presumably, the basis for their rationale in using this procedure is that the lungs, unlike other organs, can vary greatly in their tissue density. These changes in lung density could be due to atelectasis, pulmonary edema, recruitment of inflammatory cells, or some combination of these. Thus, the initial volume of distribution for the tracer could also vary widely as a result.
Without some form of validation, however, it is not intuitively obvious that this correction to the Ki measurement is appropriate. In this study, we found that the correlation between the 2 methods of Ki was worse when normalization for the intercept was used than when it was not used. Likewise, the correlation of Ki after normalization with in vitro measures of 3H-DG uptake was worse with the intercept correction. These observations appear to indicate—in the context of these experiments involving ALI—that an intercept correction introduces additional variance into the data and is neither required nor useful.
Our analysis of the separate components of the intercept, derived from compartmental modeling, provides additional insight into why the intercept correction may not be valid in the current circumstances (i.e., during ALI). As noted in the Results, the Patlak intercept, representing Vt plus the BV, is dependent primarily on Vt (not the BV) in this model. As shown in Table 3 and Figure 4B, differences in Vt among the various experimental groups were primarily a function of changes in EVLW (i.e., pulmonary edema). Therefore, since changes in EVLW from pulmonary edema alone would not be expected to increase 18F-FDG trapping, an intercept correction would artificially lower the measured rate of 18F-FDG uptake. Determination of whether normalization of Ki with an intercept correction is appropriate in other pulmonary conditions associated with lung inflammation will require additional study.
The SUV is perhaps the most common method used to quantify 18F-FDG uptake. However, the SUV is influenced by factors such as the time period during which it is measured as well as the body mass (22). Accordingly, several corrections, such as standardizing the time of measurement and correcting the SUV for lean body mass or body surface area, have been proposed to reduce the dependency of the SUV on these factors (23,24). However, in the lungs and other tissues in which the rate of 18F-FDG uptake is normally low, these corrections have not been effective (25). Additionally, the correlation between SUV and Ki in the current study was weak (Fig. 5). Therefore, we concluded that the SUV is not adequate for quantifying 18F-FDG uptake during ALI.
As an alternative, Hunter et al. (14) proposed normalizing the tissue activity measurement at the end of the scanning period by dividing it by the measured activity in a single blood sample obtained during the time of the imaging measurement (calculating an equivalent of the TPR). They provided a theoretic justification for this approach and showed that the correlation of determination of this ratio with Ki in non–small cell lung cancer tissue was 0.98. Their findings were replicated by Krak et al. in patients with breast cancer (26). In further support of this approach, we also found that the 2 methods correlated strongly (Fig. 6A). Furthermore, TPR was linearly correlated with the in vitro measurement of 3H-DG uptake (Fig. 6B), which was equivalent to the correlation previously reported between Ki and 3H-DG (8).
These results have significant implications for the potential usefulness of 18F-FDG PET imaging to study the kinetics (onset, magnitude, and duration) of neutrophil activation in ALI. The TPR appears to be a valid measure of 18F-FDG uptake in the lungs during ALI. As such, this simplified procedure is clearly more feasible in critically ill patients than more extended scanning protocols to estimate Ki, reducing the amount of time these ventilated patients would need to be outside the intensive care unit environment. Additionally, it may be possible to calculate the TPR noninvasively by placing an ROI over the blood pool, such as in the left atrium, further simplifying the procedure (27).
Finally, if 18F-FDG PET imaging is to be used to study neutrophil kinetics during ALI, it will be important to understand the regulatory mechanisms underlying glucose uptake in neutrophils. Glucose and 18F-FDG both enter cells via one or more of the GLUT family of membrane transporter proteins (28,29). After phosphorylation by hexokinase, further metabolism of 18F-FDG is not possible, effectively “trapping” it within the cytoplasm. Whether changes in the activity of hexokinase or the expression of the GLUT transporters is primarily responsible for the increases in 18F-FDG uptake associated with Etx stimulation is not known. However, the data in Figure 2 suggest that net uptake may be more a function of transport than trapping per se. The possibility that the imaging signal during neutrophilic inflammation could be regulated by changes in GLUT transporter expression will need to be explored in future studies.
CONCLUSION
The results of this study indicate that, during ALI, the rate of 18F-FDG uptake in the lungs can be accurately estimated by use of the TPR. Normalization of the kinetic data with an intercept correction does not appear to be warranted.
Acknowledgments
This work was supported by grants from the National Institutes of Health (NIH). The authors thank Jim Kozlowski, Zhaohui Zhou, Matt Bernstein, Margaret Morris, Mark Nolte, and Linda Becker for technical assistance; Bill Margenau, Dave Ficke, and the cyclotron staff for isotope production; and Marie La Regina and her staff in the Division of Comparative Medicine for assistance with specimen processing. This research was funded by NIH grants HL32815 and T32 GM08795.
Footnotes
Received Dec. 28, 2003; revision accepted Mar. 4, 2004.
For correspondence or reprints contact: Delphine L. Chen, MD, Campus Box 8225, Washington University School of Medicine, 660 S. Euclid Ave., St. Louis, MO 63110
E-mail: chend{at}mir.wustl.edu
REFERENCES
In this issue


Jump to section
Related Articles
Cited By...
- High-Temporal-Resolution Kinetic Modeling of Lung Tumors with Dual-Blood Input Function Using Total-Body Dynamic PET
- Total-Body Multiparametric PET Quantification of 18F-FDG Delivery and Metabolism in the Study of Coronavirus Disease 2019 Recovery
- High-Temporal-Resolution Lung Kinetic Modeling Using Total-Body Dynamic PET with Time-Delay and Dispersion Corrections
- Molecular Imaging of Very Late Antigen-4 in Acute Lung Injury
- Consensus Recommendations on the Use of 18F-FDG PET/CT in Lung Disease
- Comparison of Static and Dynamic 18F-FDG PET/CT for Quantification of Pulmonary Inflammation in Acute Lung Injury
- Quantification of Lung PET Images: Challenges and Opportunities
- Lower Respiratory Tract Infection of the Ferret by 2009 H1N1 Pandemic Influenza A Virus Triggers Biphasic, Systemic, and Local Recruitment of Neutrophils
- Image-Derived Input Function for Assessment of 18F-FDG Uptake by the Inflamed Lung
- PET Imaging of Regional 18F-FDG Uptake and Lung Function After Cigarette Smoke Inhalation