


Abstract
The aim of this investigation was to evaluate the influence and accuracy of 18F-FDG PET in target volume definition as a complementary modality to CT for patients with head and neck cancer (HNC) using dedicated PET and CT scanners. Methods: Six HNC patients were custom fitted with head and neck and upper body immobilization devices, and conventional radiotherapy CT simulation was performed together with 18F-FDG PET imaging. Gross target volume (GTV) and pathologic nodal volumes were first defined in the conventional manner based on CT. A segmentation and surface-rendering registration technique was then used to coregister the 18F-FDG PET and CT planning image datasets. 18F-FDG PET GTVs were determined and displayed simultaneously with the CT contours. CT GTVs were then modified based on the PET data to form final PET/CT treatment volumes. Five-field intensity-modulated radiation therapy (IMRT) was then used to demonstrate dose targeting to the CT GTV or the PET/CT GTV. Results: One patient was PET-negative after induction chemotherapy. The CT GTV was modified in all remaining patients based on 18F-FDG PET data. The resulting PET/CT GTV was larger than the original CT volume by an average of 15%. In 5 cases, 18F-FDG PET identified active lymph nodes that corresponded to lymph nodes contoured on CT. The pathologically enlarged CT lymph nodes were modified to create final lymph node volumes in 3 of 5 cases. In 1 of 6 patients, 18F-FDG–avid lymph nodes were not identified as pathologic on CT. In 2 of 6 patients, registration of the independently acquired PET and CT data using segmentation and surface rendering resulted in a suboptimal alignment and, therefore, had to be repeated. Radiotherapy planning using IMRT demonstrated the capability of this technique to target anatomic or anatomic/physiologic target volumes. In this manner, metabolically active sites can be intensified to greater daily doses. Conclusion: Inclusion of 18F-FDG PET data resulted in modified target volumes in radiotherapy planning for HNC. PET and CT data acquired on separate, dedicated scanners may be coregistered for therapy planning; however, dual-acquisition PET/CT systems may be considered to reduce the need for reregistrations. It is possible to use IMRT to target dose to metabolically active sites based on coregistered PET/CT data.
- head and neck cancer
- PET
- radiotherapy targets
- nuclear medicine treatment planning
- conformal radiotherapy
Head and neck cancer (HNC) accounts for approximately 3% of all cancer cases reported in the United States, or roughly 50,000 cases per year (1). Radiation therapy will be used as part of the treatment in the majority of patients during the course of this disease. Effective immobilization techniques together with the relatively rigid nature of this anatomically complex region combine to create the ideal paradigm for examining the influence of nuclear medicine physiologic imaging on target volume definition. Furthermore, heterogeneity of tumor histology includes actively proliferating regions as well as ischemic centers, both of which may be significant for therapy planning.
Although treatment of HNC using external beam radiation has applications ranging from definitive irradiation of unresectable tumors, organ function preservation of resectable tumors, palliation of incurable local or metastatic disease, and adjuvant treatment for eradication of microscopic subclinical disease in the postoperative setting (2), this article addresses definitive irradiation with gross disease. Traditional conformal radiation treatment planning (CRTP) for HNC relies on 3-dimensional (3D) electron density imaging, such as CT, and to a lesser degree proton density imaging (3,4), to differentiate benign from malignant disease and for defining target edges and volumes relative to intervening or adjacent normal tissues (5). Recent advances in 3D nuclear medicine molecular imaging techniques are facilitating the transition of CRTP from a purely anatomic process to one where physiologic information is used to help define target volumes and also to determine regions requiring dose intensification (6–29). In this study, we performed a pilot study examining the influence of 3D PET nuclear medicine data on final target volume definition when initial target volumes are drawn based on conventional CT imaging.
Anatomic imaging techniques such as CT provide submillimeter longitudinal and transverse resolution and are therefore excellent for differentiating structural edges and normal organ and tumor boundaries. Localization of target tissues and optimization of treatment fields is typically determined based on visual interpretation of the anatomic data (30). Information on electron densities and tissue depths obtained from anatomic imaging are a necessary and essential part of both 2-dimensional and 3D dose calculation algorithms (31). However, the appropriateness of CT remains unclear when changes in tissue or tumor density may not be evident, diagnostic, or etiologically specific (32). Due to the increased risk of both normal tissue complications and incomplete target coverage with conformal techniques, quantitative (i.e., precise and accurate) localization of gross target volume (GTV) is especially critical when considering dose escalation in the context of CRTP and, in particular, in intensity-modulated radiation therapy (IMRT). For example, in the case of prostate cancer dose intensification using IMRT techniques, target volume total doses in excess of 86 Gy may be obtained without excess bladder or rectal toxicity with accurate target definition (33). Although CRTP for HNC based on anatomic imaging is a well-established approach to this disease with proven results (34), there is a growing eagerness in radiation oncology to include molecular or functional imaging data, such as PET, in the staging and treatment planning processes to further improve radiation outcomes.
A recent literature survey on the use of 18F-FDG PET in HNC indicates that when compared with CT, PET has a higher sensitivity (87% vs. 62%) and specificity (89% vs. 73%) for staging cancer, higher sensitivity (93% vs. 54%) and specificity (83% vs. 74%) for imaging recurrence, and higher sensitivity (84% vs. 60%) and specificity (95% vs. 39%) for monitoring the effects of therapy (35). Published results involving other cancer sites (e.g., lung) have shown that PET imaging modified patient management in 20%–30% of the cases studied (35). In addition to these region-specific investigations, whole-body PET imaging for cancer staging is becoming more commonplace as a means to assess lymph node involvement and differentiate benign and malignant tissues (36). Several retrospective studies—for example, that by Schmidt et al.—have reported that the information from PET imaging influences radiotherapy planning by providing novel data on cancer extent and location (37).
When combined with CT, the simultaneous display of PET and anatomic CT image data facilitates an unambiguous localization of 18F-FDG tracer relative to bony anatomy and internal organs and structures. Commercial software for coregistering PET and CT data acquired on separate, dedicated imaging systems is becoming more commonly available and several vendors now offer this option. Although combined high-resolution PET/CT scanners are now commercially available from several manufacturers, purchase of this new scanner type may not be a financial option for some centers. Recent work with medical imaging phantoms at Vanderbilt has shown that the information provided from 18F images acquired on a separate, dedicated PET scanner may influence GTV definition and, therefore, radiation dose distribution using both conformal and IMRT techniques (38).
In this work, image data from 6 HNC patients are analyzed to determine the impact of coregistered 18F-FDG PET and CT data on final target volumes for IMRT. There are 3 scenarios for which 18F-FDG PET imaging may influence the GTV or number of GTVs: (a) the target is not distinguishable on CT but is distinguishable on PET; (b) the target is identifiable on CT, however, additional hypermetabolic PET regions extend outside the CT volume; and (c) hypermetabolic PET foci appear as subregions within the CT-defined volume. Physiologic PET imaging may also influence patient staging by identifying distant metastases. The impact of these scenarios on GTV definition is examined in this study.
MATERIALS AND METHODS
Patient Population
Before their PET and their planned course of radiation therapy, 6 HNC patients (3 male, 3 female) were selected for inclusion in this study. The average patient age was 59.5 y, with a range from 41 to 83 y. Table 1 contains the demographics for this study group as well as information on chemotherapy history and total treatment dose.
Patient Demographics, Chemotherapy History, and Total Treatment Dose
CT Simulation
Before CT imaging, each patient was custom fitted with a Uni-frame head and neck immobilization system (MED-TEC Inc.) and Vac-lok patient positioning cushion (MED-TEC Inc.). Routine CT simulation was performed in the radiotherapy department using a Picker PQ 5000 scanner (Picker International). Reproducible head and shoulder position was ensured using the Uni-frame and Vac-lok fixation devices. CT simulation consisted of a series of transverse views (512 × 512 acquisition matrix, 1.5-mm slice thickness) from the apex of the skull to the mediastinal region. Three patient alignment lasers (Gammex RMI) located in the CT simulator were used to mark the isocenter for radiotherapy planning and for accurate reproducibility of treatment position. Image data from the CT scanner were transferred to a Picker AcQsim virtual simulator (Picker International) where a marked isocenter was added before transferring the data to the planning virtual simulator (AdvantageSim Workstation [AW]; General Electric Medical Systems) for target contouring and coregistration with the PET data.
PET Imaging
All nuclear medicine studies were performed on a dedicated, high-resolution PET scanner (General Electric Medical Systems) usually on the same day as the CT simulation. Each patient underwent at least 4 h of fasting with clear liquids before the procedure. Serum glucose levels were also measured before 18F-FDG administration to document euglycemia. Positron imaging consisted of both transmission and emission studies. The PET emission images were acquired 45–60 min after intravenous administration of 370 MBq (10 mCi) 18F-FDG. During the distribution phase the patients were lying supine in a quiet room. To obtain nearly identical patient positioning between CT and PET studies, the same immobilization devices as used during CT simulation (i.e., Uni-frame, Vac-lok) as well as a flat-panel carbon fiber composite table insert (MED-TEC) were also used for the PET acquisition.
In the PET imaging protocol, both emission and transmission images were obtained over the head, neck, chest, abdomen, and pelvis. Raw, list-mode projection data were postprocessed using a Hanning filter and reconstructed (128 × 128 × 64 reconstruction matrix, 3.56-mm pixel size, 4.25-mm slice thickness) using vendor-supplied ordered subset-expectation maximization with the option for attenuation correction and designed for coincidence data (CoOS-EM) (General Electric Medical Systems). Both emission and transmission 18F-FDG PET images with and without attenuation correction were reviewed on an interactive computer system with use of a linear gray scale and a continuous color scale with varying degrees of background subtraction. A nuclear medicine physician with expertise in PET imaging visually interpreted the 18F-FDG PET studies. Areas of 18F-FDG uptake were categorized as malignant based on location, intensity, shape, and size and visual correlation with CT images to differentiate physiologic from pathologic uptake.
Image Registration
Anatomic CT and PET emission and transmission image datasets were transferred via electronic network to the AW virtual simulator for alignment and subsequent contouring. All 3 image sets were loaded into the PET/CT Fusion Program, which exists on the AW virtual simulator. This software module registers the CT and emission PET data by first aligning anatomic details between the PET transmission scan—which is essentially comparable to a low-resolution CT image—and the CT data. The PET transmission and emission image datasets form a registered pair by definition. Thus, the resulting transformation matrix was then applied to the PET emission data for coregistration to the CT. At the start of the image coregistration process an initial point of reference (e.g., tip of nose) is chosen in the CT image and a corresponding point is chosen in the PET transmission image. Segmentation and surface-rendering criteria were then used to perform an initial coregistration based on this one starting point. After this first-pass registration, a minimum of 3 additional points were chosen in both the CT and the PET image sets (either transmission or emission) to fine-tune the coregistration. For this study the average number of points used was 6 (range, 5–8). If, after coregistration, 18F-FDG uptake did not correspond to an area on CT that would be metabolic—for instance, in air spaces or outside the patient body cavity—the coregistration was repeated with a new set of reference points including additional points as warranted. The second coregistration was then used for contouring.
Target Contouring
All contouring work was performed on the AW virtual simulator. The display in the PET/CT Fusion Program is divided into quadrants with 2 CT images on the left and 2 PET images (either emission or transmission) on the right side of the screen. The images can be axial, coronal, or sagittal, but only 2 of the 3 image planes may be displayed simultaneously. Structure contours were drawn using the computer mouse based on data contained in the axial images only. Final contours were, however, displayed on all 3 image planes.
A maximum of 15 distinct contours may be drawn on an image set. Contours were named separately and a different color was chosen to visually differentiate them in the display. Contours are drawn on contiguous slices of the CT or 18F-FDG PET emission image data to define the primary tumor (GTV), and individual lymph nodes or lymph node chains that are deemed too bulky to be considered individual nodes. Once a contour is drawn on one image set (e.g., the CT image), the same contour was simultaneously displayed on the corresponding registered PET image.
In the first step of this process the radiation oncologist contoured the primary tumor and metastatic lymph nodes based solely on the traditional high-resolution CT image (i.e., independent of the PET information). The right half of the screen containing the PET data was covered so that these images could not be seen. Once CT contouring was complete, the nuclear medicine physician contoured any PET-positive regions interpreted as malignant in the emission images. The window level of the PET images was adjusted on a case-by-case basis to adequately visualize 18F-FDG–avid lesions relative to background; the resultant average thresholding was on the order of 50% of image maximum intensity. During the contouring process, the nuclear medicine physician did not take into account the CT contours that were displayed simultaneously with the PET data. However, interpretation of the 18F-FDG PET images was performed in conjunction with the CT images to help localize the metabolically active foci and differentiate physiologic from pathologic foci of 18F-FDG uptake.
Once the original CT and PET contours were complete, the radiation oncologist was then asked to review the original CT contours simultaneously with the PET contours. The PET target margins were then taken into consideration in redefining the CT contours to create a final contour that represented a compromise between CT- and PET-defined targets. To determine the percentage of the CT-defined GTV that was hypermetabolic, a separate contour was created that represented the union of the PET and CT contours. This was accomplished by manually tracing any portion of the PET contour that was entirely contained within the corresponding CT contour. By manually contouring the union volume between these 2 structures, it was then possible to obtain measurements on the following parameters: the portion of the PET GTV that overlapped into the CT GTV, the portion of the PET-defined lymph node that was contained within the CT-defined lymph node, and the portion of the union volume that is represented in the final PET/CT target volume.
IMRT Treatment Planning
We studied the feasibility of using IMRT treatment planning techniques to deliver a conformal dose of radiation to the CT- or PET/CT-defined planning target volume (PTV). The high-resolution planning CT together with CT, PET, and combined PET/CT target contours were transferred from the AW virtual simulator to the Eclipse treatment planning workstation (Varian Medical Systems). For planning purposes, a body contour was added in addition to normal tissue contours. A 5-field isocentric IMRT plan was developed with the isocenter located within the boundaries of the CT-defined GTV. A treatment margin was added to the CT GTV and PET/CT GTV separately to create the PTV. For comparison, the IMRT dose distribution was then optimized to the CT PTV and the combined PET/CT PTV.
RESULTS
Image Registration and Target Contours
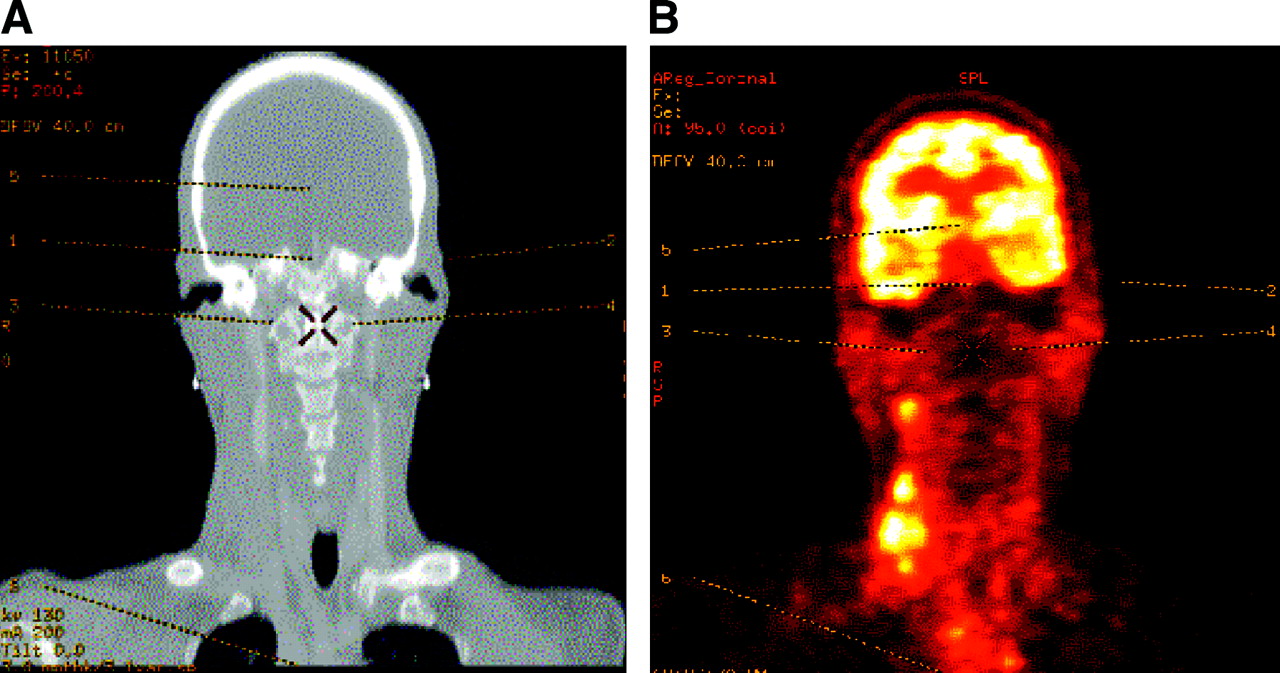
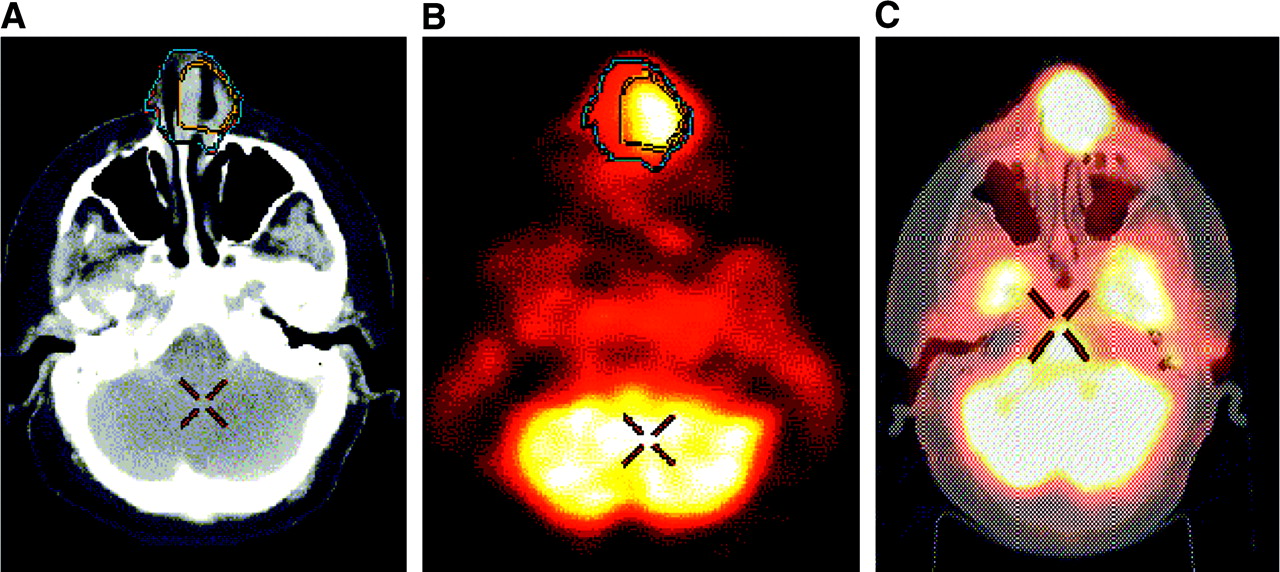
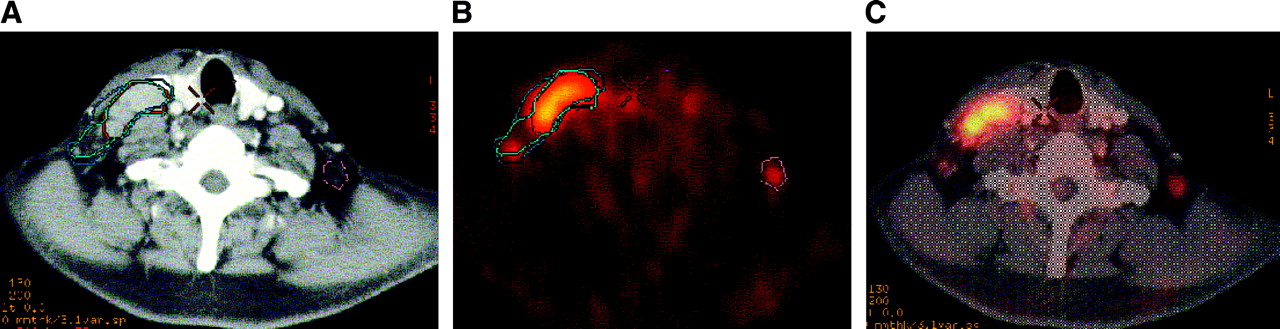
Typical 18F-FDG PET emission and CT coronal slice images together with corresponding anatomic reference points used for coregistration appear in Figures 1A and 1B. Figures 2A and 2B show an example of coregistration of PET and CT images of a patient with small cell carcinoma of the nasal cavity. In this case the hypermetabolic region as indicated by PET is located within the CT-defined contour (Figs. 2A and 2B). Figure 2C also shows the vendor-supplied software option used to display PET data blended with the anatomic CT data. In Figures 3A and 3B, PET and CT contours are nearly identical for the right lymph node, whereas the PET-defined contour of the primary tumor (red) extends farther laterally than the CT-defined contour (green) on this slice. A hypermetabolic node showing good agreement between PET and CT contours is shown in Figures 4A and 4B. Figures 5A and 5B show an example in which the PET-contoured lymph node added volume to the corresponding CT-defined node. In 1 of 6 patients (17%), the 18F-FDG PET study indicated an active lymph node that was not seen on CT (Figs. 6A–6C). Reregistration as a result of suboptimal initial coregistration was necessary in 2 of the 6 patients (33%).

Typical landmarks demonstrate correlation of images for coregistration (patient 6). High-resolution CT anatomic data (A) and corresponding color-enhanced 18F-FDG PET emission image (B). Image pair shows correspondence between alignment points used for registration of the 2 datasets.

PET contour contained within corresponding CT contour (patient 5). CT (A), corresponding color-enhanced 18F-FDG PET (B), and coregistered images (C). Extent of CT GTV is indicated by blue contour (A and B). Corresponding PET contour is in yellow (A and B). This example demonstrates an 18F-FDG–avid region within CT-defined GTV.

Example variations in agreement between PET and CT contours (patient 6). Transverse CT (A) and corresponding 18F-FDG PET image (B). In this example there is good agreement between CT (orange) and PET (yellow) contours of right lymph node. PET definition of primary target contour (red), however, includes more tissue laterally when compared with CT contour of this same area (green).

Primary CT and PET contour overlap (patient 4). CT (A) and corresponding 18F-FDG PET image (B) of right side hypermetabolic lymph node. This slice level shows CT (yellow) and PET (green) contours nearly overlapping. Taking into account slight differences between contours on other slice levels, original CT volume was increased by 3.4 cm3 to include portions of PET-avid regions.
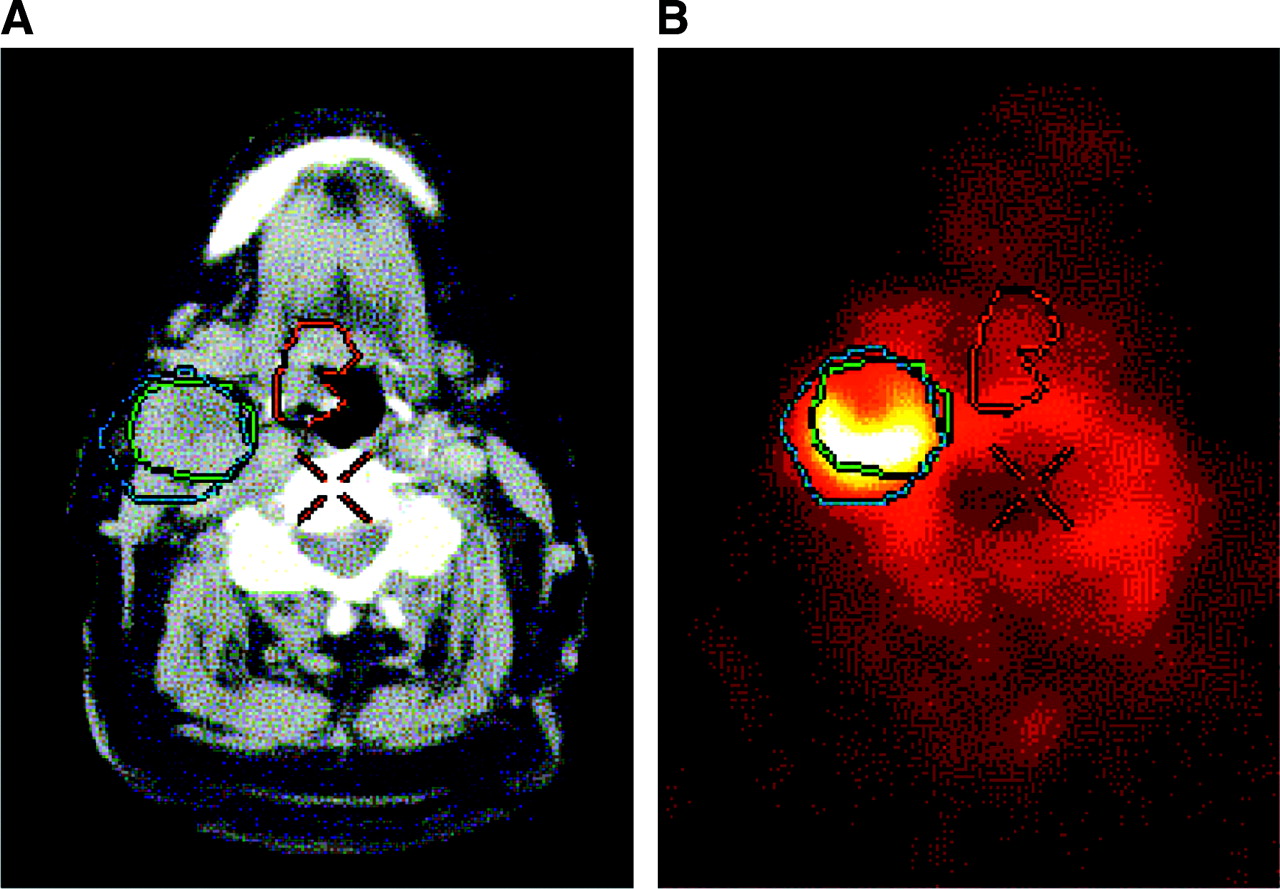
PET contour extending outside CT-defined contour (patient 2). CT (A) and corresponding 18F-FDG PET image (B). PET definition of right side node (blue contour) extends beyond CT-defined node (green contour) to include other soft tissue. CT-defined GTV (central red contour) shows no corresponding PET uptake in this region at this slice level.

Visualization of 18F-FDG PET–avid lymph nodes (patient 6). CT (A), 18F-FDG PET (B), and blended view (C). CT contour of right side lymph node is in aqua, and 18F-FDG PET contour of this same node is in red. 18F-FDG PET image (B) indicates 18F-FDG–avid node on left side not visualized on CT.
Target Volumes
For clarity, detailed data on each patient are presented separately followed by a summary of patient results. In all cases, when 18F-FDG activity was seen outside, but associated with, the CT volume, the final target volume was always the sum of the CT volume plus that 18F-FDG activity associated with the CT volume. Therefore, the resulting final target volume was always greater than the CT volume and less than or equal to the sum of the CT and PET volumes.
Patient 1.
The CT and PET studies of this patient were performed after a standard regimen of induction chemotherapy. Based on CT, 6 target volumes were identified: a primary lesion (23.5-cm3 volume), a left-side lymph node (3.5 cm3), and 4 right-side lymph nodes (2.3, 1.8, 1.6, and 1.5 cm3). The 18F-FDG PET scan for this patient, however, was interpreted as negative for any suspicious lesions and therefore no physiologic targets were identified.
Patient 2.
Two CT targets were contoured on this patient: CT primary (11.8 cm3) and CT right lymph node (26.0 cm3). The 18F-FDG PET images showed a corresponding PET primary lesion (6.6 cm3) and a PET-positive right lymph node (28.3 cm3). The CT primary was modified based on the PET contour and resulted in a final PET/CT primary target with a volume of 14.7 cm3. Due to overall similarities in contour size and location, CT contours of the right lymph node were not modified to include portions of the PET data extending outside the CT contour (Fig. 5).
Patient 3.
Three CT targets were identified on this patient: CT primary (35.9 cm3) and 2 right side lymph nodes (16.4 and 1.3 cm3). Three corresponding targets were identified on the 18F-FDG PET study: PET primary (42.1 cm3) and 2 right side lymph nodes (16.5 and 3.4 cm3). The CT primary was modified based on the PET contour and resulted in a final PET/CT primary target (41.5 cm3). The 2 CT-defined lymph nodes on the right side were also modified based on the PET data and combined into 1 final right side lymph node that includes the 2 PET-defined nodes (final PET/CT volume, 21.7 cm3).
Patient 4.
This patient had a single, CT-defined primary target (26.8 cm3) and a single corresponding 18F-FDG PET primary lesion (19.8 cm3). Based on the 18F-FDG PET data, the CT primary was modified to include 3.4 cm3 of the PET uptake not included within the CT margins (final PET/CT volume, 30.2 cm3).
Patient 5.
Two CT targets were contoured on this patient: CT primary (28.8 cm3) and CT lymph node (1.1 cm3). A lesion was identified and contoured on the 18F-FDG PET image (17.3 cm3) that corresponded to the CT primary lesion. No lymph nodes showed increased activity in the 18F-FDG study. Based on the 18F-FDG PET data, the CT primary was modified to include a portion of the PET uptake (final PET/CT volume, 31.1 cm3). Although the CT lymph node was not 18F-FDG avid, it was interpreted to show clinically suspicious nodal enlargement and therefore was treated as metastatic disease.
Patient 6.
This patient had 3 targets identified on CT: CT primary (6.6 cm3), CT lymph node 1 (18.7 cm3), and CT lymph node 2 (44.9 cm3). In this case 18F-FDG PET identified 5 target volumes, 3 of which correspond to CT targets: PET primary (13.8 cm3), PET lymph node 1 (18.2 cm3), and PET lymph node 2 (55.1 cm3). Two targets were identified on PET, which were not seen on CT: PET lymph node 3 (2.3 cm3) and PET lymph node 4 (60.4 cm3). PET lymph node 4 corresponded to a conglomeration of mediastinal and hilar lymph nodes group closely together. This nodal group was located in the upper mediastinum, below the most inferior slice of the CT and therefore was not included in the radiation planning CT or radiation treatment fields. Based on 18F-FDG PET, the CT primary contour was modified (final PET/CT volume, 8.7 cm3), as was CT lymph node 2 (final PET/CT volume, 53.5 cm3). Due to the similarity between CT lymph node 1 and PET lymph node 1, with volumes of 18.7 and 18.2 cm3, respectively, CT lymph node 1 was not modified based on PET. Review of anatomy in the region of PET lymph node 3 resulted in a final PET/CT volume for this node of 7.0 cm3.
Summary of Patient Results.
One patient was PET-negative after induction chemotherapy and therefore no PET volumes were drawn. In all remaining cases, the radiation oncologist modified the CT contours of the primary lesion based on the 18F-FDG PET data. The resulting volume of the PET/CT GTV was consistently larger than the CT volume alone by an average of 3.3 cm3 (15%). The volume increased due to inclusion of active regions in the 18F-FDG PET image that were not part of the original CT contour. In no instance did a smaller PET contour result in the reduction in size of a larger corresponding CT contour. There were a total of 5 instances in which 18F-FDG PET–identified active lymph nodes corresponded to a lymph node contoured on CT. Of these 5 instances, we modified the CT-contoured lymph node to create a final lymph node volume in 3 of 5 cases (60%). This includes patient 3, where the final CT nodal volume represented 2 closely situated CT and PET nodal groups. The final lymph node volume was on average 5.0 cm3 (17%) larger than the initial CT volume. We considered PET lymph node 3 in patient 6 to be a valid target and, after review of the CT, created a final PET/CT contour 4.7 cm3 larger than the PET-identified volume. Because the radiotherapy treatment planning CT did not image the upper mediastinum and the PET was whole-body PET, the large series of 18F-FDG–avid sites identified as PET lymph node 4 were not registered because no CT data were available to register and thus this site was not considered for radiation treatment. Table 2 summarizes primary and lymph node volume results.
Target Volume Summary
The degree of overlap between 18F-FDG PET volumes and CT-defined volumes was substantial, but not complete. For primary tumors, 3 of 6 patients exhibited hypermetabolic regions contained entirely within the CT-defined volume. Overall, the average percentage of the 18F-FDG PET primary volume that was contained entirely within the CT-defined volume (i.e., the average percentage of the CT GTV that was hypermetabolic) was 82% (range, 28%–100%). The average percentage of 18F-FDG PET active tissue that was located outside the CT primary volume was thus 18% (range, 0%–72%). The average percentage of the union volume relative to the final PET/CT volume represents the significance of the 18F-FDG PET volume in defining the final PET/CT GTV (average, 58%; range, 22%–76%). In the case of lymph nodes, the average percentage of volume defined by the 18F-FDG PET contours that was contained within the corresponding CT-defined lymph node volume was 76% (range, 58%–97%).
IMRT Treatment Plans
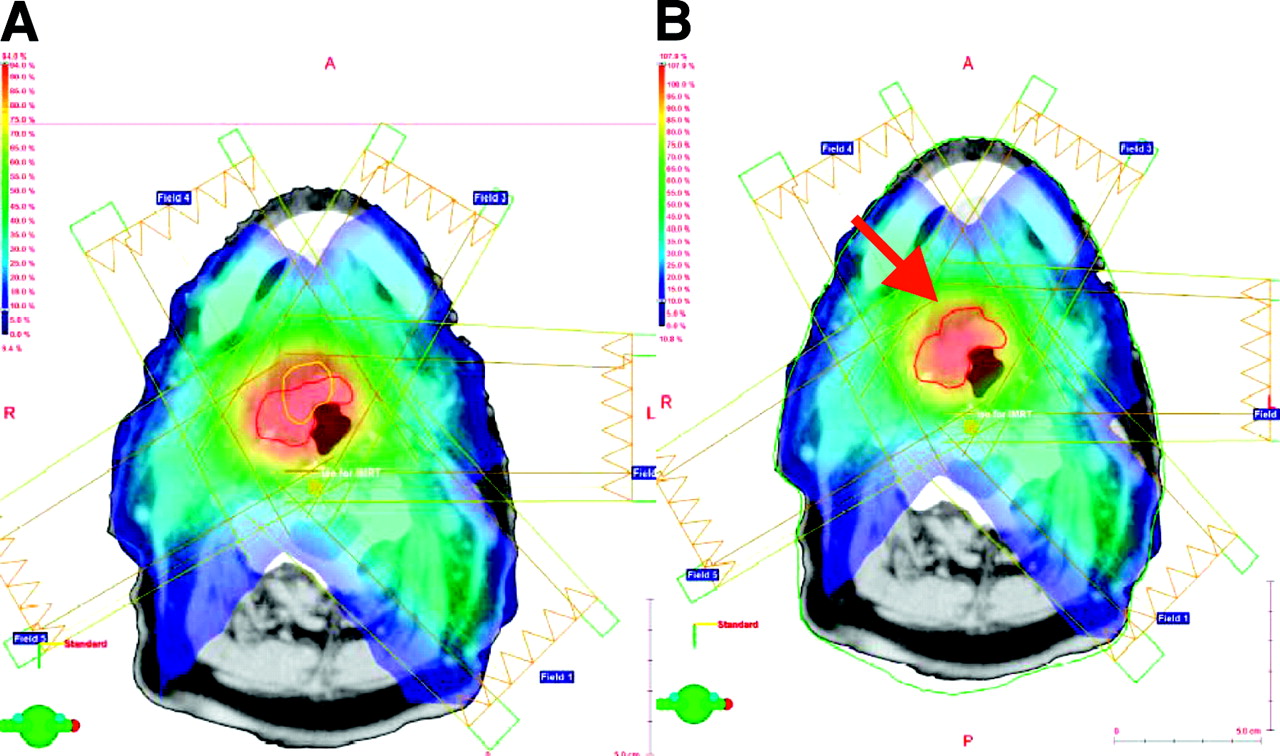
For comparison purposes, a transverse view of the IMRT plan targeting the 2 different regions appears in Figure 7. The dose distribution optimized to the CT-defined PTV for patient 2 is shown in Figure 7A. The corresponding dose distribution optimized to the combined PET/CT PTV at the same transverse slice is shown in Figure 7B. The PET PTV (Fig. 7A, yellow contour) occupied a smaller cross-sectional area than the CT PTV and was partially contained within the CT target contour. In this particular case, the final PET/CT PTV (Fig. 7B, red arrow) incorporates that portion of the PET contour lying outside the original CT contour. Although the same optimization constraints were used for both plans, the high-dose region, indicated in red colorwash in both figures, occupies a slightly smaller area on the plan optimized to the PET/CT PTV.

IMRT dose distribution (patient 2). Five-field IMRT plan is optimized to CT GTV (red contour in A). Corresponding PET GTV (yellow contour) is also shown in (A). IMRT plan is optimized to combined PET/CT GTV (red contour in B).
DISCUSSION
The purpose of this investigation was to study the influence of 18F-FDG PET physiologic data in determining radiation target volumes for HNC. Patient anatomic CT and physiologic 18F-FDG PET images were used to generate target volumes based on CT, PET, and combined PET/CT. To help minimize potential registration errors between modalities, the same immobilization devices were used during both CT simulation and PET imaging. This approach optimally reproduced the patient’s external anatomy. Even with this technique, it is assumed that identical repositioning of internal soft-tissue anatomy between scans is not possible, and thus slight differences are inevitable. However, this method of identical external repositioning should minimize nonphysiologic tissue movement and differences in location between studies.
Manipulation of 2 different image modalities acquired on different scanners at different times represents the most challenging starting point for the registration process. For example, in this work multiple registration attempts were necessary in 2 of the 6 patients to achieve a final registration where the distribution of 18F-FDG was contained within soft-tissue anatomy with minimal activity in air spaces (e.g., trachea). Since user-selected pairs of correlated points on CT and PET are used as the starting point for the registration algorithm, some trial and error is expected in picking these points. After reregistration, any residual 18F-FDG in air spaces was attributed to differences in CT and PET image resolution and the effects of tidal breathing motion on the average location of tissues in the PET data. It is important to note that misalignment can occur, even in regions that are anatomically possible. In this case, the misalignment might not be detected.
Although no quantitative methods were used to analyze the overall quality of the final registrations, in a parallel study involving a rigid, geometric phantom we determined that image registration using the mutual information algorithm may be accurate to within approximately 1 mm at the center of the image, with accuracy decreasing radially to approximately 2 mm at the external limits of the phantom (39). The ideal situation to minimize coregistration errors and movement of internal organs exists when the PET and CT data are acquired sequentially on the same imaging system. In this case, the CT portion of the combined scan would then be used as the radiotherapy planning CT. We are currently investigating this option at Vanderbilt using a newly installed Discovery LS (General Electric Medical Systems) dual-acquisition, integrated PET/CT scanner together with PET “friendly” immobilization devices and a laser isocentric alignment system matched to the linear accelerator room laser system. We would like to emphasize that integrated PET/CT scanners should provide a more precise fusion between PET and CT images because of the lack of patient motion the system provides.
Registration inaccuracies are a chief source of potential differences between PET and CT contours and therefore final target volumes. In general, there are several factors affecting PET images that are far less pronounced in CT, which may influence target edges or margins. These include partial-volume effects, patient motion, image resolution, and window display level. In this work, no analytic effort was made—for example, recovery coefficients—to attempt to correct the PET data for partial-volume effects. These effects were reduced, however, by ensuring that the PET volumes conformed to regions of soft tissue and other solid anatomy and not air spaces, for example. The effect of patient motion on CT image quality is considered minimal due to the short time period required to obtain these data. The possible degrading influence of patient motion on final PET image quality is greater than in CT due to the longer acquisition time of these scans. Using patient-specific immobilization devices as described minimized patient motion during PET imaging and therefore motion artifacts.
Anatomic CT transverse image resolution is on the order of <1.0 mm, whereas the same parameter for PET is on the order of 5.0–7.0 mm. These differences in image resolution will result in the PET contours being generally larger than the corresponding CT contour unless PET reveals hypermetabolic foci contained within the CT-defined volumes. For this reason, PET may only act as a complementary modality, providing information on target viability not visible by CT. In the context of radiotherapy, superior electron density localization using CT will always be required for dose calculation purposes. Changing the window level may change the interpretation of lesion margins as seen on PET. For example, increasing window level would likely lead to an overestimation of the target margin, and decreasing window level would result in a reduction in the estimated area of PET activity uptake. Either case would result in an erroneous estimate of the extent of the target as determined by PET and, thus, an overdose or underdose of the actual tumor volume. The optimal cutoff or window level for radiotherapy contouring applications has yet to be determined. Thus, a need exists to standardize window level settings when performing this task. In some instances, portions of the PET contour extended into air spaces (e.g., trachea). We believe this is due to a combination of partial-volume and misregistration effects. In every instance the final contour was a compromise between CT and PET and excluded portions of the PET contour where the probability of metabolic activity, as in air spaces, was considered low.
The practice of adding a margin to the PET GTV for IMRT planning purposes needs to be elaborated on. Any clinical implementation of this approach should be balanced by considering whether the PET contour by definition contains a “built-in” margin that is actually appropriate for radiotherapy planning purposes. Based on many factors, including longer image acquisition time, decreased image resolution, image blur, and a disease-related increased frequency in swallowing that may exaggerate the motion of structures in this region, it is reasonable to presume that the PET contour may, in one sense, be a better representation of average target location when compared with the short acquisition time, high-resolution CT data. Alternatively, it may also be argued that these same factors contribute to more uncertainty in the PET contour that must be quantified before targeting radiation dose to these areas. Outside of the influence of increased swallowing, it is not anticipated that motion of the tumor during the course of treatment would be a significant factor in the relatively rigid head and neck region.
A careful analysis of the possibility of false-positive and false-negative results in the PET data is especially warranted in the context of targeting radiation dose to regions of the body based on this modality. For example, some inflammatory processes such as infection and posttraumatic sites may show false-positive 18F-FDG uptake. Therefore, we believe the PET data cannot be interpreted completely independently of the CT. Interestingly, as pointed out by Hicks and MacManus, current radiation therapy methods do not specify a strict requirement to pathologically substantiate anatomic targets as seen on CT (40), a modality with which it is impossible to visualize the metabolic activity associated with cancer.
CONCLUSION
The use of 18F-FDG PET in radiotherapy planning represents an expansion of this already interdisciplinary process to include information on the biologic status of tumors. Inclusion of PET physiologic imaging data in the target definition process for HNC will provide information that is complementary to conventional CT and may result in target volumes that contain proliferating tumor burden. These metabolically active subsets of HNC might be useful in assigning dose intensification during IMRT. The medical significance of including these additional data in the original treatment plan on final patient outcome is yet to be determined. To the degree that PET provides physiologic data not available on CT, hybrid PET/CT treatment volumes may reduce the risk of geographic misses, particularly when using IMRT to constrict treatment volumes. When reviewing differences between CT and PET target volumes, however, careful consideration must be given to the quality of the coregistration and its potential role in these differences. Development and characterization of PET-based IMRT that produces even modest improvements in therapy design and the effectiveness of treatment on a patient-by-patient basis are likely to have a significant impact on patient care.
Acknowledgments
This work was supported, in part, by National Cancer Institute training grant 1R25-CA92043, Vanderbilt-Ingram Cancer Center program grant P30-CA68485, and a Varian educational grant. Support was also provided by the Department of Radiation Oncology and the Department of Radiology and Radiological Sciences at Vanderbilt University Medical Center. The authors thank Dawn Shone, CNMT, for help with PET data acquisition and management; Dennis Duggan, PhD, for assistance with IMRT; and Brad Mitchell for computer support.
Footnotes
Received Aug. 12, 2003; revision accepted Oct. 23, 2003.
For correspondence or reprints contact: William C. Lavely, MD, Division of Nuclear Medicine, Department of Radiology and Radiological Sciences, Johns Hopkins Medical Institutes, 601 N. Caroline St., Baltimore, MD 21287.
E-mail: wlavely1{at}jhmi.edu
REFERENCES
In this issue


Jump to section
Related Articles
Cited By...
- 18F-Fdg-PET-guided Planning and Re-Planning (Adaptive) Radiotherapy in Head and Neck Cancer: Current State of Art
- Workflow and Radiation Safety Implications of 18F-FDG PET/CT Scans for Radiotherapy Planning
- Positron emission tomography imaging approaches for external beam radiation therapies: current status and future developments
- Autocontouring and Manual Contouring: Which Is the Better Method for Target Delineation Using 18F-FDG PET/CT in Non-Small Cell Lung Cancer?
- 18F-FDG PET/CT for Image-Guided and Intensity-Modulated Radiotherapy
- Metabolic Tumor Volume of [18F]-Fluorodeoxyglucose Positron Emission Tomography/Computed Tomography Predicts Short-Term Outcome to Radiotherapy With or Without Chemotherapy in Pharyngeal Cancer
- PET Changes Management and Improves Prognostic Stratification in Patients with Head and Neck Cancer: Results of a Multicenter Prospective Study
- Treatment Monitoring by 18F-FDG PET/CT in Patients with Sarcomas: Interobserver Variability of Quantitative Parameters in Treatment-Induced Changes in Histopathologically Responding and Nonresponding Tumors
- The role of PET/CT scanning in radiotherapy planning
- Advanced imaging applied to radiotherapy planning in head and neck cancer: a clinical review.
- Expanding Role of Positron Emission Tomography in Cancer of the Uterine Cervix
- The contribution of PET/CT to improved patient management
- Comparison of Different Methods for Delineation of 18F-FDG PET-Positive Tissue for Target Volume Definition in Radiotherapy of Patients with Non-Small Cell Lung Cancer
- Staging of Untreated Squamous Cell Carcinoma of Buccal Mucosa with 18F-FDG PET: Comparison with Head and Neck CT/MRI and Histopathology