


Abstract
Alzheimer’s disease (AD) is a brain disorder characterized by reduced cerebral glucose metabolism (CMRgl) in several cortical regions. Evidence from neuropathology studies, animal models of AD, and 18F-FDG PET studies on cognitive impairment suggest that disrupted connections with the entorhinal cortex (EC) could be implicated in the emergence of the cortical hypometabolism. This 18F-FDG PET study assessed the functional interactions—that is, the intercorrelations between the EC and the whole brain in vivo—in normal aging and AD. Methods: Eighty-seven consecutive clinical AD patients underwent 18F-FDG PET scanning at rest. Thirty-five sex- and age-matched healthy elderly subjects were studied as controls (NC). A voxel-based correlation analysis was performed with statistical parametric mapping to assess significant correlations between relative CMRgl (rCMRgl) in the EC and the rest of the brain, for NC and AD patients. Results were considered significant at P < 0.001. Results: The pattern of EC functional interactions varies between normal aging and AD patients. In NC, the left and right EC were bilaterally correlated with several cortical and limbic regions, in accord with the major anatomic pathways identified in nonhuman primates. Alternatively, in AD patients, the EC correlations with the contralateral hemisphere were entirely lost, whereas those within the ipsilateral hemisphere were preserved only with the inferior temporooccipital (T–O) areas. Conclusion: This 18F-FDG PET correlation study indicates that AD-related processes lead to an altered functional relationship between the EC and several cortical and limbic regions, with respect to normal aging. Our results suggest that the assessment of coupled rCMRgl reductions between the EC and the ipsilateral T–O cortex, besides the typical pattern of cortical reduction, could increase 18F-FDG PET diagnostic sensitivity and further motivate its inclusion in the clinical assessment of AD.
Alzheimer’s disease (AD) is a neurodegenerative clinicopathologic syndrome leading to progressive, irreversible loss of memory and behavioral function and is associated with a pathologic neuronal loss and accumulation of β-amyloid plaques and neurofibrillary tangles and threads (NFT).
Neuroimaging studies with PET and SPECT techniques have largely investigated AD, showing cerebral metabolic (CMRgl) and blood flow (CBF) reductions in the temporal, parietal, posterior cingulate, and prefrontal regions (1). On the other hand, neuropathology and neurochemical studies have shown that the limbic entorhinal cortex (EC) is the brain area preferentially affected by the early deposition of NFT (2,3) and neuronal loss (4), which increase in the later stages of AD (2).
Although there is evidence that the EC is anatomically connected with the brain areas typically characterized by functional impairment in AD (5), its role in the onset of such a functional disruption is still uncertain. Important insights about the involvement of the EC in the cortical hypometabolism associated with AD derived from 18F-FDG PET studies on animal models of AD. Indeed, Meguro et al. (6) provided evidence that lesions of the rhinal cortex of nonhuman primates cause a long-lasting CMRgl decline in the parietal, temporal, and occipital associative cortices, the posterior cingulate, and the hippocampal regions. Additionally, EC lesions in rats were shown to induce CMRgl decreases in the frontal, parietal, and temporal regions ipsilateral to the lesion (7). These studies showed that the parietotemporal hypometabolism found in AD may result partly from neuroanatomic disconnection with the EC.
On the other hand, little is known about the functional connections between the EC and the rest of the brain in living human beings. A recent 18F-FDG PET study by de Leon et al. (8) showed that reduced baseline levels of CMRgl in the EC are reliable predictors of future neocortical hypometabolism as well as of cognitive decline in normal elderly subjects. However, to our knowledge, no study has been performed so far in vivo in humans with neuroimaging techniques to specifically explore the functional interconnections of the EC in normal aging and AD.
In this 18F-FDG PET study a voxel-based correlation analysis was performed to assess the functional interactions between the EC and the whole brain in both healthy elderly subjects and clinical AD patients. Our hypothesis was that in the control subjects the EC correlates with a widely distributed functional system, in accord with the major anatomic pathways identified in nonhuman primates (5). With regard to AD patients, we hypothesized that the pathologic involvement of the EC in AD could lead to modifications of its connectivity, resulting in lost or weakened correlations with the rest of the brain.
MATERIALS AND METHODS
Participants
AD Patients.
Subjects were recruited in the context of the Network for Efficiency and Standardization of Dementia Diagnosis (NEST-DD) research project funded by the European Commission (http://www.nest-dd.org) and were studied for cerebral glucose metabolism with PET between November 2000 and November 2002 at the Florence University Center. Eighty-seven consecutive AD patients were included in the study after having provided informed consent. All subjects were diagnosed according to the National Institute for Neurological Disorders and Stroke and the Alzheimer’s Disease and Related Disorders Association criteria (9). The study procedures included examinations by neurologists and psychiatrists, routine laboratory tests, neuropsychologic examinations, electroencephalograms, MRI and PET scans, and blood samples for genetic analysis. Patients were excluded in the case of (a) complications of other medical illnesses possibly causing cognitive impairment, such as thyroid disease, vitamin deficiencies, and malignant disease; (b) mental disease, substance abuse, or significant neurologic antecedents (e.g., brain trauma, tumors, epilepsy, vascular dementia, other dementing illnesses, and inflammatory disease); (c) evidence of focal brain lesions on MRI. Clinical and demographic characteristics of the patients under study are reported in Table 1.
Clinical and Demographic Characteristics of AD Patients Under Study
Control Subjects.
Controls (NC) were 35 healthy and unmedicated sex- and age-matched subjects (19 men, 16 women; mean age, 69.3 ± 5.6 y; age range, 64–81 y; educational level, 10.3 ± 3.2 y; Mini-Mental State Examination [MMSE] score, ≥26) from the NEST-DD database. With their informed consent and approval by local ethics committees, they were studied with PET under the same conditions and using the same scanning protocol at 3 collaborating laboratories (see below). As described in Herholz et al. (1), brain disease or cognitive disorders had been excluded by MRI and detailed clinical and neuropsychologic examination.
18F-FDG PET Scanning Procedures
The detailed 18F-FDG PET scanning procedure used is described in Herholz et al. (1). AD patients scans were acquired at our center using a General Electric Advance PET device. Emission scans were acquired in 2-dimensional mode with an axial field of view (FOV) of 152 mm, an in-plane full width at half maximum (FWHM) of 4.6 mm, and a slice thickness of 4.25 mm. NC scans were acquired at Cologne, Liege, and Dresden centers using ECAT EXACT, ECAT 951, and ECAT EXACT HR+ scanners, with an axial FOV of 162, 108, and 155 mm, an in-plane FWHM of 6, 8.5, and 3.6 mm, and a slice thickness of 3.375, 3.37, and 2.46 mm, respectively (1).
Subjects were injected with a dose of 110–370 MBq 18F-FDG at a resting state with eyes closed and ears unplugged in a dimly lighted room with minimal background noise. A polycarbonate head holder was used to reduce head movement during the scan. The required minimum time interval between injection and starting the scan was 30 min. On average, scans were started 42 ± 19 min after injection. The required minimum scan duration was 10 min. On average, scan duration was 19 ± 3 min. Images were reconstructed using filtered backprojection including correction for attenuation, measured by a transmission scan for NC images and according to Chang’s method (10) for AD patients because of its robustness in case of movements, and scatter using standard software as supplied by scanner manufacturers. Further details can be found in Herholz et al. (1).
18F-FDG PET Image Transformation
An MS-DOS version of NEUROSTAT (kindly provided by Prof. Satoshi Minoshima, Department of Internal Medicine, University of Michigan, Ann Arbor, MI) running on a WindowsMe (Microsoft) system was used to realign PET images relative to the anterior–posterior commissural line (AC–PC) and to normalize them onto the 18F-FDG PET template provided by NEUROSTAT (11). This procedure involves both a 9-parameter linear affine transformation and a nonlinear warping deformation to match the standard stereotactic Talairach and Tournoux space (12). It was shown to be particularly effective in accounting for eventual cortical atrophy and ventricular enlargement (11). Thereafter, PET images were converted into Analyze format using ImageJ software (http://rsb.info.nih.gov/ij/) and analyzed using statistical parametric mapping (SPM99; Wellcome Functional Imaging Laboratory, Institute of Neurology, University College London, London, U.K.) implemented in MATLAB version 5.3. To account for variations in gyral anatomy and individual variability in structure–function relationships, an isotropic gaussian filter was used to smooth PET images with a FWHM of 12 mm, which was found to be effective in equalizing resolution differences among scanners (1). Individual counts were normalized to mean global activity using proportional scaling to obtain relative CMRgl (rCMRgl) values from 18F-FDG radioactivity measurements. For all statistical analyses, only those voxels with values of >80% of the mean for the whole brain were retained.
Statistical Analysis
Statistical analyses were performed to (a) compare AD patients with NC and (b) assess the EC physiologic interactions in both NC and AD patients. The statistical procedures used and the corresponding results are presented separately. The comparison between AD patients and NC are presented before addressing the correlation analysis, which is the main interest of this study.
RESULTS
Comparison Between Control Subjects and AD Patients
Statistical Procedure.
A Student t test for independent samples was used to compare rCMRgl between NC and AD patients. Differences between groups were estimated according to the general linear model using linear contrasts. The influence of age on rCMRgl was controlled by setting the age at examination as a confounding variable. The different exploratory probability levels of P < 0.001 and P < 0.005 (uncorrected for multiple comparisons) were used until voxels within the EC reached the significance threshold. Brain areas identified through the statistical parametric maps were labeled according to the Talairach and Tournoux space (12), using the Talairach Daemon Database (http://ric.uthscsa.edu/projects/talairachdaemon.html) (13).
Results.
AD patients showed a marked rCMRgl decrease in several cortical and limbic areas compared with NC. Anatomic localization of the brain areas involved, the corresponding Talairach coordinates, and the significance level are reported in Table 2. The effect due to the use of different probability thresholds is shown in Figure 1. At the cortical level, areas of hypometabolism appeared within the superior temporal gyrus (STG; Brodmann area [BA] 22) and the middle temporal gyrus (MTG; BA 21), the inferior parietal lobule (BA 40), the superior frontal gyrus (SFG; BA 8/9), and the orbitofrontal gyrus (OFG; BA 11/47). These results were significant at P < 0.001, excepted for the OFG, that reached significance at P < 0.004. Within the limbic system, the posterior cingulate gyrus (PCG; BA 31) and the anterior cingulate gyrus (ACG; BA 32), as well as the parahippocampal gyrus (PHG; BA 36) entailing the entorhinal cortex (EC; BA 28), showed bilaterally decreased rCMRgl with respect to NC. Although the bilateral PCG and the left PHG reached the significance threshold at P < 0.001, a less restrictive probability value of P < 0.005 was needed to detect significant bilateral rCMRgl reductions in the other limbic structures.
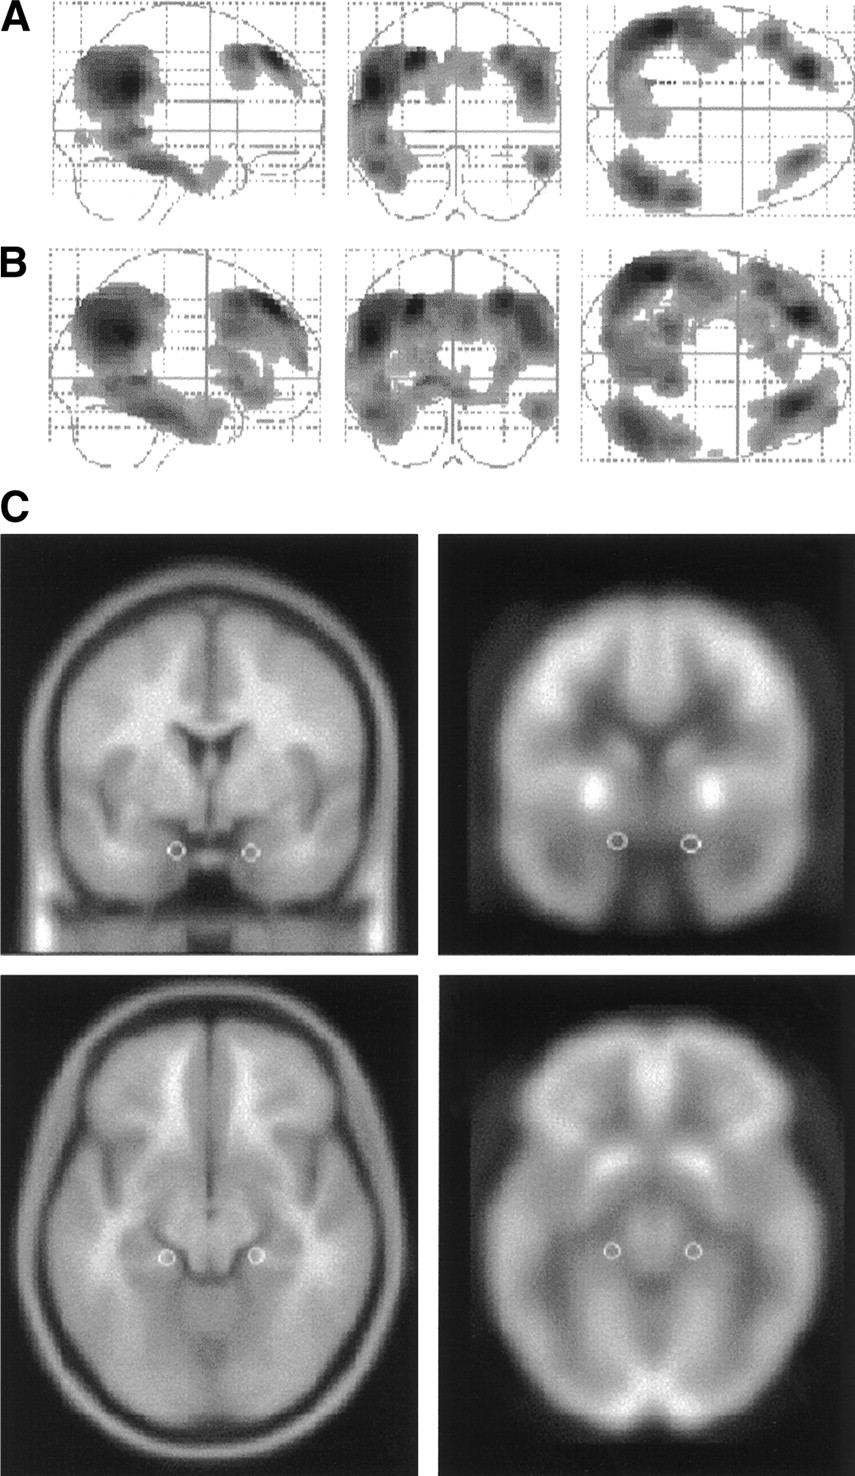
Brain areas characterized by reduced rCMRgl in AD patients compared with healthy control subjects. Results (black blobs) are displayed as SPM projections in the 3 orthogonal right sagittal, posterior coronal, and superior axial views. Results are displayed at P < 0.001 (A) and P < 0.005 (B), uncorrected for multiple comparisons. Local maxima of these brain regions can be found in Table 2. (C) White spheres corresponding to the left EC (x = −20, y = −14, z = −20) and right EC (x = 18, y = −13, z = −16) are displayed on the coronal and axial slices of a spatially standardized MR image (left) and an 18F-FDG PET image (right). Axial slices are shown at z = −18 mm relative to the AC–PC line and coronal slices are shown at y = −13 mm relative to the origin. Corresponding local maxima are reported in Table 2.
Local Maxima of Brain Areas Characterized by Decreased rCMRgl in AD Patients Compared with Healthy Controls
Functional Interactions
Statistical Procedure.
According to Horwitz et al. (14), functional (physiologic) interactions were defined as the intercorrelations among different brain regions. The basics are that pairs of brain regions whose rCMRgl values are significantly correlated are functionally associated and that the strength of the association is proportional to the magnitude of the correlation coefficient (14).
Statistical voxel-based correlation analyses were performed to assess the functional interactions of the EC, defined as voxels whose activity significantly correlates with rCMRgl in the EC, throughout the whole brain (15,16). Marsbar toolbox (http://www.mrc-cbu.cam.ac.uk/Imaging/marsbar.html) (17) was used to extract normalized rCMRgl (nrCMRgl) data within the EC (corresponding to BA 28) at each local maxima, in which a significant hypometabolism was found for the AD patients with respect to the NC (Table 2). EC nrCMRgl data were extracted from the left and right hemispheres within spheres of 2.5-mm radius (Fig. 1C), for both NC and AD patients.
The correctness of EC anatomic localization was assessed by superimposing the circular volumes of interest (VOIs) on a standard MR image spatially normalized onto the same template used for PET images, over which we had outlined 2 bilateral EC VOIs following the anatomic guidelines for MRI sampling of the EC as published by Bobinski et al. (18). Using gyral and sulcal landmarks, the EC gray matter was outlined on each of 5–7 coronal MRI slices and VOIs were enlarged to include an equal amount of adjacent white matter to improve the isotope diffusion recovery. This procedure resulted in VOIs that were approximately 1 cm in width by 2.5–3.5 cm in length. On visual inspection, the spheric VOIs outlined on the spatially normalized PET images (0.065 cm3) were well embedded within the MRI-guided VOIs.
Then, EC nrCMRgl data were used as covariates of interest in a new SPM analysis. The correlations between the left and right EC and the rest of the brain were separately tested. Functional interactions were examined independently for NC and AD patients. The influence of age on rCMRgl was controlled by setting the age at examination as a confounding variable. Correlations were estimated according to the general linear model using linear contrasts; proportional scaling was used to normalize individual global counts. The probability threshold was set at P < 0.001, uncorrected for multiple comparisons. An extent threshold of 24 voxels by cluster, corresponding to 2 times the FWHM, was applied to avoid casual correlation between voxels. Brain areas identified through the SPMs were labeled as described in the previous section.
Results.
As shown in Figures 2 and 3, the pattern of functional interactions between the left or right EC and the rest of the brain differs between NC and AD patients.
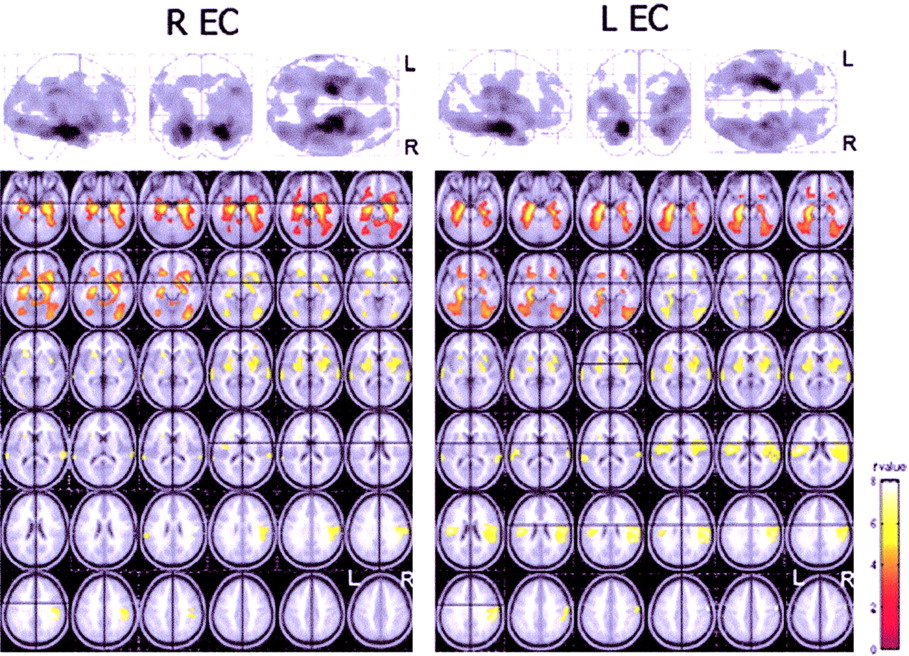
Functional interactions between the EC and the rest of the brain in healthy control subjects. (Top) Results (black blobs) are displayed as SPM projections in the 3 orthogonal right sagittal, posterior coronal, and superior axial views (P < 0.001, uncorrected for multiple comparisons). Local maxima of these regions can be found in Tables 3 and 4. (Bottom) Areas showing significant correlations are displayed on the axial slices of a standard MR image beginning at −26 mm relative to the AC–PC line (upper left of image) and extending up to 44 mm above the AC–PC line (lower right of image). Images are displayed in neurologic convention (left is left and right is right). t-Value color-coded scale is shown at the bottom right.

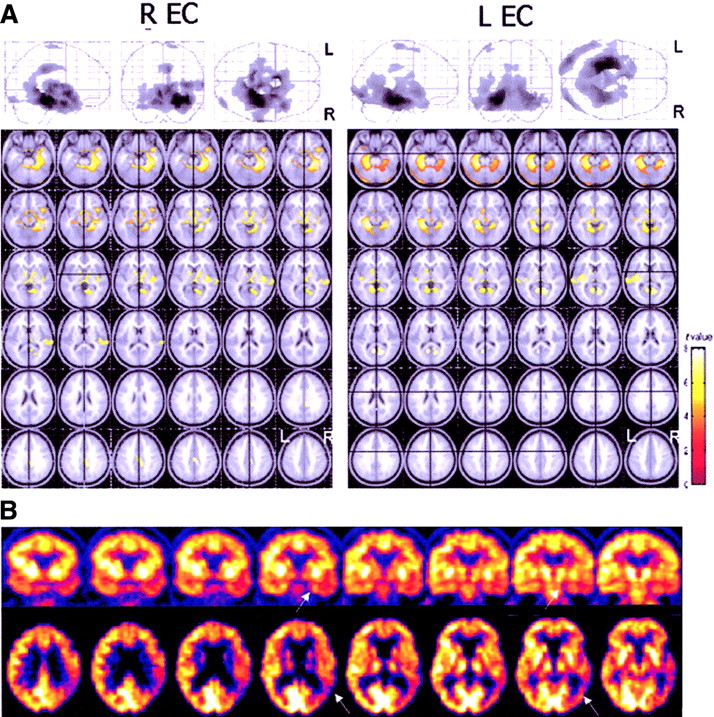
(A) Functional interactions between the EC and the rest of the brain in AD patients. (Top) Results (black blobs) are displayed as SPM projections in the 3 orthogonal right sagittal, posterior coronal, and superior axial views (P < 0.001, uncorrected for multiple comparisons). Local maxima of regions of correlated activity can be found in Tables 5 and 6. (Bottom) Areas showing significant correlations are displayed on the axial slices of a standard MR image beginning at −26 mm relative to the AC–PC line (upper left of image) and extending up to 44 mm above the AC–PC line (lower right of image). Images are displayed in neurologic convention (left is left and right is right). t-Value color-coded scale is shown at the bottom right. (B) 18F-FDG PET images of a 77-y-old woman with AD. Eight coronal slices orthogonal to the long temporal axis (top row) and axial slices parallel to the frontooccipital plane (bottom row) are shown. In this case, a coupled metabolic reduction in the temporoparietal cortex and in the ipsilateral medial temporal cortex (arrows) is evident.
The EC correlations in NC revealed that the left EC correlates with several cortical and limbic brain regions, most being bilaterally involved as reported in Table 3 (Fig. 2). At the cortical level, significant correlations were found with the frontal, parietal, temporal, and occipital lobes. Correlations with the frontal lobes included the medial frontal gyrus (MFG; BA 11/25), bilaterally, and the left inferior frontal gyrus (IFG; BA 47). Within the parietotemporal areas, the inferior parietal lobe (IPL; BA 40) and the precuneus (PreCu; BA 7), as well as the STG (BA 22) and the inferior temporal gyrus (ITG; BA 20), were involved. The medial occipital gyrus (MOG; BA 18/19) was bilaterally correlated. At the limbic level, the contralateral EC (BA 28) and the bilateral PHG (BA 35, BA 36) showed significant correlations.
Local Maxima of Brain Areas Where rCMRgl Is Correlated with Activity in Left EC in Healthy Controls
Similarly, the right EC (Table 4; Fig. 2) correlated with the contralateral EC (BA 28) and the bilateral PHG (BA 35, BA 36). At the cortical level, significant correlations were found with the frontal lobes, entailing the orbital gyrus (OG; BA 47), the IPL (BA 40) bilaterally, the right ITG (BA 20), and the left medial temporal gyrus (MTG; BA 21) and the right inferior occipital gyrus (IOG; BA 18/19).
Local Maxima of Brain Areas Where rCMRgl Is Correlated with Activity in Right EC in Healthy Controls
The EC correlations in AD patients revealed that the left EC was correlated with the contralateral EC, the bilateral PHG (BA 35, BA 36), and the ipsilateral left posterior cingulate gyrus (PCG; BA 31). At the cortical level, voxels within the ipsilateral MFG (BA 6) and ITG (BA 20/21) and the bilateral occipital BA 18, entailing the IOG and the fusiform gyrus, reached significance (Table 5, Fig. 3). Likewise, the right EC correlated with the homologous contralateral area, the bilateral PHG (BA 35, BA 36), and the ipsilateral PCG (BA 31). Within the cortical areas, correlations involving only the ipsilateral hemisphere were found with the SFG (BA 6), the temporal lobe, including the STG (BA 42), MTG (BA 38), and ITG (BA 20), and the occipital lobe (BA 18) (Table 6; Fig. 3).
Local Maxima of Brain Areas Where rCMRgl Is Correlated with Activity in Left EC in AD Patients
Local Maxima of Brain Areas Where rCMRgl Is Correlated with Activity in Right EC in AD Patients
Overall, in NC, the left and right EC were related to the homologous contralateral EC and several cortical areas on both hemispheres, resulting in a pattern of substantially symmetric functional interactions. In AD patients, both EC were still related to the contralateral homologous area but showed cortical correlations exclusively with the ipsilateral hemisphere and precisely with the ITG (BA 20) and the IOG (BA 18) to a less extent (Fig. 4).

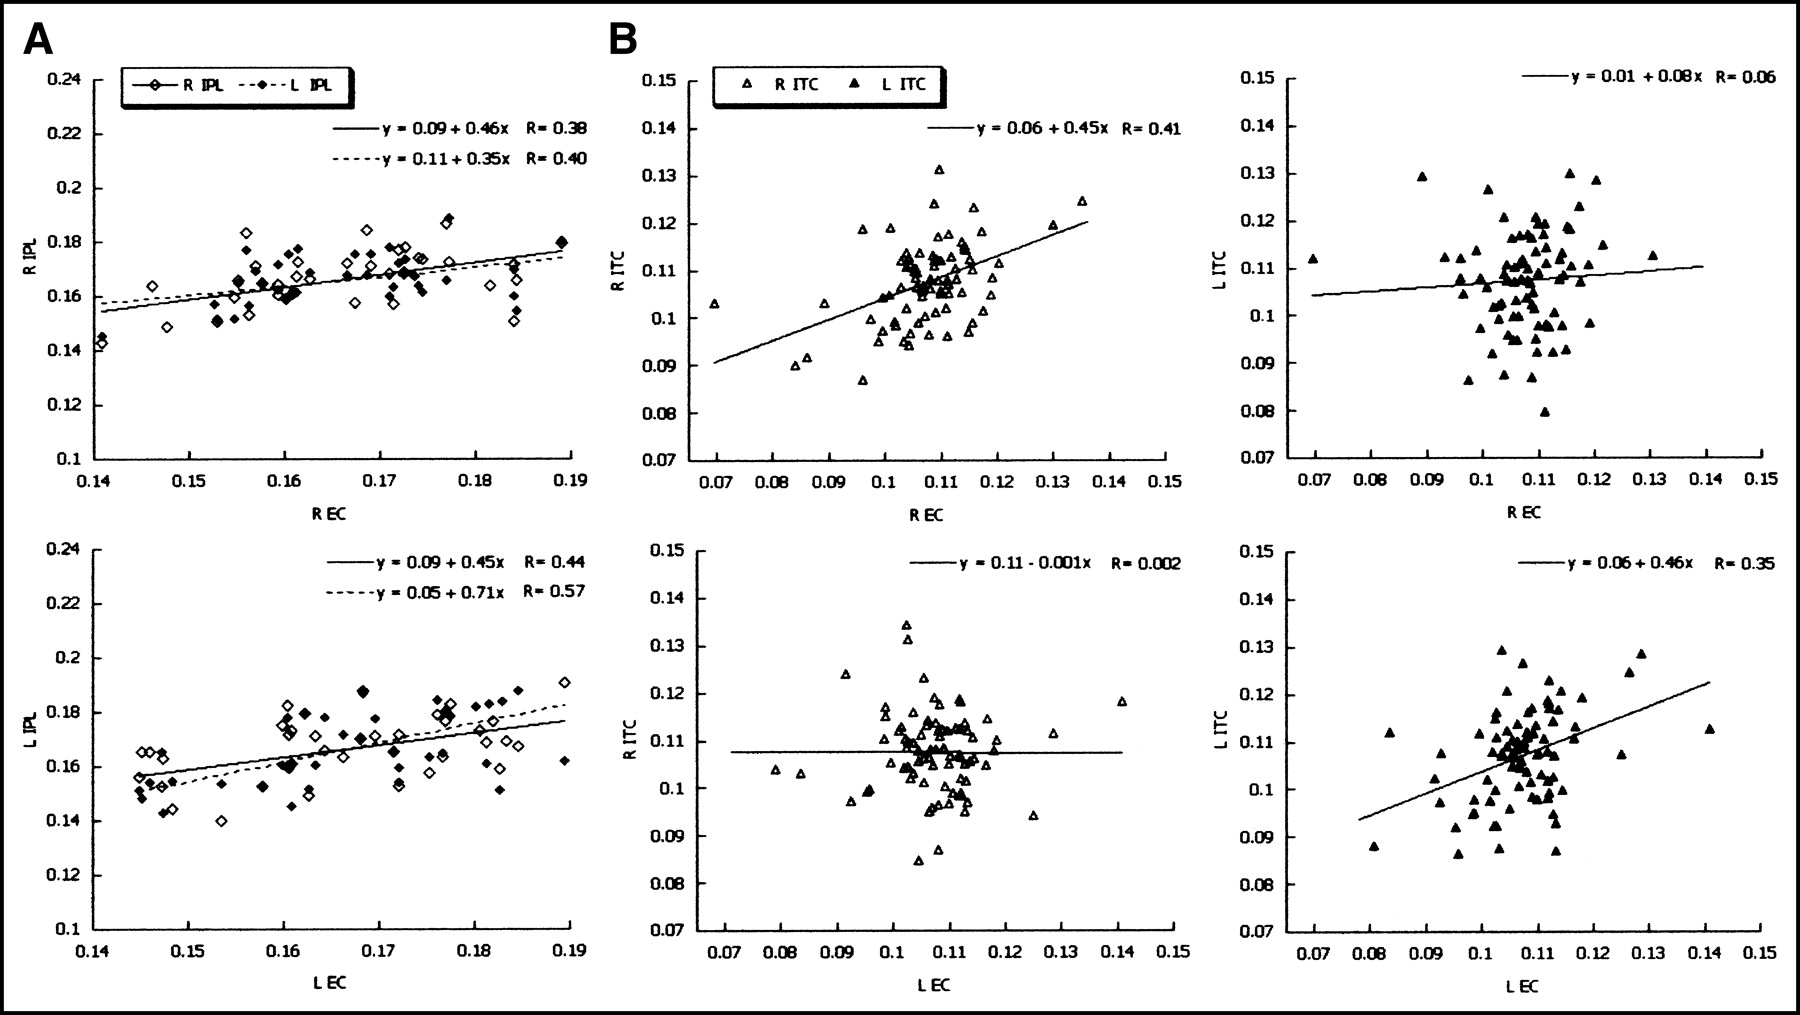
Scatter plots show the most significant EC correlations in NC and AD patients. (A) Correlations between percentage nrCMRgl values extracted from the left and right EC and the left and right inferior parietal lobule (IPL) in NC (diamonds). Note that the left and right EC both show bilateral significant correlations with the IPL. (B) Correlations between percentage nrCMRgl values extracted from the left and right EC and the left and right inferior temporal cortex (ITC) in AD patients (triangles). Note that in AD patients the left EC is related to the left ITC (R = 0.35) but not to the right ITC (R = 0.002; not significant) and vice versa, with the right EC correlated with the right ITC (R = 0.41) but not with the left ITC (R = 0.06; not significant), despite being, on the whole, the most related areas in AD. Regression models and correlation coefficients (R) are reported at the top of each graph.
DISCUSSION
The present 18F-FDG PET study shows that the pattern of functional interactions between the EC and the rest of the brain differ in healthy elderly and AD patients, as assessed in vivo through statistical voxel-based analysis. Indeed, in healthy controls, the left and right EC were both ipsilaterally and contralaterally correlated with several brain regions in an almost symmetric fashion, whereas, in AD patients, a loss of cortical interconnections was found. To our knowledge, this is the first study assessing the EC functional connectivity in normal aging and AD.
Functional interactions have been defined as the pattern of spatial intercorrelations between neurophysiologic (i.e., functional) measurements made in different brain areas (14,19). In the earlier studies on functional interactions, investigators focused on the relations among different brain regions of young healthy volunteers. Measurements of regional CBF (rCBF) (19) and rCMRgl (14) provided concordant results of a substantial overlap between anatomic and functional data, thus legitimating the assessment of functional interactions as reflecting the underlying anatomic pathways. In this study, the modified voxel-based approach proposed by Friston et al. (15,16) was used to identify the brain regions whose rCMRgl values were specifically correlated with those in the EC.
The distributed functional interactions detected in healthy controls is in accord with the major anatomic pathways identified in nonhuman primates (5). Indeed, strong reciprocal interconnections have been shown linking the EC and several limbic and cortical areas. In particular, the EC shares reciprocal interconnections with the hippocampus and the parahippocampal cortex (5,20) and, in turn, receives inputs from the orbital and dorsolateral frontal cortex, the parietotemporal and occipital associative areas, and the cingulate cortex (21). Consistent with anatomic findings, we found significant bilateral correlations between the EC and these same limbic and cortical regions.
Alternatively, this study shows that in AD patients there is a loss of significant EC functional interactions. With respect to the wide brain system outlined for the controls, in AD patients, the EC cortical intercorrelations are preserved only with the inferior temporal and occipital areas and only on the ipsilateral side. These findings are consistent with 18F-FDG PET studies on animal models of AD, which suggested that the parietotemporal hypometabolism found in AD may result partly from neuroanatomic disconnection with the EC. Indeed, Meguro et al. (6) showed distant cortical metabolic effects after rhinal damage in nonhuman primates. Bilateral rhinal lesions triggered long-lasting rCMRgl reductions in the inferior parietal, posterior temporal, posterior cingulate, and associative occipital cortices (6). In a similar study, damages to the perirhinal regions (BA 35), which are reciprocally connected to the EC, contributed to the instauration of temporal hypometabolism in baboons (22). However, there is poor knowledge in living humans about the involvement of the EC in the cortical hypometabolism emerging in AD patients. The recent 18F-FDG PET findings by de Leon et al. (8) indicate that baseline EC rCMRgl levels are sensitive predictors of future cortical hypometabolism in normal elderly converting to mild cognitive impairment. Thus, our results integrate these data, providing evidence of a functional relationship between the EC and the cortical areas also in clinical AD patients.
In addition, our results indicate that, whereas in control subjects each EC is correlated with the associative areas of both hemispheres, in AD patients the EC correlations with the contralateral hemisphere appear to be entirely lost. These observations are supported by evidence from rats models of AD showing that EC lesions induce CMRgl decreases in the frontal, parietal, and temporal regions ipsilateral to the side of the lesion, but not to the contralateral side (9). The present findings suggest that AD-related pathophysiologic processes disrupt the functional communication between the EC and the contralateral connected cortical areas, leading to an interhemispheric unbalance. Indeed, whereas rCMRgl and rCBF declines occurring during healthy aging are distributed in a bilateral and symmetric way (23,24), increases in variability and asymmetry have been shown in AD patients by several PET and SPECT studies (1,25–27). Further support to the interhemispheric disruption derives from 3-dimensional MRI volumetric reports showing that the commissural system connecting bilateral temporal and parietal cortical areas undergo atrophic changes in AD patients (28,29). In line with these results, the loss of EC–cortical connectivity in AD patients could be interpreted as the result of the disruption of the cross-sectional fibers connecting the EC to the opposite hemisphere. Future studies are needed to assess whether these findings could be accounted for by disrupted connectivity or, rather, they reflect an AD-related hemispheric imbalance.
On the other hand, in AD patients, the EC was found to be still functionally related to the ipsilateral inferior temporooccipital (T–O) areas. Although a causative relationship between metabolic dysfunction in the EC and in the rest of the brain cannot be established through the present correlation model, preliminary hypotheses can be put forward based on results from previous research. As a matter of fact, neuropathology and neurochemical studies have shown that the EC is the brain area earlier targeted by NFT deposition in AD. Initially, NFT are confined to the entorhinal–hippocampal region and, only after reaching relatively high densities within the limbic and inferotemporal regions, accumulate in the frontoparietotemporal areas (2,3). Consequently, the focal concentration of NFT in the EC–Hipp complex has been proposed as the pathogenetic process of cortical dysfunction, through the disruption of projection neurons (30,31). Indeed, formation of NFT, neuronal loss, decrease in dendritic extent, and synaptic depletion disturb the communication among various cortical areas, resulting in anatomic isolation and fragmentation of many cortical zones (30,31). Although this mechanism of cortical disconnection remains to be validated, the present results allow one to hypothesize that a primary rCMRgl reduction in the EC could trigger a coupled cortical reduction, mainly in the inferior T–O cortex (Fig. 3B). These findings are also supported by 18F-FDG PET evidence that baseline EC CMRgl levels are predictors of longitudinal memory impairment and temporal neocortex metabolic reductions in healthy subjects (8).
Although no definitive conclusion can be drawn from these results about the temporal relationship between metabolic dysfunction in the EC and in the neocortex, since this was not a longitudinal study, the finding of a coupled rCMRgl reduction between the EC and these cortical areas is important from a pathophysiologic point of view. Future studies are needed to investigate whether the assessment of coupled rCMRgl reductions in the medial temporal lobes (MTL), entailing the EC, and the ipsilateral T–O areas could become a diagnostic marker of AD, capable of a more specific and early assessment of the disease type and severity (Fig. 3B). Moreover, the relationship between rCMRgl asymmetries in the MTL structures and the associative neocortex remains to be investigated.
Lastly, each EC was correlated with the homologous contralateral area for both controls and AD patients. Therefore, it could be argued that in NC the EC interconnections with the bilateral cortices depend on a statistical effect of spurious correlation, mediated by the strong correlations with the contralateral EC. Conversely, the loss of EC cross-hemispheric correlations detected in AD patients demonstrates that the functional interactions found in NC result from a real transhemispheric functional connectivity of each EC. To our knowledge, this is the first support for the functional interhemispheric connectivity of the EC in living human beings. Future studies are needed to control for the heterogeneity of AD by assessing whether differences between the patient’s age at disease onset, high and low MMSE values, and high and low education levels could affect the correlation structure.
In this study a correction for cortical atrophy was not performed. Nonetheless, most studies that have performed voxel-based atrophy correction of resting glucose metabolism reported a relative independence of rCMRgl reduction from brain atrophy (32). However, although brain atrophy does not greatly influence radioactivity concentration of 18F-FDG in the cortical regions, its specific impact on a very small region such as the EC should be considered in future studies, possibly using quantitative CMRgl measurements and an MRI-guided approach, to specifically assess whether the loss of correlation between EC and the contralateral regions in AD could be due to a different reduction of activity detected by PET in the cortex and in the EC itself. Moreover, it should be noted that an uncorrected threshold of P < 0.005 was needed to detect EC rCMRgl reductions in the AD group with respect to the controls, whereas a more restrictive value of P < 0.001 was sufficient to detect hypometabolism in the associative cortices (Fig. 1). Since there is evidence that the limbic system is mostly affected in late-onset AD patients (33), the inclusion of both early-onset and late-onset cases could account for this effect. Otherwise, it is likely that the small size of these structures complicates the detection of significant differences by means of a voxel-based method.
Our findings are subject to potential limitations. Although we used MRI-guided VOI settings, positioning and delineation of regional boundaries have been defined on a probabilistic basis. Therefore, caution is required in the interpretation of these results for 2 main technical reasons. First, although the mean EC thickness (approximately 1 cm on coronal slices) (18) is greater than the PET scanner’s spatial resolution (mean in-plane FWHM, 5 mm), EC counts may be influenced by the spillover of surrounding structures’ gray matter—for instance, the hippocampus and the perirhinal cortex—because of their spatial closeness to the EC (5). This limitation intrinsically affects EC measurements as obtained with PET and could not be excluded unless applying specific image treatment (i.e., cortical atrophy correction, resolution recovery, and so forth).
Second, EC normalized rCMRgl values were extracted from VOIs placed at each local maximum of statistical significance, using spheres of 5-mm diameter, hence smaller than the EC itself, which in turn covers about 1-cm cortex in width and 2.5–3.5 cm in length (18). Although EC VOIs were rather small, contributions from the surrounding white matter cannot be excluded and an individual MRI-guided VOI definition would have been more reliable. However, the small dimension of the VOIs and the spatial normalization of all PET images over a common reference template imply that this kind of procedure may lead to the overestimation of type II errors; in other words, it may increase the risk of rejecting a significant result and may thus be seen as a conservative strategy. Moreover, this approach has been largely adopted in PET studies aimed at investigating the functional connectivity of small brain structures such as the hippocampus (34,35) and amygdala (36).
Finally, particular caution should be taken when making inferences from these preliminary results that provide insights about EC metabolic networks and offer additional points of debate toward the pathophysiology of AD.
CONCLUSION
This 18F-FDG PET correlation study indicates that AD-related processes lead to an altered EC functional connectivity, with respect to normal aging. Though in healthy controls each EC was related to several cortical and limbic areas on both hemispheres, in AD patients only the correlation with the ipsilateral inferior T–O areas was preserved. These findings could help in clinically diagnosing patients with suspected AD. It is likely that accounting for an altered functional connectivity, along with the standard inspection of cortical rCMRgl reductions, could increase 18F-FDG PET diagnostic sensitivity and motivate its use as a surrogate marker for therapeutic endpoints and to individuate target structures at major risk for being disrupted by AD-related pathology.
Acknowledgments
The authors gratefully acknowledge Dr. Isak Prohovnik for critical evaluation of this article, Drs. Eric Salmon and Vjiera Holthoff for kindly providing part of the database of healthy control subjects, and Dr. Satoshi Minoshima for facilitating the use of NEUROSTAT software. This study was conducted by the Network for Efficiency and Standardization of Dementia Diagnosis (NEST-DD) with support from the European Commission (Framework V). Support was also received by European Union grants QLK-6-CT-1999-02178, QLK-6-CT-1999-02112. Work at Florence was also supported by the Ministero dell’Università e della Ricerca Scientifica e Tecnologica, by Telethon Italia Fondazione ONLUS (grant E.0980), and by Regione Toscana, Progetto Ministero della Sanita, Diagnosi Tempestiva e Differenziale della Malattia di Alzheimer: Uso delle Tecnologie avanzate. Work at Centre de Recherches du Cyclotron, Liege, was also supported by grants from Fonds National de la Recherche Scientifique and Fondation Médicale Reine Elisabeth, Belgium.
Footnotes
Received Jun. 27, 2003; revision accepted Oct. 7, 2003.
For correspondence contact: Alberto Pupi, MD, Department of Clinical Pathophysiology, Nuclear Medicine Unit, University of Florence, viale Morgagni 85, 50134 Florence, Italy.
E-mail: a.pupi{at}dfc.unifi.it
REFERENCES
In this issue


Jump to section
Related Articles
Cited By...
- Sex-driven modifiers of Alzheimer risk: A multimodality brain imaging study
- Metabolic Networks Underlying Cognitive Reserve in Prodromal Alzheimer Disease: A European Alzheimer Disease Consortium Project
- Computational anatomical methods as applied to ageing and dementia
- Role of Neuroimaging in Alzheimer's Disease, with Emphasis on Brain Perfusion SPECT
- Identification of Aldolase as a Target Antigen in Alzheimer's Disease