


Abstract
The aim of this study was to compare left ventricular (LV) volumes and regional wall motion determined by PET with those determined by the reference technique, cardiovascular MRI. Methods: LV end-diastolic volume (LVEDV), LV end-systolic volume (LVESV), and LV ejection fraction (LVEF) were measured and regional wall motion was scored in 38 patients with chronic coronary artery disease by both gated 18F-FDG PET and MRI. A 9-segment model was used for PET and MRI to assess regional wall motion. Results: Good correlations were observed between MRI and gated PET for all parameters (r values ranging from 0.91 to 0.96). With PET, there was a significant but small underestimation of LVEDV and LVEF. Mean ± SD LVEDV, LVESV, and LVEF for MRI were 131 ± 57 mL, 91 ± 12 mL, and 33% ± 12%, respectively, and those for gated PET were 117 ± 56 mL, 85 ± 51 mL, and 30% ± 11%, respectively. For regional wall motion, an agreement of 85% was found, with a κ-statistic of 0.79 (95% confidence interval, 0.70–0.89; SE, 0.049). Conclusion: LV volumes, LVEF, and regional wall motion can be assessed with gated 18F-FDG PET and correlate well with these parameters assessed by MRI.
Left ventricular (LV) ejection fraction (LVEF), LV end-diastolic volume (LVEDV), and LV end-systolic volume (LVESV) are important prognostic parameters in patients with chronic coronary artery disease (CAD) and LV dysfunction (1). Hence, accurate assessment of LVEF and LV volumes in these patients is important, and several noninvasive techniques are available for this purpose; these include 2-dimensional (2D) echocardiography (2), MRI (3), and radionuclide ventriculography (4). PET is a well-established technique for the imaging and quantification of myocardial metabolism and perfusion. Metabolic imaging with 18F-FDG is considered the gold standard for the assessment of viability (5,6). Electrocardiographically (ECG) gated PET with 18F-FDG offers the unique potential of combining LV function and myocardial metabolism assessments in a single PET examination. Limited data are available on the accuracy of gated PET compared with the accuracy of MRI for the assessment of LVEF, LV volumes, and regional wall motion in patients with depressed LV function (7–11). Most of these studies were performed with other techniques, including gated SPECT, left ventriculography, and 2D echocardiography, to compare LV function, LV volumes, and regional wall motion with those determined by gated PET. MRI is considered the gold standard for determining parameters of LV function. The aim of this study was to compare the accuracy of gated PET with that of MRI (serving as the gold standard) for the assessment of LV function, LV volumes, and regional wall motion in patients with chronic CAD and depressed LVEF.
MATERIALS AND METHODS
Patients
The inclusion criteria were angiographically proven CAD and impaired LV function documented on 2D echocardiography or LV angiography by use of an ejection fraction cutoff value of approximately 45%. Exclusion criteria were unstable angina pectoris or heart failure requiring hospitalization, cardiac pacemakers or intracranial clips, arrhythmias making ECG gating impossible, and claustrophobia.
Thirty-eight patients (28 men and 10 women; mean ± SD age, 66 ± 9 y) with clinically diagnosed CAD were evaluated in this study. All patients underwent an ECG-gated 18F-FDG PET scan and ECG-triggered MRI within 1 wk.
Twenty-eight patients had had a previous myocardial infarction (all >6 mo before the study), and 17 patients exhibited Q waves on the electrocardiogram (8 anterior, 5 inferior, 2 both, and 2 lateral) (Table 1). These patients had 2.2 ± 0.7 (mean ± SD) vessels with a significant stenosis of more than 70% diameter reduction (7 patients had 1-vessel disease, 15 had 2-vessel disease, and 16 had 3-vessel disease). Ten patients had type 1 or 2 diabetes, and 7 had systemic hypertension. Nine patients had undergone previous revascularization. Twenty-eight patients had angina pectoris (Canadian Cardiovascular Society classes 1–4).
Patient Characteristics
None of the patients had cardiac events or additional therapeutic interventions between the PET and MRI scans.
PET Scanning
All antianginal medication and caffeine-containing beverages were withdrawn at least 24 h before the PET studies. Patients were prepared with a glucose-enriched breakfast, except for diabetic patients. At 90 min before 18F-FDG injection, 500 mg of acipimox (a nicotinic acid derivative) was administered orally. To prevent side effects of acipimox (e.g., skin rash), 250 mg of aspirin were given just before acipimox administration. A euglycemic hyperinsulinemic glucose clamp was used in accordance with a standardized protocol as described by DeFronzo et al. (12) and Knuuti et al. (13) for patients with insulin-dependent diabetes mellitus.
Gated 18F-FDG PET was performed with an ECAT-951/31 PET system (Siemens/CTI) by imaging 31 planes over a total axial length of 10.8 cm. After the transmission scan (68Ge/68Ga rod sources) was performed, 400 MBq of 18F-FDG was injected intravenously, and the acquisition procedure was performed. The total 18F-FDG acquisition time was 50 min, the last 20 min of which were in gated acquisition mode with 16 frames per cardiac cycle. The myocardial counting rate was higher than 10 kcps coincident. All gated 18F-FDG PET scans were obtained in phased mode, that is, the length of each gate was optimized for the current R–R interval. The R–R interval was allowed to vary by ±10%. Data were corrected for attenuation with the transmission scan and were reconstructed with filtered backprojection (Hann filter; 0.5 pixel/cycle). After manual reorientation, 12 short-axis images were obtained with plane thicknesses of 7–9 mm at an in-plane resolution of approximately 7 mm.
PET Data Analysis
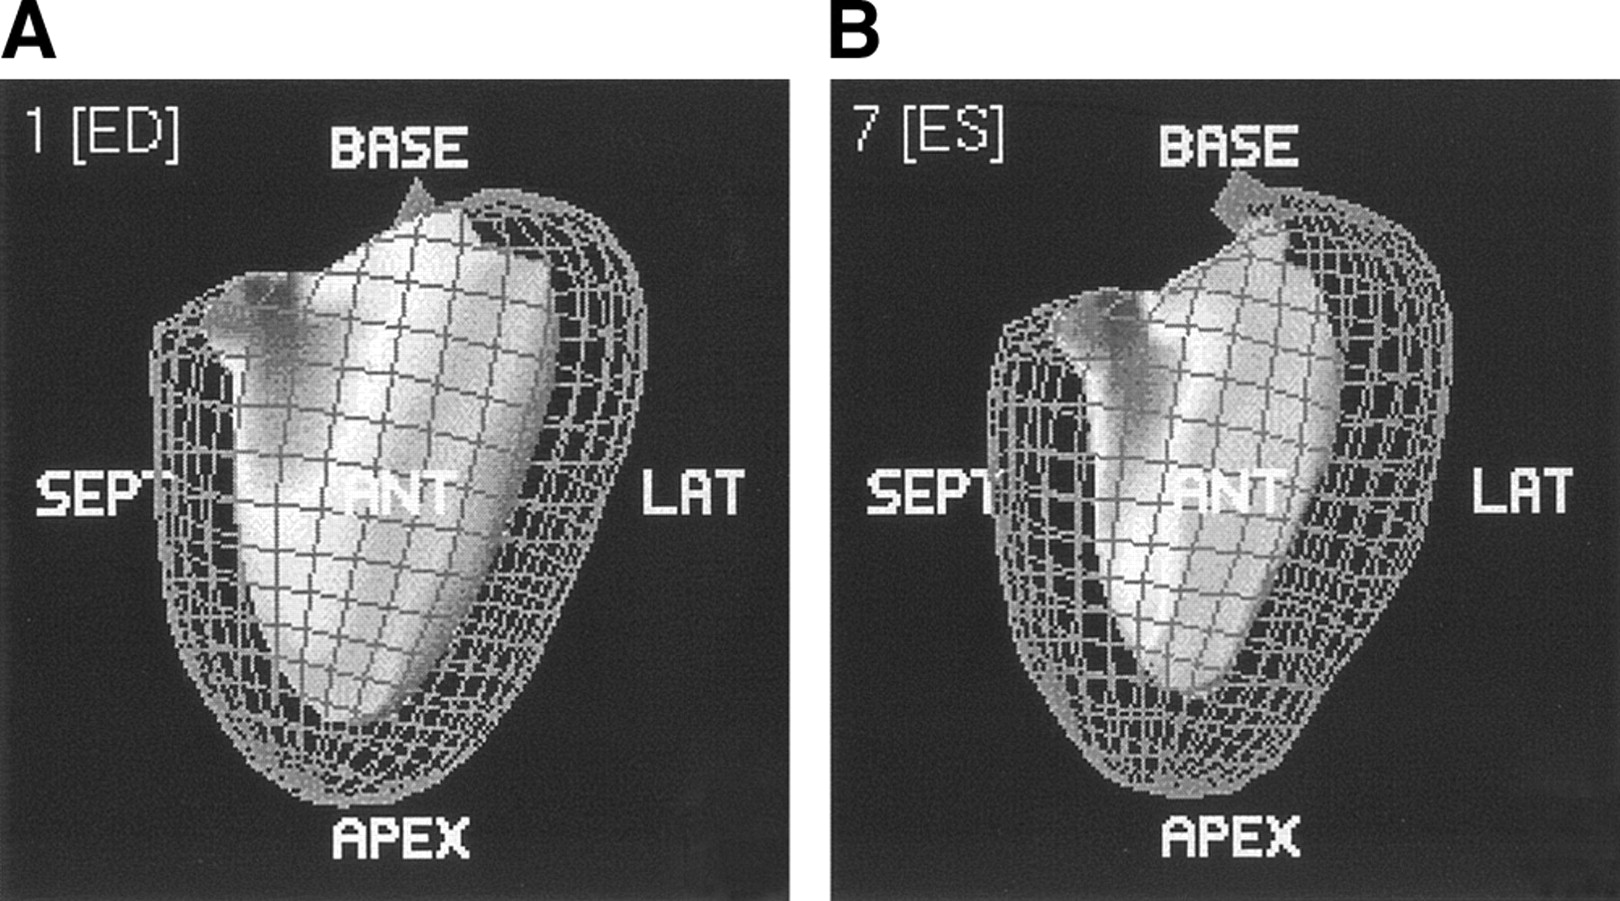
A quantitative gated SPECT (QGS) analysis program derived from earlier studies (14–17) for assessing LV volumes, LVEF, and regional wall motion was used to analyze the gated PET data. In brief, QGS segments the myocardium on the basis of LV short-axis images. Endocardial and epicardial surfaces are determined on the basis of count profiles that are fitted to asymmetric gaussian curves. With myocardial size, shape, and location criteria, surface points can be determined, even in regions without apparent radioactivity uptake. These calculations are performed for each gate, resulting in a determination of the myocardial surfaces as a function of the cardiac cycle. LVEF is calculated from the largest and smallest LV volumes, defined as end diastole and end systole (Fig. 1). We applied this program to gated PET data without any changes or preprocessing, except for translation of the data to the required input format.

Images from QGS of end-diastolic (A) and end-systolic (B) phases showing epicardial and endocardial borders of the left ventricle. SEPT = septal; LAT = lateral.
A 9-segment model, including 1 apical segment, 4 distal segments (anterior, lateral, inferior, and septal), and 4 basal segments (anterior, lateral, inferior, and septal), was used for PET. Each segment was assigned a wall motion score of 0–2: 0, normal; 1, hypokinetic; and 2, akinetic or dyskinetic. A summed wall motion score was calculated for each patient as the sum of the individual scores of the 9 segments.
Also, the 9-segment polar map was used to display LV 18F-FDG uptake. Segments were scored according to a 4-point scoring system: 0, normal (activity, 75%–100% maximum); 1, mild reduction (50%–75%); 2, severe reduction (25%–50%); and 3, absent tracer uptake (0%–25%).
MRI Acquisition
All MR images were acquired with patients in the supine position by use of a 1.5-T MRI system (Vision; Siemens Medical Systems) with a flexible body array coil for signal reception. Spin-echo scout images were obtained in the coronal and sagittal imaging planes, after which the short-axis plane was determined. The short-axis plane was defined as being perpendicular to the LV long axis from the center of the mitral annulus to the apex. Slices of 8 mm were acquired at 8–10 base-to-apex short-axis locations during repeated breath holds (±15 s) with a 2D fast low-angle shot ECG triggered sequence with various repetition times (TRs). The field of view was 300–350 mm. Images were obtained in 128 × 256 matrices.
During 1 cardiac cycle of a breath hold, a limited number (5–10) of raw data lines were acquired for each TR for the successive phases of the cardiac cycle. Therefore, the breath hold should span several cardiac cycles to fill the k-space. The TR ranged from 40 to 100 ms, with an echo time of 6 ms, depending on the R–R interval of the patient and the number of cardiac phases to be imaged.
MRI Data Analysis
A Sparc workstation (Sun Microsystems) was used for analysis. LV volumes were calculated from the MR images by use of previously validated automated software (MR Analytic Software System; Medical Imaging Systems, Inc.) (18). The details of this procedure have been described elsewhere (18,19). In brief, the borders of the left ventricle on short axes were outlined automatically, but when endocardial detection was unreliable, contours were corrected manually (Fig. 2). The enclosed surface areas were measured automatically. Papillary muscles were regarded as being part of the LV cavity (19). Endocardial and epicardial borders were traced in all end-diastolic and end-systolic images; epicardial fat was excluded (19). The window width and window level settings were determined automatically by scaling to the maximum gray scale. LVESV and LVEDV were calculated, and the related LVEF subsequently was derived. For the assessment of regional wall motion, MR images were interpreted visually by a single, experienced observer unaware of the PET results. A 9-segment model was used with the same scoring system as that described above; each segment was assigned a wall motion score by use of a 3-point scoring system (0–2 for normal to akinetic or dyskinetic).

Transverse 2-chamber view of end-diastolic (A) and end-systolic (B) phases of the left ventricle. Epicardial and endocardial contours are automatically drawn, but incorrect contours can be corrected manually.
Statistical Analysis
Continuous data for LVEDV, LVESV, and LVEF were expressed as mean ± SD and tested for statistical significance with the 2-tailed Student test for paired data. The agreement for segmental wall motion was assessed from 3 × 3 tables by use of weighted κ-statistics. κ-Values of <0.4, of 0.4–0.75, and of >0.75 were considered to represent poor, fair to good, and excellent agreements, respectively, on the basis of the Fleiss classification (20). The κ-values are reported with their 95% confidence intervals (CIs) and their SEs.
The agreements among LVESV, LVEDV, LVEF, and summed wall motion scores derived from the gated PET and MRI data were determined by linear regression (Pearson correlation coefficient) and Bland–Altman analysis (21). The absence of a relationship between the summed 18F-FDG defect score and the difference between LVEFs measured by gated PET and MRI was evaluated by linear regression analysis (Pearson correlation coefficient).
For all tests, a P value of <0.05 was considered significant.
Ethics
All patients gave informed consent for the gated 18F-FDG PET and MRI studies. This investigation was approved by the local research ethics committee.
RESULTS
Nongated 18F-FDG PET Data
Twenty-six patients exhibited severe 18F-FDG defects (activity, 0%–25%), with 2.8 ± 1.6 segments per patient. In addition, 28 patients also exhibited moderate defects (score, 1 or 2).
Regional Wall Motion Evaluated by Gated PET and MRI
Ten LV segments in 2 MRI studies were dropped from this investigation because of reduced quality resulting from patient movement.
On MRI, 159 segments exhibited normal wall motion, 118 demonstrated hypokinesia, and 55 demonstrated akinesia or dyskinesia. On gated PET, 146 segments showed normal wall motion, 137 showed hypokinesia, and 49 showed akinesia or dyskinesia. The agreement on a segmental basis is shown in Table 2. An agreement of 85% was found, with a κ-statistic of 0.79 (95% CI, 0.70–0.89; SE, 0.049), indicating excellent agreement. Importantly, 43 of 55 of the akinetic or dyskinetic segments (78%) on MRI were classified identically by gated PET, and 102 of the 118 hypokinetic segments (86%) also were classified as hypokinetic by gated PET. Hence, for the 173 dysfunctional segments on MRI, the exact agreement was 83%, with a κ-statistic of 0.79 (95% CI, 0.68–0.90; SE, 0.055). An agreement of 79% was found between 18F-FDG PET studies with segments showing ≤25% 18F-FDG uptake and akinetic or dyskinetic segments on MRI.
Agreement Between MRI and Gated 18F-FDG PET for Assessment of Regional Wall Motion Score (RWMS)
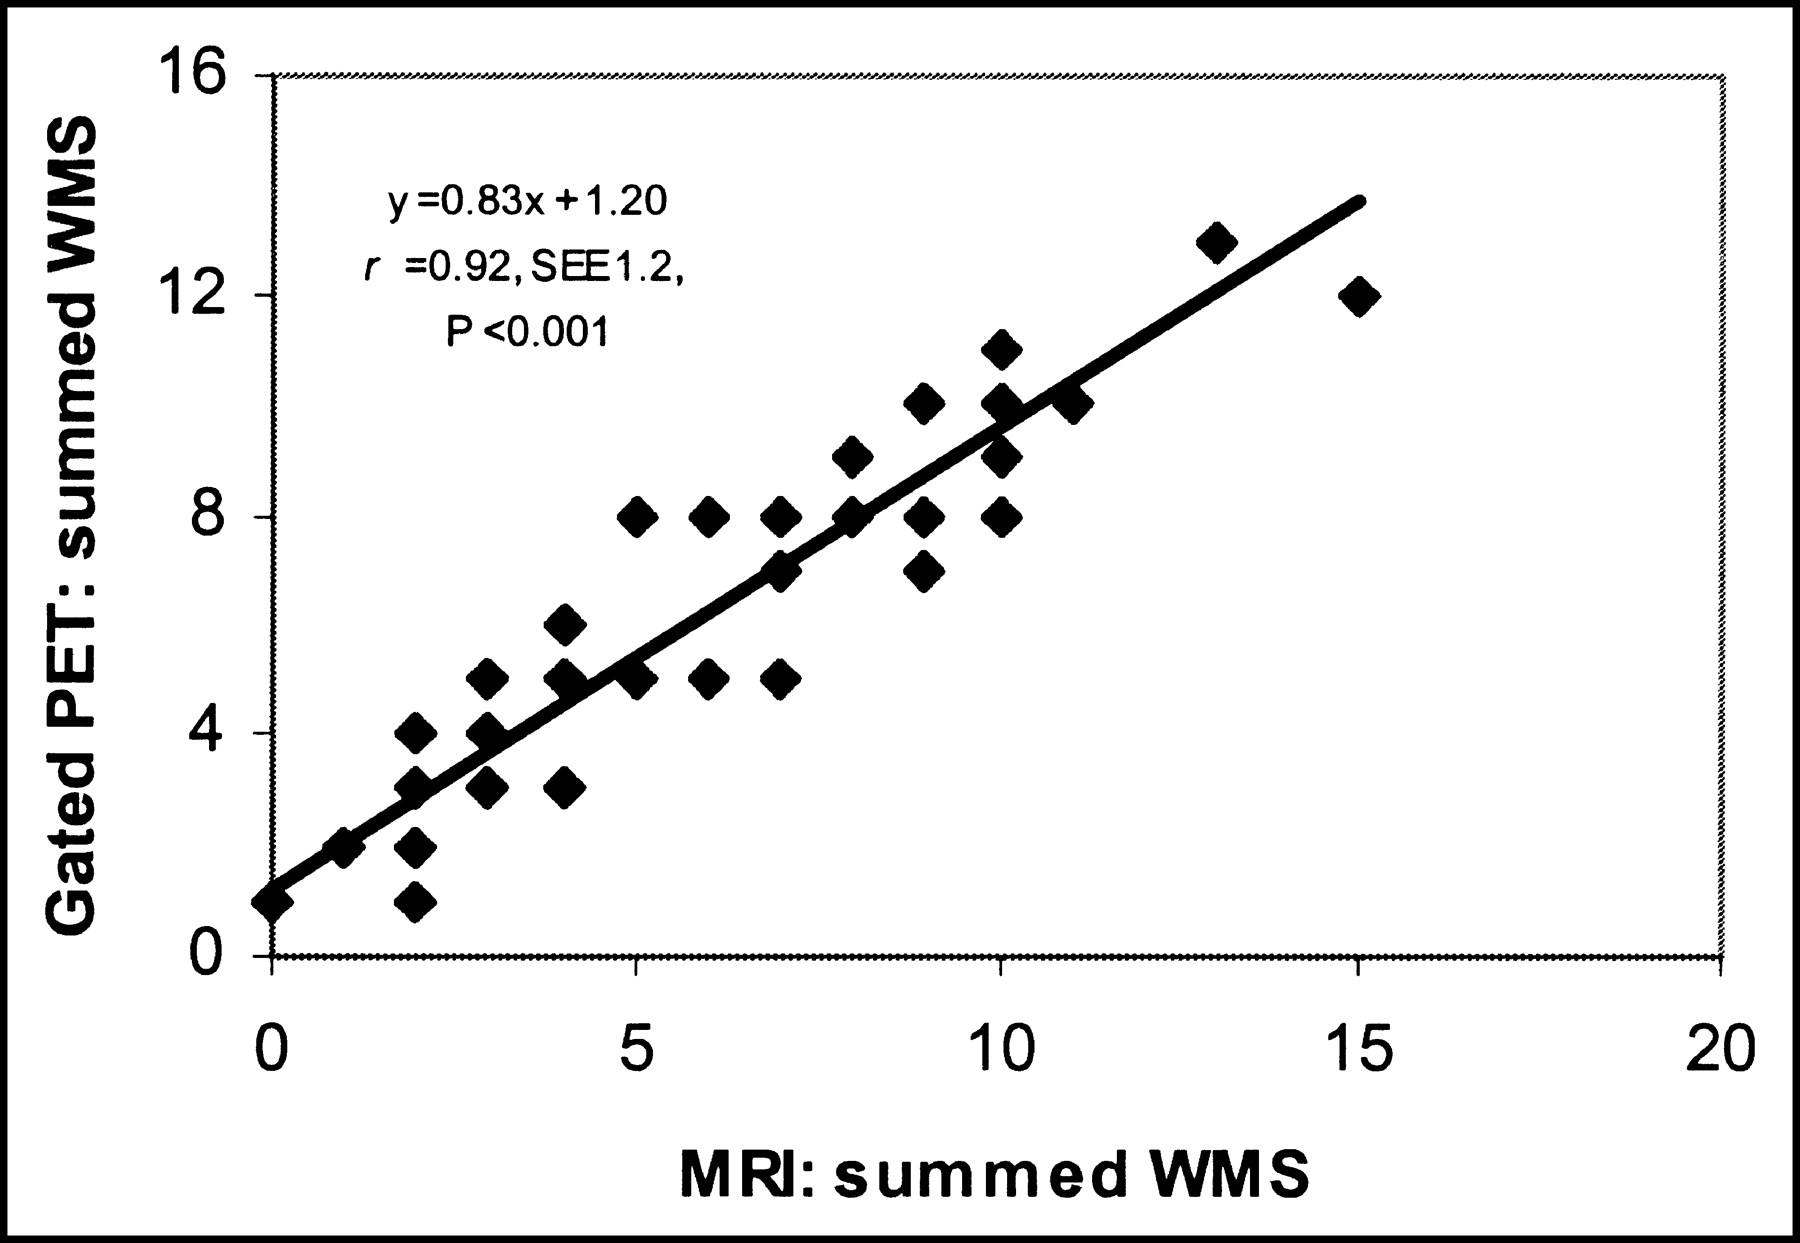
Virtually all disagreements between MRI and gated PET wall motion scores were a 1-grade difference (49/50; 98%). The relationship between the summed wall motion scores was excellent (y = 0.83x + 1.20; r = 0.92; P < 0.001) and is shown in Figure 3. The agreement on a patient basis (expressed as the percentage of identically scored segments) varied from 67% to 100%, with a mean ± SEE agreement of 85% ± 11% per patient; importantly, the agreement was >85% in 21 patients. Three basal segments (anterior, lateral, and inferior) and 2 distal segments (lateral and septal) exhibited the highest agreement (>85%) (Fig. 4). The basal anterior segment and the apex showed the lowest agreement between the 2 techniques (70%).

Relationship between summed wall motion scores (WMS) per patient on MRI and on gated 18F-FDG PET.
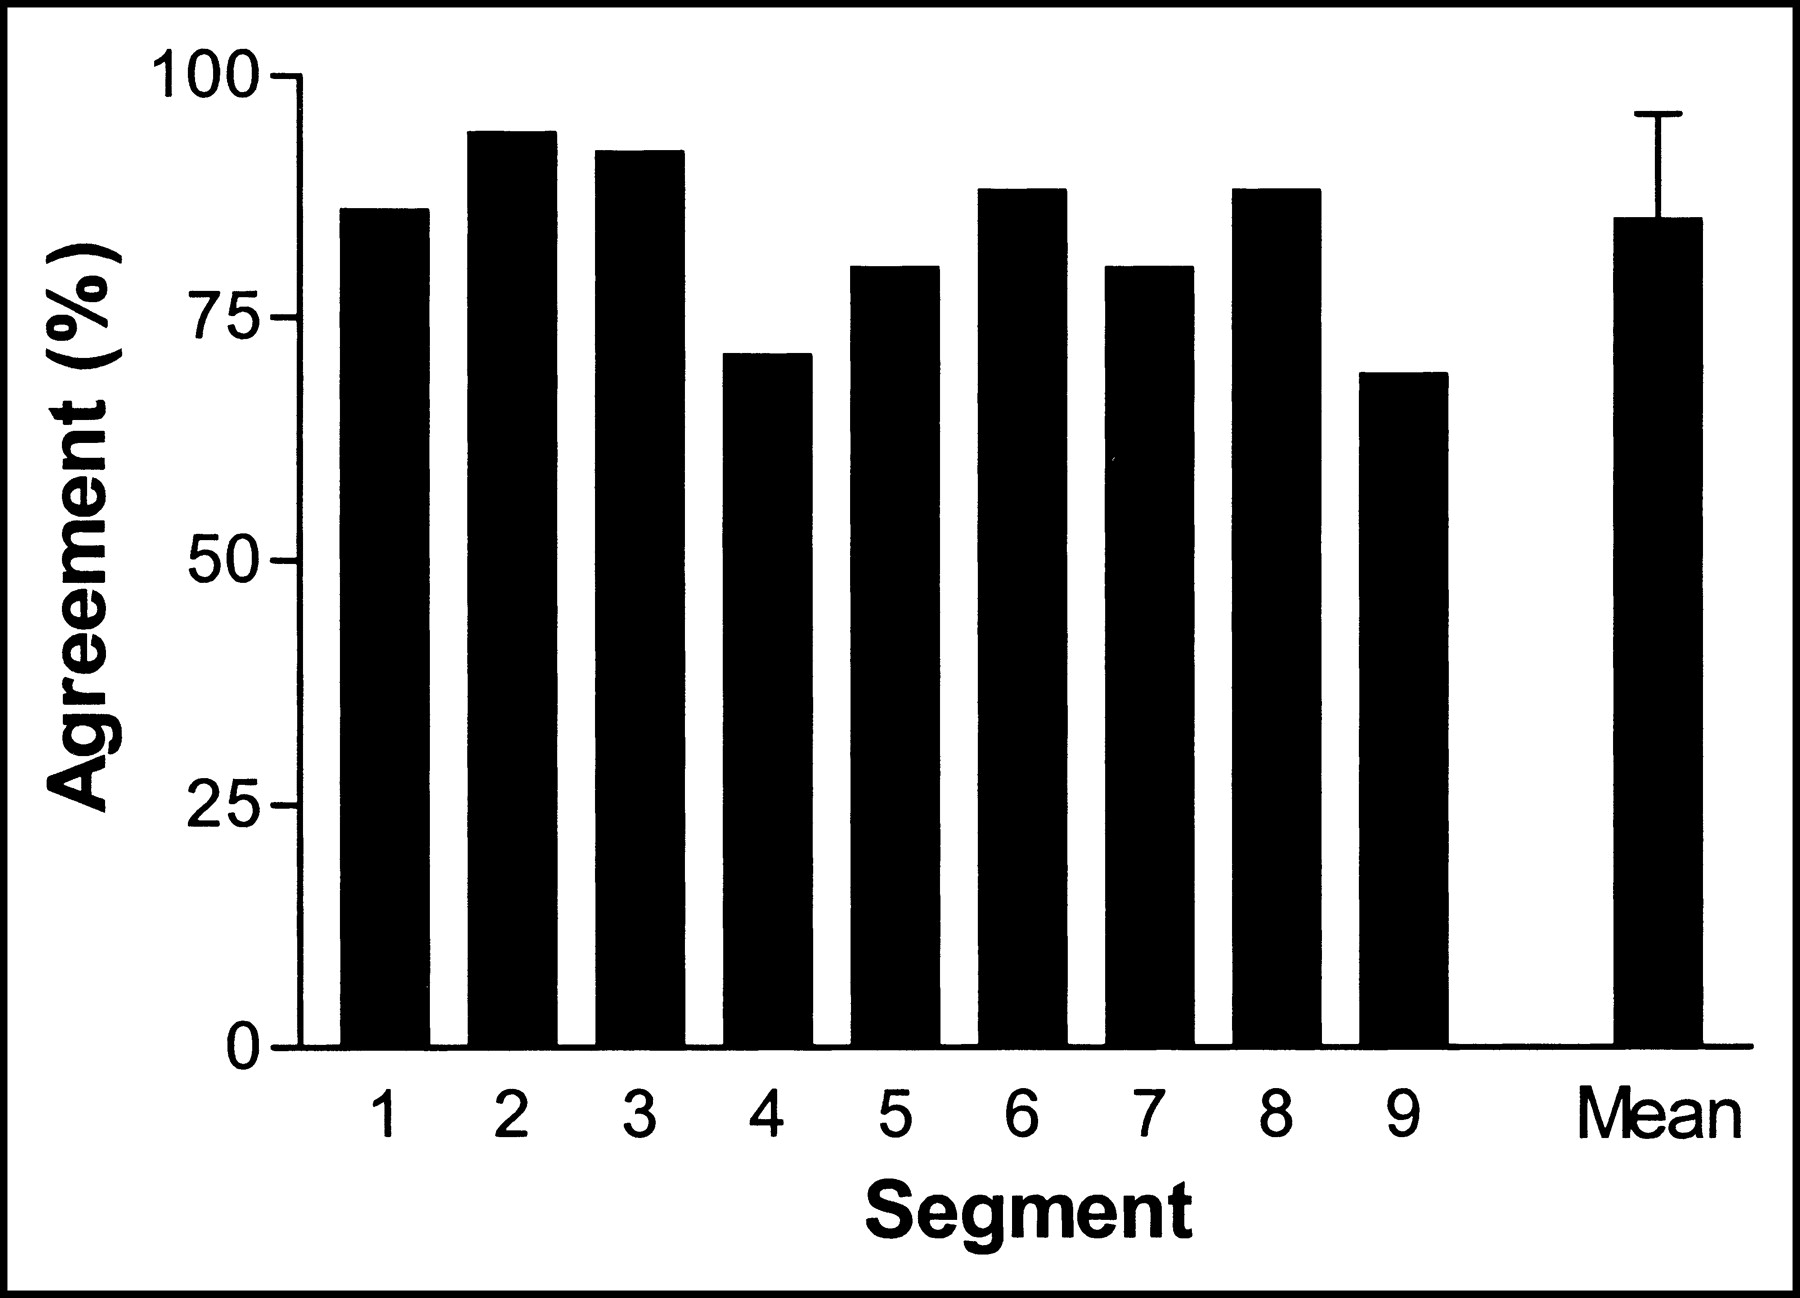
Agreement between regional wall motion scores per segment on MRI and on gated 18F-FDG PET. Basal segments: 1 = anterior; 2 = lateral; 3 = inferior; 4 = septal. Distal segments: 5 = anterior; 6 = lateral; 7 = inferior; 8 = septal. 9 = apical segment. Mean = mean agreement for all 9 segments ± SEE.
LV Volumes and LVEF Evaluated by MRI and Gated PET
The quantitative measurements of LV volumes and LVEF are shown in Table 3. LVESV measured by MRI ranged from 31 to 202 mL (mean, 91 ± 12 mL). The corresponding values for gated PET (range, 24 to 198 mL; mean, 85 ± 51 mL; P = 0.57) were slightly lower but not significantly different from those for MRI. Linear regression revealed a good correlation (y = 0.91x + 2.0; r = 0.94; P < 0.0001) between LVESV measured by MRI and that measured by gated PET (Fig. 5A). The Bland–Altman plot showed a mean ± SEE difference of 12.5 ± 13.5 mL, which was not significantly different from 0 (P = 0.57) (Fig. 5B).
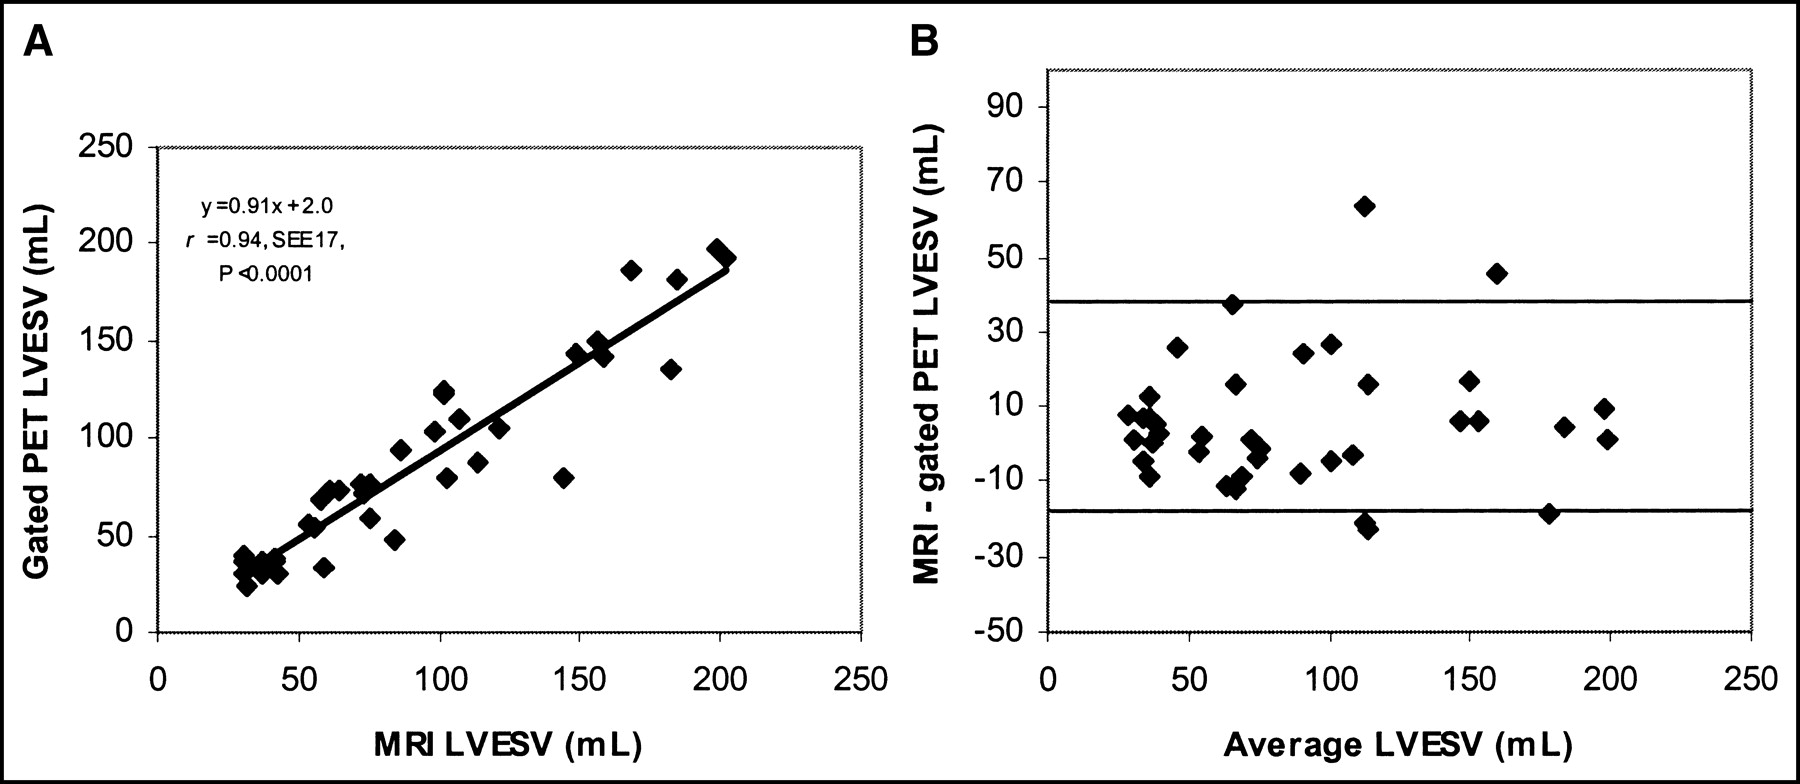
(A) Relationship between LVESV assessed by MRI and gated 18F-FDG PET. (B) Bland–Altman plot for LVESV without a systematic trend.
Measurements of LV Volumes and LVEF by MRI and Gated 18F-FDG PET
LVEDV measured by MRI ranged from 61 to 267 mL (mean, 131 ± 57 mL). The corresponding values for gated PET were lower: LVEDV ranged from 41 to 242 mL (mean, 117 ± 56 mL; P < 0.01). Linear regression demonstrated a good correlation (y = 0.93x + 22.1; r = 0.91; P < 0.001) between LVEDV measured by MRI and that measured by gated PET (Fig. 6A). The Bland–Altman plot showed a mean difference of 19.6 ± 18.7 mL, which was significantly different from 0 (Fig. 6B).
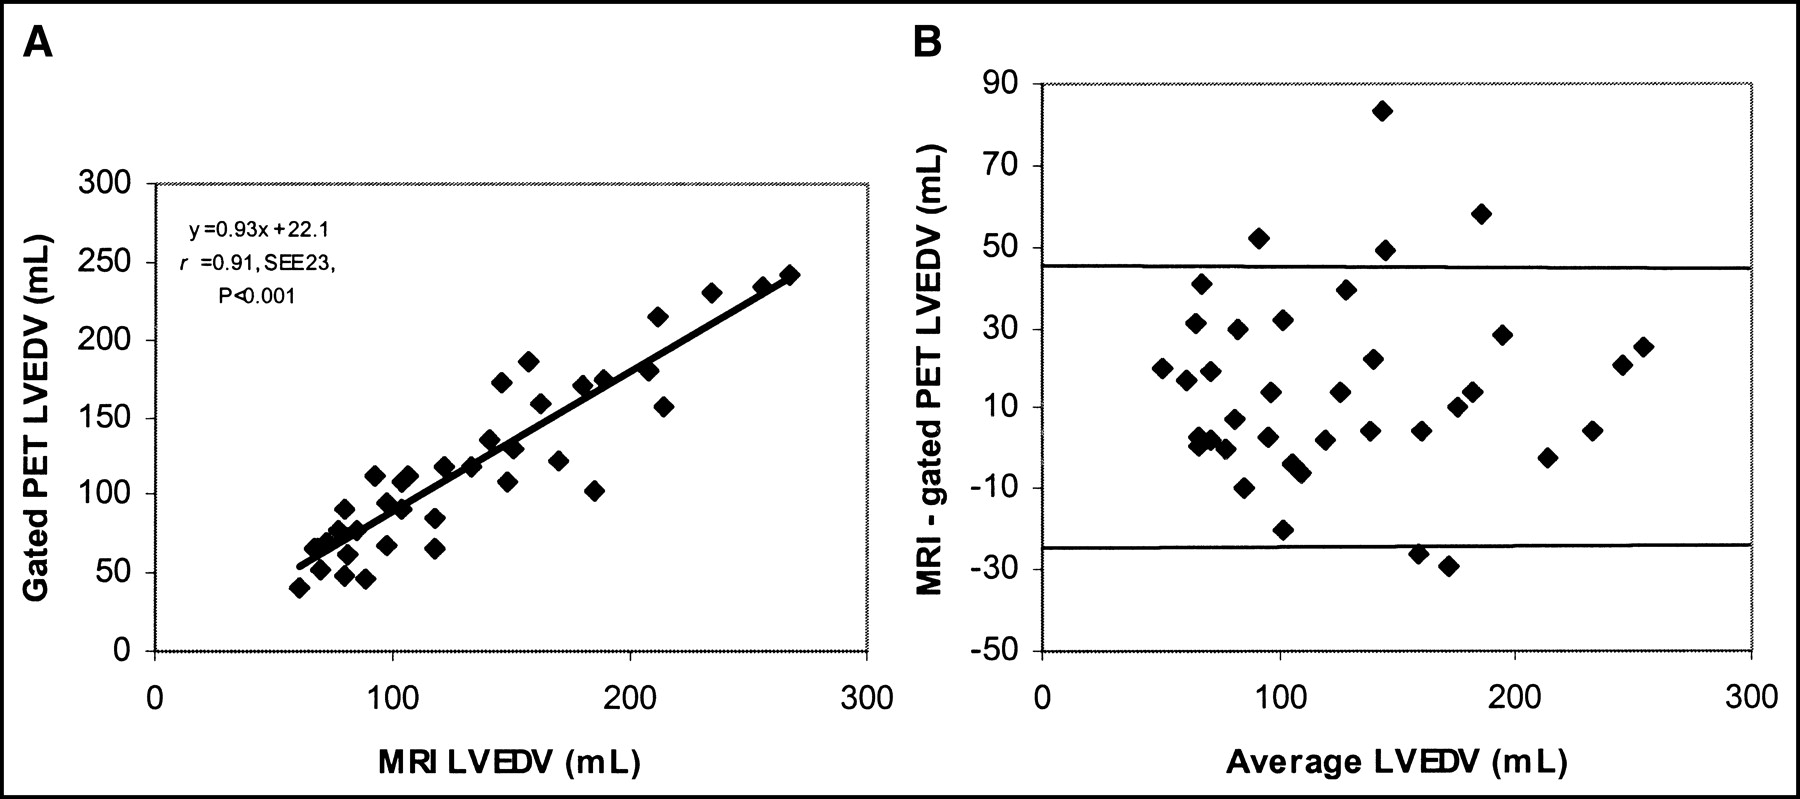
(A) Relationship between LVEDV assessed by MRI and gated 18F-FDG PET. (B) Bland–Altman plot for LVEDV without a systematic trend.
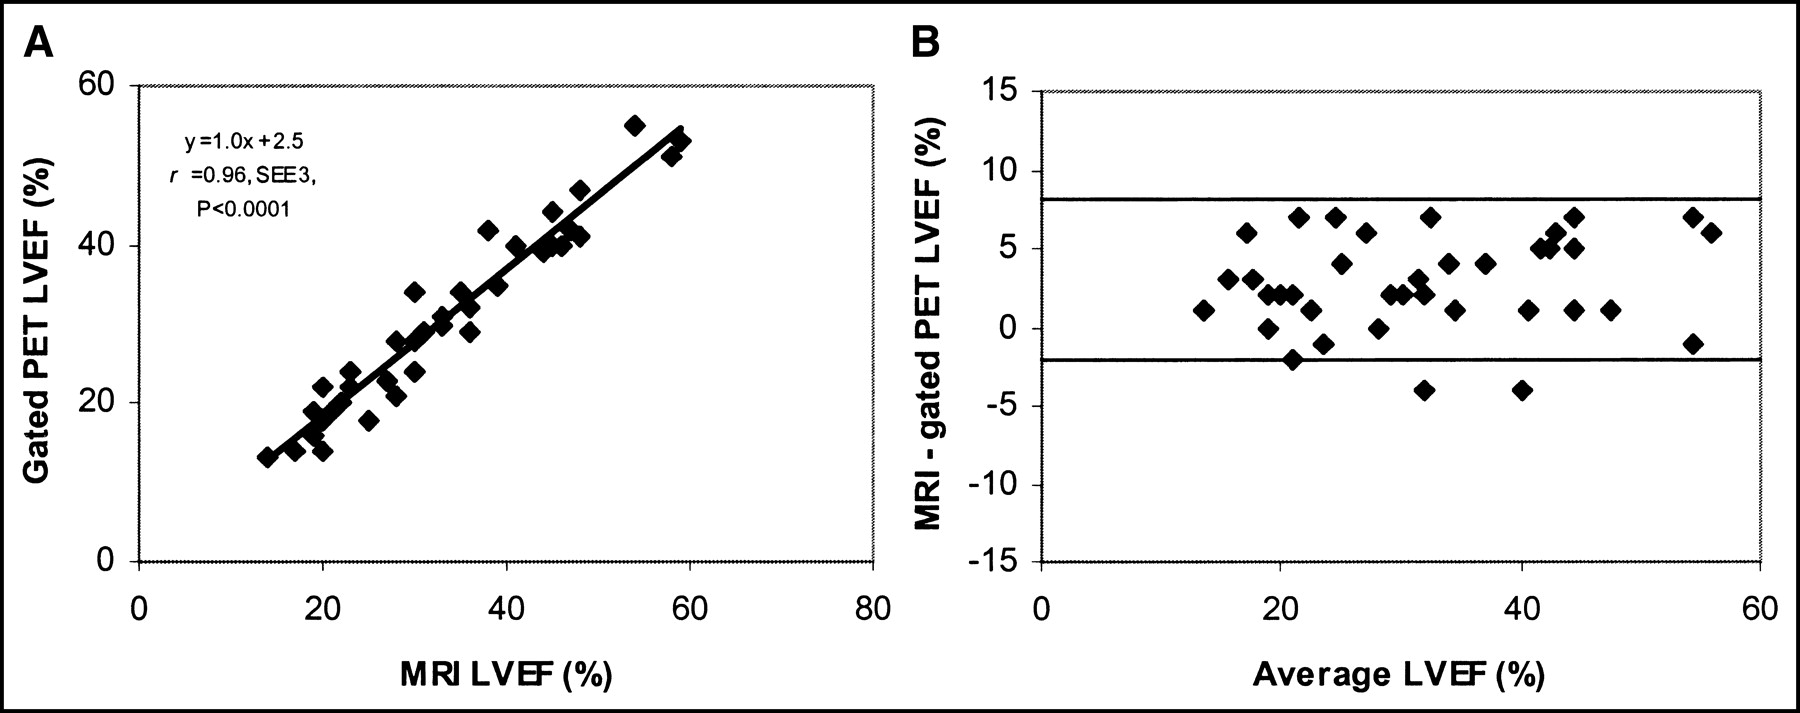
LVEF measured by MRI ranged from 14% to 59% (mean, 33% ± 12%). The corresponding values for gated PET were close to those for MRI but were significantly different: LVEF ranged from 13% to 55% (mean, 30% ± 11%; P < 0.01). The results from the linear regression analysis showed a good correlation (y = 1.0x + 2.5; r = 0.96; P < 0.001) between LVEF assessed by MRI and that assessed by gated PET (Fig. 7A). The Bland–Altman plot for LVEF showed a mean difference of 3.4% ± 2.2%, which was significantly different from 0 (Fig. 7B).

(A) Relationship between LVEF assessed by MRI and gated 18F-FDG PET. (B) Bland–Altman plot for LVEF without a systematic trend.
Variations in LV Volumes and Other Parameters
The relationship among various gated PET parameters and the difference between LV volumes assessed by MRI and those assessed by gated PET were investigated. The underestimation of LVEDV or LVESV by gated PET compared with MRI was not related to the number of akinetic or dyskinetic segments on gated PET or to the total number of segments with absent 18F-FDG uptake (activity, 0%–25%).
DISCUSSION
In this study, good correlations between gated PET and MRI were observed for the parameters regional wall motion, LVESV, LVEDV, and LVEF.
For regional wall motion, the exact agreement between the 2 techniques was 85%. Virtually all differences were within 1 grade of regional wall motion. The largest share of discrepancies between the 2 techniques was attributable to 12 segments with hypokinesia on MRI that were classified as akinetic on gated PET.
The relatively small number of segmental discrepancies may have been attributable to spatial misalignment of segments between the MR and gated PET image volumes. Although segmental analysis is important, a more global analysis also may be relevant as an indication for intervention. From this point of view, it is important to note that the correlation between the summed wall motion scores obtained with the 2 techniques was very good. When individual patients were considered, the mean exact agreement was 85% of all segments per patient (Fig. 4). These data suggest that gated PET provides adequate clinical information on regional wall motion in nearly all patients with depressed LVEF. These results are comparable to those obtained by Vaduganathan et al. (22), who used a similar study protocol to compare gated SPECT and MRI.
Few other studies have compared gated PET and MRI for the assessment of LV function. Waiter et al. (8) compared regional myocardial wall thickening on gated PET at rest versus that on MRI and showed a segmental correlation of 81%. A disadvantage of their visual method of wall thickening scoring is that it may over- or underestimate regional LV function when a segment shows high or low 18F-FDG uptake, respectively.
The correlation in our study between LV volumes measured by gated PET and MRI also was very good, although both LVESV and LVEDV measurements were lower with gated PET than with MRI.
Two possible explanations for this finding can be ruled out: No relationship was found between the underestimation of LV volumes by gated PET and the extent or severity of 18F-FDG defects, and no relationship was found between the extent or severity of regional wall motion abnormalities and the underestimation of LV volumes.
Underestimation of LV volume measurements with gated PET may be attributable to automatic algorithms, differences in the nature of the images, and variances in how algorithms operate. For example, MRI algorithms consider papillary muscles as part of the LV cavity, whereas gated PET algorithms merge papillary muscles into the myocardial wall, thereby reducing the cavity volume. The finding of underestimation of LVESV and LVEF most likely is attributable to the fact that the temporal resolution of gated 18F-FDG PET is lower than that of MRI. Also, the 2D (with septa) imaging characteristics of our PET scanner may result in lower sensitivity than modern instruments in the 3D mode. This 2D system may produce noisy data, which could contribute to the slight underestimation of cardiac volumes. PET data are reconstructed, and the use of different filter sets will influence LV volume measurements, as is also the case with gated SPECT data (23). Patient motion or respiration motion also may influence the determination of LVEF, but appropriate instruction to the patient at least will reduce patient motion.
Despite these differences in LV measurement techniques, the correlations between gated PET and MRI for the assessment of LV volumes, LVEF, and regional wall motion were high.
Schaefer et al. also evaluated LV function and regional wall motion with gated 18F-FDG PET in comparison to MRI for 30 patients and also used QGS for gated 18F-FDG PET quantification (24). They also found high correlations between gated 18F-FDG PET and MRI for LVEDV, LVESV, and LVEF (r = 0.96, 0.97, and 0.95, respectively). They found a total agreement between the techniques for all regional wall motion scoring classifications of 76%, a value lower than our finding of 85%. This small difference may be attributable to the use of 8 gates per cardiac cycle instead of 16.
Willemsen et al. (17) compared the same QGS program (originally developed for gated SPECT), suitable for PET systems, with equilibrium radionuclide angiography (ERNA) for 20 patients with CAD. They observed a high correlation between the QGS program and ERNA for LVEF measurements and a slight underestimation of LVEF (y = −5.9 + 0.90 (ERNA) − ejection fraction; r = 0.86) by gated PET.
Gated PET probably better estimates LVEF, LVEDV, and LVESV as obtained by the standard, MRI, than does gated SPECT (25). This situation probably results from the higher spatial resolution of PET than of SPECT, a fact that minimizes the uncertainty in the exact position of the myocardial wall. In addition, the problem of a small LV volume, common with gated SPECT, is less common with gated PET because of the higher spatial resolution of PET. The algorithm of Germano et al. is based on detection of the myocardial wall from short-axis slices, but the exact wall position is corrected subsequently on the basis of validation studies by means of a segmentation algorithm that has been empirically determined from SPECT studies (16). As gating of SPECT data has added greatly to the clinical value of myocardial SPECT, gating of PET data may contribute even more to the value of PET. LV function estimated by gated PET may be of additional value to observer-dependent ultrasound results. Combining regional wall motion with perfusion or metabolism match and mismatch patterns can be beneficial for interpretation. Gated PET results therefore argue in favor of cardiac PET studies in general.
Other PET techniques, including gated blood-pool PET after red blood cell labeling with C15O, also provide information about LV volumes and function but do not provide information about metabolism (26,27). A major advantage of the gated 18F-FDG PET technique is the integration of the assessments of myocardial metabolism and contractile function. In combination with PET myocardial perfusion imaging, gated 18F-FDG PET permits a complete LV evaluation with a single technique for the evaluation of major clinical parameters, including metabolism, flow reserve, and LV function. Obtaining LV functional information requires no additional scanning time or tracer injection. Therefore, successful assessment of cardiac function by gated 18F-FDG PET without the need for other clinical techniques will reduce significantly the time needed for and the costs of prerevascularization examinations. Also, the single-technique approach inherently has the advantage of very good image alignment, which allows 3D comparison of regional function versus myocardial perfusion and metabolism.
CONCLUSION
Gated 18F-FDG PET permits the assessment of LV volumes, LVEF, and regional wall motion, and all of these parameters correlate well with those determined by MRI. Gated 18F-FDG PET can be performed easily following a dynamic 18F-FDG acquisition protocol, and the data will facilitate the integration of the assessment of myocardial metabolism and contractile function by PET without additional scanning time or patient burden.
Acknowledgments
We gratefully acknowledge Dirk Schuiling and Kai Yiu J.A. Ho for analyzing the MRI studies and Hans Hillege for statistical assistance.
Footnotes
Received Apr. 21, 2003; revision accepted Oct. 23, 2003.
For correspondence or reprints contact: Riemer H.J.A. Slart, MD, Department of Nuclear Medicine and PET-Center, Groningen University Medical Center, Hanzeplein 1, P.O. Box 30001, 9700 RB Groningen, The Netherlands.
E-mail: r.slart{at}nucl.azg.nl


