


Abstract
The aim of our study was to derive and to validate the normal threshold for an automatically measured left ventricular transient ischemic dilation (TID) ratio in patients referred for adenosine stress myocardial perfusion SPECT (MPS) and to assess the value of integrating TID in detecting severe and extensive coronary artery disease (CAD). Methods: Normal limits for the TID ratio were derived using dual-isotope MPS data from 38 patients with a low (<5%) likelihood of CAD. Criteria for abnormality were calculated on the basis of data from 179 consecutive patients who had undergone coronary angiography less than 3 mo after index adenosine MPS: 41 patients (23%) had severe and extensive CAD (≥90% stenosis) in the proximal left anterior descending artery or in 2 or more coronary arteries, 64 (36%) had no significant CAD (<70% stenosis), and 74 (41%) had mild or moderate CAD. The criteria were then prospectively validated in a cohort of 177 patients, of whom 41 patients (23%) had severe and extensive CAD, 55 (31%) had no significant CAD, and 81 (46%) had mild or moderate CAD. Results: By analysis of receiver-operating-characteristic curves, the best threshold for adenosine TID ratio abnormality was the mean adenosine TID ratio in the low-CAD-likelihood patients + 2 SDs (TID ratio > 1.36). Abnormal TID ratio using this threshold demonstrated high sensitivity and specificity for severe and extensive CAD (71% and 86%, respectively), and similar sensitivity and specificity were observed in the prospective validation group (73% and 88%, respectively). In the combined pilot and validation groups, the absence of both abnormal TID ratio and abnormal perfusion was highly specific for the absence of severe and extensive CAD; only one (1.3%) of 79 patients with severe and extensive CAD had neither of these abnormal findings on adenosine MPS. In patients with both abnormal TID ratio and abnormal perfusion, 55 of 84 (65%) had severe and extensive CAD. When patients had one but not both of these findings, 26 of 193 (13%) had severe and extensive CAD. Conclusion: The automatically measured TID ratio is a useful clinical marker that is sensitive and highly specific for identification of severe and extensive CAD in patients undergoing adenosine MPS. Integration of abnormal TID ratio into the dual-isotope MPS image interpretation algorithm improves the identification of severe and extensive CAD in adenosine MPS.
- clinical cardiology
- coronary artery disease
- myocardial perfusion SPECT
- transient ischemic dilation ratio
Transient ischemic dilation (TID) of the left ventricle is a sensitive and highly specific marker for detection of severe and extensive coronary artery disease (CAD) in patients who have undergone exercise dual-isotope myocardial perfusion SPECT (MPS) (1,2) and also is a strong, independent predictor of cardiac events (3,4). Studies have shown that TID and abnormal lung uptake of radioactivity, another marker of prognosis, do not correlate strongly (5,6). In patients undergoing exercise stress dual-isotope MPS (2), a TID threshold > 1.22 was prospectively validated in our laboratory as having the highest sensitivity and specificity for detection of severe and extensive CAD. On the other hand, the threshold of TID in patients undergoing adenosine stress MPS has not been defined.
Patients requiring adenosine stress differ from those who can perform a standard exercise protocol in being older, having more comorbidity, and having a worse cardiac outcome for any MPS finding (5). Although the sensitivity and specificity of perfusion studies with both types of stress are comparable (6–8), the predominant mechanism for perfusion defect abnormality on adenosine MPS is considered to be perfusion heterogeneity without true ischemia. In at least a subset of patients with CAD, however, ischemia develops during adenosine infusion (9,10), but the pathophysiologic mechanisms of inducible ischemia caused by vasodilator stress differ from those of exercise stress.
The purpose of this study evaluating patients undergoing separate-acquisition dual-isotope rest 201Tl/adenosine 99mTc-sestamibi MPS was to define normal limits of an automatically measured TID ratio, assess whether the TID ratio from adenosine MPS is useful for identifying patients with severe and extensive CAD, and evaluate whether assessment of the TID ratio adds to perfusion defect analysis in the detection of severe and extensive CAD in these patients.
MATERIALS AND METHODS
Study Population
The study population comprised 356 patients who had undergone adenosine rest 201Tl/adenosine 99mTc-sestamibi MPS at Cedars-Sinai Medical Center. Patients with prior coronary revascularization (percutaneous coronary intervention or coronary artery bypass grafting), valvular heart disease, or nonischemic cardiomyopathy were excluded, as were patients with a very small left ventricular end-systolic volume (<20 mL by gated SPECT). The clinical characteristics of the patients, categorized into 3 groups, are presented in Table 1.
Clinical Characteristics of Study Population
Normal Limits of TID Ratio (Group 1).
This group comprised 38 patients who had a <5% likelihood of CAD and were evaluated in order to develop normal limits for TID ratio in adenosine dual-isotope MPS (adenosine TID). The likelihood of CAD for patients undergoing adenosine MPS was calculated on the basis of sequential Bayesian analysis of age, sex, and symptom classification (11–13).
Criteria for Abnormality (Group 2).
The optimal normal limits for detecting adenosine TID were assessed in the additional group of 179 consecutive patients who had undergone coronary angiography after and within 3 mo of MPS. Group 2 was further subclassified by extent of angiographic CAD, as previously described (2): Group 2.1 had absence of significant CAD (<70% stenosis in all vessels), group 2.2 had mild to moderate CAD (≥70% but <90% coronary artery stenosis in one or more vessels, or ≥90% stenosis in one vessel, other than the proximal left anterior descending coronary artery [LAD]), and group 2.3 had severe and extensive CAD (≥90% stenosis involving either the proximal LAD [severe and extensive LAD CAD, group 2.3.1] or ≥2 coronary vessels [severe and extensive multivessel CAD, group 2.3.2]).
Prospective Validation (Group 3).
The normal limits and criteria for detection of an abnormal TID ratio were prospectively validated in an additional group of 177 patients who had undergone adenosine MPS and diagnostic coronary angiography (<3 mo after MPS). Group 3 was also subclassified by extent of angiographic CAD, as described for group 2.
Rest Thallium Imaging
Patients were asked to stop taking nitrates for 6 h, calcium-channel blockers for 24 h, and β-blockers for 48 h before MPS. 201Tl (111–167 MBq) was injected intravenously at rest, with dose variation based on patient weight. Rest 201Tl MPS acquisition was started 10 min after radioisotope injection. Patients with extensive resting defects returned the next day for 24-h 201Tl MPS to further assess defect reversibility.
Adenosine MPS Protocol
A standard adenosine stress protocol was used as previously described (14). Patients were instructed not to consume caffeine-containing products for 24 h before the test. Adenosine was infused intravenously at a rate of 140 μg/kg/min for 5 min. 99mTc-sestamibi (740–1,295 MBq) was injected at 2 min of infusion. Whenever possible, low-level exercise (walking on treadmill at no incline and at 1.6–2.7 km/h [1–1.7 mph]) was performed during adenosine infusion. 99mTc-sestamibi MPS acquisition was started approximately 30 min after the radioisotope injection. Heart rate, blood pressure, and a 12-lead electrocardiogram were recorded at baseline and every minute thereafter for at least 5 min. The electrocardiogram was monitored continuously (leads aVF, V1, and V5) for development of arrhythmia or ST-segment deviation. Blood pressure was measured from the arm contralateral to the adenosine infusion site.
SPECT Acquisition Protocol
SPECT was performed as previously described (15). The SPECT studies were performed using a circular or elliptic 180° acquisition for 64 projections at 25 s per projection for 99mTc-sestamibi and 35 s per projection for 201Tl. For 201Tl imaging, 2 energy windows were used, including a 30% window centered on the 68- to 80-keV peak and a 10% window centered on the 167-keV peak. For 99mTc-sestamibi SPECT, a 15% window centered on the 140-keV peak was used. Images were acquired using a 64 × 64 image matrix and were subject to quality control measures as previously described (16). No attenuation or scatter correction was used. Filtered backprojection used Butterworth filters (order/cutoff frequency = 2.5/0.3 cycles per pixel for 99mTc and 5.0/0.25 cycles per pixel for201Tl; pixel size = 0.53–0.64 cm).
Image Interpretation
Semiquantitative visual interpretation was performed using 20 segments of the short-axis and vertical long-axis myocardial tomograms of the left ventricle. These segments were assigned to 6 evenly spaced regions in the apical, midventricular, and basal slices of the short-axis views and 2 apical segments on the midventricular long-axis slice (17). Each segment was scored using a 5-point system (0 = normal, 1 = equivocal, 2 = moderate, and 3 = severe reduction of radioisotope uptake; 4 = absence of detectable tracer uptake in a segment). The summed stress scores were obtained by adding the scores of the 20 segments of the respective images (17). This variable incorporates the extent and severity of perfusion defects, which independently add prognostic information (18,19). This index was converted to a percentage of the total myocardium hypoperfused at stress (%Myo) (19,20), by dividing the summed stress scores by 80, the maximum potential score in the 20-segment model (4 × 20), and multiplying by 100. On MPS, less than 5 %Myo was considered normal, 5–10 %Myo mildly abnormal, 11–15 %Myo moderately abnormal, and >15 %Myo severely abnormal (20). We previously demonstrated that this approach provides comparable prognostic information whether applied to 20- or 17-segment systems (21). Visual assessment of TID used a 0–3 visual score (0 = none, 1 = equivocal, 2 = definite but moderate, and 3 = severe), with ≥2 being considered abnormal (2).
Quantitative Measurement of TID Ratio
For calculation of TID ratio, we used a commercially available automated program (Quantitative Perfusion SPECT, QPS; Cedars-Sinai Medical Center) capable of estimating 3-dimensional image volumes from gated or ungated SPECT studies (2). The algorithm operates in 3-dimensional space and uses the stress and rest short-axis image sets. For TID assessment, the algorithm operates on the summed gated data, the same data used to assess perfusion defects. After calculation of the endocardial volumes (bounded by the endocardial surface and the valve plane), it derives the TID ratio as the ratio of left ventricular cavity volumes at stress to those at rest. The program can generate a surface contour even in the apparent absence of perfusion by using smoothness, the isocontours of the coordinate system, and the geometry of the defect boundaries as constraints. The automatic computations were adjusted manually if left ventricular cavity segmentation was unsuccessful.
Statistical Analysis
Patient groups were compared using a t test for continuous variables and a χ2 test for categoric variables. All continuous variables are described as mean ± SD. A P value < 0.05 was considered statistically significant and was adjusted for multiple comparisons when appropriate.
To determine the criteria of abnormality for the adenosine TID ratio, analysis of receiver-operating-characteristic curves was applied as previously described (2) to assign the best cutoff point for correct identification of severe and extensive CAD.
RESULTS
Normal Limits of Adenosine TID Ratio and Criteria for Abnormality
We expressed the normal limits of the adenosine TID ratio as the mean and SD of the TID ratio in patients with a low likelihood of CAD (2). We found adenosine TID to be 1.18 ± 0.09 in group 1. By receiver-operating-curve analysis in group 2, the area under the receiver-operating curve for the prediction of severe and extensive CAD was 0.813 (P < 0.001), and the best threshold for adenosine TID ratio abnormality was the mean value in low-likelihood patients + 2 SDs (TID ratio > 1.36).
Relationship Between Abnormal TID Ratio and Presence of Severe and Extensive CAD
Pilot Group 2.
As shown in Figure 1, the increase in TID ratio paralleled the increase in severity and extent of CAD. The TID ratio was 1.21 ± 0.16 in patients without angiographically significant stenoses (group 2.1, 64 patients), 1.20 ± 0.16 in patients with mild or moderate CAD (group 2.2, 74 patients), 1.44 ± 0.22 in patients with severe and extensive LAD CAD (group 2.3.1, 21 patients), and 1.46 ± 0.21 in patients with severe and extensive multivessel CAD (group 2.3.2, 20 patients) (P < 0.001 across the groups). An abnormal (>1.36) TID ratio was measured in 28 of 41 group 2.3 patients, resulting in an overall sensitivity of 68% for detection of severe and extensive CAD. The TID ratio was abnormal in 15 (71%) of 21 group 2.3.1 patients and 13 (65%) of 20 group 2.3.2 patients.

Relationship between TID ratio and presence and extent/severity of CAD in group 2 patients (pilot group). Mean ± SD is shown at right of value for each group. Reference line is normal upper limit for TID ratio in adenosine dual-isotope MPS. LK = likelihood; mod = moderate; multiCAD = CAD in more than 1 vessel; no CAD = absence of significant CAD (<70% stenosis in all vessels); S+E = severe and extensive.
A normal (≤1.36) TID was measured in 118 of the 138 patients of groups 2.1 and 2.2, resulting in a specificity of 86% for excluding severe and extensive CAD. The TID ratio was normal in 54 (84%) of 64 group 2.1 patients and 64 (86%) of 74 group 2.2 patients. Figure 1 also shows the normalcy rate calculated for the 38 group 1 patients with a low likelihood of CAD. The high normalcy rate of 97% (37/38 patients) was in line with the high overall specificity of this variable.
Validation Group 3.
As shown in Figure 2, TID ratio was 1.17 ± 0.16 in patients without angiographically significant stenoses (group 3.1, 55 patients), 1.19 ± 0.16 in patients with mild or moderate CAD (group 3.2, 81 patients), 1.43 ± 0.17 in patients with severe and extensive LAD disease (group 3.3.1, 23 patients), and 1.43 ± 0.21 in patients with severe and extensive multivessel CAD (group 3.3.2, 18 patients) (P < 0.001 across the groups). An abnormal (>1.36) TID ratio was measured in 30 of 41 group 3.3 patients, for an overall sensitivity of 73% for detecting severe and extensive CAD. The TID ratio was abnormal in 17 (74%) of 23 group 3.3.1 patients and 13 (72%) of 18 group 3.3.2 patients.

Relationship between TID ratio and presence and extent/severity of CAD in group 3 patients (validation group). Mean ± SD is shown at right of value for each group. Reference line is normal upper limit for TID ratio in adenosine dual-isotope MPS. Mod = moderate; multiCAD = CAD in more than 1 vessel; no CAD = absence of significant CAD (<70% stenosis in all vessels); S+E = severe and extensive.
A normal (≤1.36) TID was measured in 119 of the 136 patients of groups 3.1 and 3.2, for an overall specificity of 88% for excluding severe and extensive CAD. The TID ratio was normal in 47 (85%) of 55 group 3.1 patients and 72 (89%) of 81 group 3.2 patients. The comparison between the pilot and validation groups with respect to mean (± SD) TID ratio for the detection of severe and extensive CAD showed no significant difference overall or in any subanalysis.
In the patients of groups 2 and 3 combined, visual assessment of left ventricular TID resulted in a lower sensitivity for the detection of severe and extensive CAD (36 [44%] of 82 patients, P < 0.001) but similar specificity (246 [90%] of 274 patients, P < 0.284), compared with an automated cutoff of >1.36 for abnormal TID ratio.
Abnormal TID Ratio and Detection of CAD (≥70% Stenosis)
For detection of any CAD (any vessel with ≥70% stenosis, as opposed to detection of severe and extensive CAD), the TID ratio demonstrated a sensitivity of 32% (77 of 238 patients) and a specificity of 85% (100 of 118 patients) in the pilot and validation groups combined. In these patients, visual perfusion assessment (≥5 %Myo = abnormal) showed a sensitivity of 87% (206 of 238 patients) and a specificity of 49% (58 of 118 patients).
Detection of Severe and Extensive CAD: Comparison of TID Ratio with Other Markers in Patients Undergoing Adenosine MPS
Figure 3 shows the relationship between adenosine TID and the extent of perfusion abnormality as measured by %Myo in the patients of groups 2 and 3 combined. A significant relationship between these variables was observed. Only 12.2% of patients with normal MPS results had an abnormal TID ratio, compared with 28.2%, 29.4%, and 40.3% of patients with mildly, moderately, and severely abnormal MPS results, respectively. In patients with an abnormal TID ratio and abnormal perfusion, 38.9% had a mild MPS abnormality (5–10 %Myo) and 61.1% had more extensive perfusion defects. The TID findings were further assessed in the patients with normal MPS perfusion results in whom clinically significant CAD was not predicted. In this regard, 11 of 90 patients with normal MPS results demonstrated an abnormal TID ratio; of these, 7 of 11 (64%) had severe and extensive CAD (3 patients) and 4 had moderate CAD (2 had moderate proximal LAD disease, 1 had a moderate mid-LAD stenosis, and 1 had 50% proximal 3-vessel CAD and a 100% circumflex occlusion). TID ratio was abnormal in 37 of 131 patients with mildly abnormal perfusion by MPS (5–10 %Myo); of these, 16 had severe and extensive CAD, and an additional 9 had multiple vessels with >70% stenosis. These findings show that the assessment of TID adds to the assessment of perfusion defects alone in identification of patients with advanced CAD.

Relationship between TID ratio and %Myo. χ2 = 15.2; P = 0.002.
The relationship between abnormal TID ratio and abnormal MPS results (≥5 %Myo) as a function of the degree of CAD by coronary angiography in the combined study population (groups 2 and 3) is shown in Figure 4. The frequency of the 2 nuclear variables differed significantly in each angiographic subset; furthermore, the presence of an abnormal TID ratio was more specific for the identification of severe and extensive CAD disease (P < 0.001) than was the presence of abnormal MPS results, and conversely, abnormal perfusion demonstrated higher sensitivity than did abnormal TID ratio (P = 0.01).

Comparative relationship between abnormal TID ratio (open bars) and abnormal MPS (≥5 %Myo, solid bars) as a function of CAD severity by coronary angiography. Mod = moderate; multiCAD = CAD in more than 1 vessel; no CAD = absence of significant CAD (<70% stenosis in all vessels); S+E = severe and extensive; *P = 0.01; **P < 0.001.
Integration of TID Ratio and Perfusion Data to Detect Severe and Extensive CAD
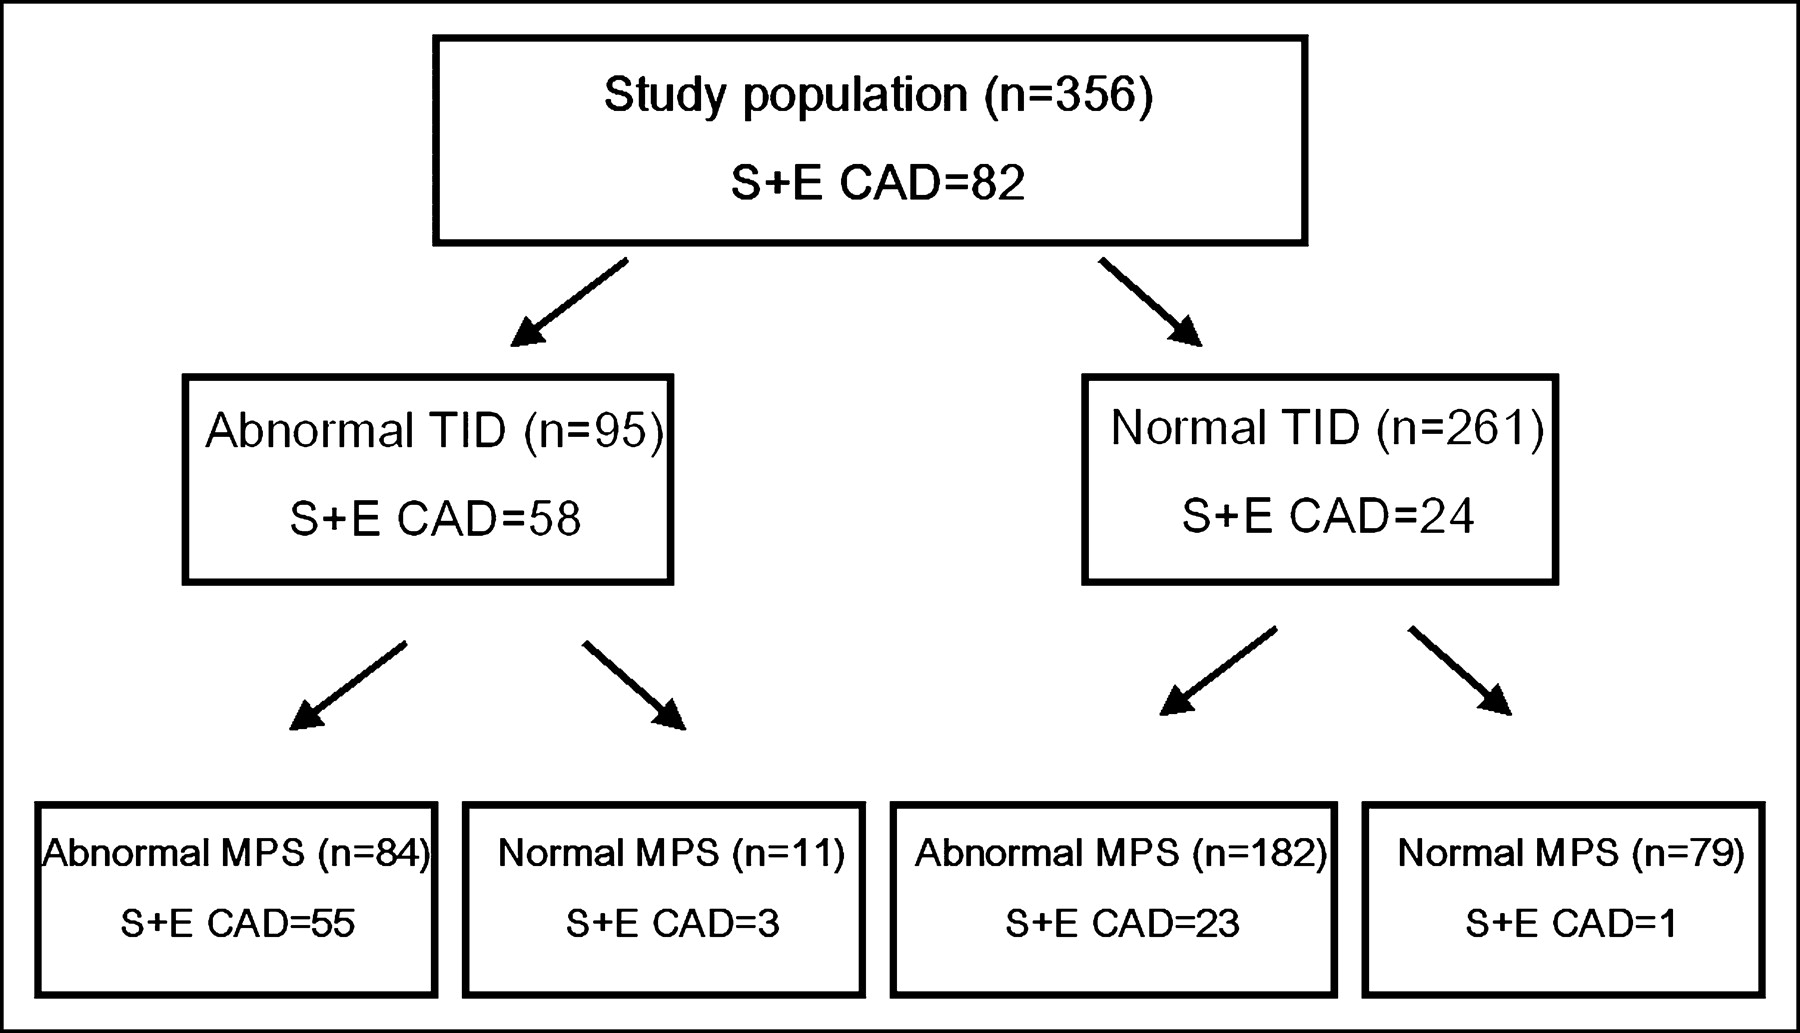
When abnormal TID ratio (>1.36) and abnormal perfusion (≥5 %Myo) criteria were applied to our combined groups 2 and 3, abnormality of both TID ratio and MPS results was found in 84 of the 356 patients, of whom 55 (65%) had severe and extensive CAD (Fig. 5). These 55 patients represented 67% of the 82 patients with severe and extensive CAD in the overall population. Of the 79 patients with neither abnormal TID ratio nor abnormal MPS results, only 1 (1.3%) had severe and extensive CAD. In the 193 patients with either abnormal TID ratio or abnormal MPS results but not both, 26 (13%) had severe and extensive CAD.

Distribution of patients with severe and extensive CAD as a function of abnormal TID ratio (TID > 1.36) and abnormal MPS (≥5 %Myo) in study population. Shown within each box are total number of patients (n) and number of patients with severe and extensive CAD (S+E CAD).
DISCUSSION
Our findings demonstrate that the automatic measurement of TID ratio in adenosine dual-isotope MPS is a clinically useful marker for detection of severe and extensive CAD. In the current study, we derived and prospectively validated normal limits for automatically measured TID ratio in a population of patients undergoing adenosine MPS. Our finding of an upper normal limit of 1.36 confirms previous preliminary work by Williams and Schnieder, who reported an upper normal limit of 1.35 for TID assessment from dual-isotope MPS (22). We found that this cutoff was associated with a high normalcy rate (97%) in patients with a low pretest likelihood of CAD.
To the best of our knowledge, the current study is the first to demonstrate that an abnormal TID ratio in patients undergoing adenosine MPS effectively shows that they have severe and extensive CAD. An abnormal TID ratio had high specificity (87%) and relatively high sensitivity (71%) for severe and extensive CAD, despite the clinically inhomogeneous population of patients in our study. Of note, although visual assessment was as specific as the automatic quantitative TID assessment, the sensitivity of visual TID assessment for detection of severe and extensive CAD in the study population was significantly lower (44%, P < 0.001) than the sensitivity of automatic analysis.
Differences in and Mechanisms of TID Phenomenon as Function of Type of Stress
The method for TID assessment uses ungated volumes and has done so since the initial description of this finding. These volumes have been shown to be highly reproducible (23). The ungated volumes represent an average between end diastole and end systole, weighted more to end systole. As such, the volumes associated with this measurement should not be considered to represent either end-systolic or end-diastolic volumes alone but rather a complex average of the two.
Several pathophysiologic mechanisms are likely to be responsible for TID. When we observed TID with exercise stress, we initially postulated that the mechanism of true TID was dilation of the left ventricle during stress and throughout the poststress MPS (1). We suggested that this sign implied extensive CAD producing enough ischemia to cause overall ventricular enlargement and severe CAD such that the stress-induced ischemia produced stunning of the left ventricle, prolonging the return of normal ventricular function and size. We demonstrated that this phenomenon was associated with severe and extensive CAD (1,2).
Another pathologic mechanism for exercise TID is apparent (as opposed to true) TID caused by nonvisualization of an extensive amount of the subendocardial myocardium after stress in the presence of severe stress-induced ischemia/hypoperfusion (24–27). Which of these mechanisms is predominant with exercise stress remains controversial.
Although the same mechanisms of TID may be operative with vasodilator stress, their relative importance may be different. Adenosine and dipyridamole cause maximal vasodilation of the coronary microvasculature (28), with a reduction in aortic perfusion pressure. In the presence of significant coronary stenoses, this causes a shift in blood flow from the subendocardium to the outer layers of the left ventricular wall (29). This steal effect causing subendocardial hypoperfusion rather than true cavity dilation may be the most common source of TID in vasodilator stress. In support of this concept, recent published data (30) demonstrated that in patients with classic syndrome X (with normal MPS in most), cardiac MRI revealed subendocardial hypoperfusion after intravenous administration of adenosine.
In our study population, the upper normal limit for the TID ratio was higher than we previously found with exercise stress. This may be related to a physiologic steal to the subendocardium or to true increases in left ventricular cavity size, occurring in the absence of perfusion abnormality, for reasons that are not yet understood (31). Cardiac MRI, with its high resolution and ability to define the presence of subendocardial ischemia as well as accurate chamber volumes, may be helpful in elucidating the prevalence and relative importance of these mechanisms of TID with vasodilator stress.
Comparison with Previous Studies
TID of the left ventricle has been found to be a marker of multivessel CAD in myocardial perfusion studies performed during both exercise (1,2) and pharmacologic stress (1,2,24,25,32,33). Regarding adenosine MPS, Iskandrian et al. demonstrated in 1990 that the apparent enlargement of the left ventricle with adenosine stress was mostly due to an increase in cavity dimension: They demonstrated that a 30% increase between stress and rest in manually drawn endocardial dimensions was seen in patients with CAD but not in healthy individuals (24). Most of these studies were based on visual identification of TID. With exercise stress, Peace et al. found that TID in 99mTc-tetrofosmin MPS, measured by 6 different algorithms, is an indicator of severe CAD and that all existing algorithms provided a repeatable, quantitative measure of TID (34). In the present and previous studies, an abnormal TID ratio correlated better with the presence of multivessel CAD than did multiple perfusion abnormalities/visual summed perfusion scores (1,2,25). We have also previously shown that the automatically measured TID ratio, with either adenosine or exercise stress, has an important prognostic meaning even in patients with entirely normal myocardial perfusion (4). However, none of these measures has previously been assessed for the diagnostic value of abnormal TID ratio in patients with adenosine dual-isotope MPS, and the criteria for abnormality of automatically measured TID ratio for adenosine dual-isotope MPS have not been defined.
In the present study, we intentionally applied the same methodologic approach that we previously reported for TID with exercise MPS, including the same definitions of the clinical subgroups and the same reporting form of the study results, to be consistent with our previous publication (2). We found that the normal limit for TID ratio is higher in the adenosine stress population than in the exercise stress population (1.36 vs. 1.22, respectively). When this TID cutoff was tested in the pilot group, we found a sensitivity and specificity of 68% and 87%, respectively, for the detection of severe and extensive CAD. In the validation group, sensitivity and specificity were 73% and 88%, respectively, for an abnormal TID ratio. These results did not differ statistically and were close to those demonstrated for the exercise stress population (71% and 95%, respectively). The normalcy rate among low-likelihood patients undergoing adenosine stress also was as high (97%) as was found in our previous report (2) for the exercise stress population (98%).
An abnormal TID ratio provided a similar but somewhat lower overall sensitivity and specificity for the detection of any CAD ≥ 70% for the adenosine stress population (32% and 85%, respectively) compared with what was previously found for the exercise stress population (40% and 100%, respectively). The sensitivity and specificity of the visual perfusion score (as defined by ≥5 %Myo) for the detection of any CAD ≥ 70% was similar in both populations (87% and 49%, respectively, for the adenosine stress population vs. 92% and 35%, respectively, for the exercise stress population).
The frequency of an abnormal TID ratio was found to be the same for the overall adenosine stress population of the present study (27%) as for the exercise stress population described in the earlier report (33%) and was higher than previously reported for the vasodilator stress population (9%–14%) (3,33). This difference might reflect a clinical difference in the study populations; however, most probably the difference is secondary to the use of visual analysis in the previous studies. This visual assessment is highly subjective, especially for the dual-isotope studies used. The totally automatic method for assessing left ventricular volumes that was applied in our studies eliminates this subjectivity, as well as observer variability. Of note, in the present and previous studies, we demonstrated that automatically measured TID ratio has significantly higher sensitivity than, and the same specificity as, visually estimated TID for the detection of severe and extensive CAD both in vasodilator and regular exercise stress populations.
Clinical Implications
The present results demonstrated that, compared with visual myocardial perfusion scores alone, integration of abnormal TID ratio in the MPS interpretation substantially improved identification of severe and extensive CAD in the adenosine stress population. Automatically measured TID ratio was a clinically useful sensitive and specific marker of severe and extensive CAD in patients undergoing adenosine dual-isotope MPS. Combining the assessments of the TID ratio and perfusion defects (Fig. 6) enhanced the diagnostic ability of MPS to identify patients with severe and extensive CAD. We propose an MPS image interpretation algorithm for detection of severe and extensive CAD that would start (after the standard quality control measures) with identification of patients with abnormal (>1.36) TID and then those who have perfusion abnormality (≥5 %Myo). If both markers are positive, patients have a high likelihood of severe and extensive CAD and should be strongly considered for coronary angiography and possible revascularization. If both markers are negative, patients have a low probability of severe and extensive disease and might be candidates for medical management without coronary angiography. Patients who have one marker positive have an intermediate likelihood of severe and extensive CAD necessitating consideration of additional information. Of note, although severe and extensive CAD might be present in patients with TID without perfusion defect (3/11 patients in this category had severe and extensive CAD and 7/11 had advanced angiographic CAD in our study), the finding may represent a normal physiologic process not yet understood. Of course, when considering the need for coronary angiography and possible revascularization, in addition to assessing TID and myocardial perfusion patterns one should take into account all diagnostic information (severity and extent of adenosine-induced hypoperfusion, electrocardiographic changes, other ancillary markers, clinical and hemodynamic data) to estimate the risk of a patient’s having severe underlying coronary pathology.
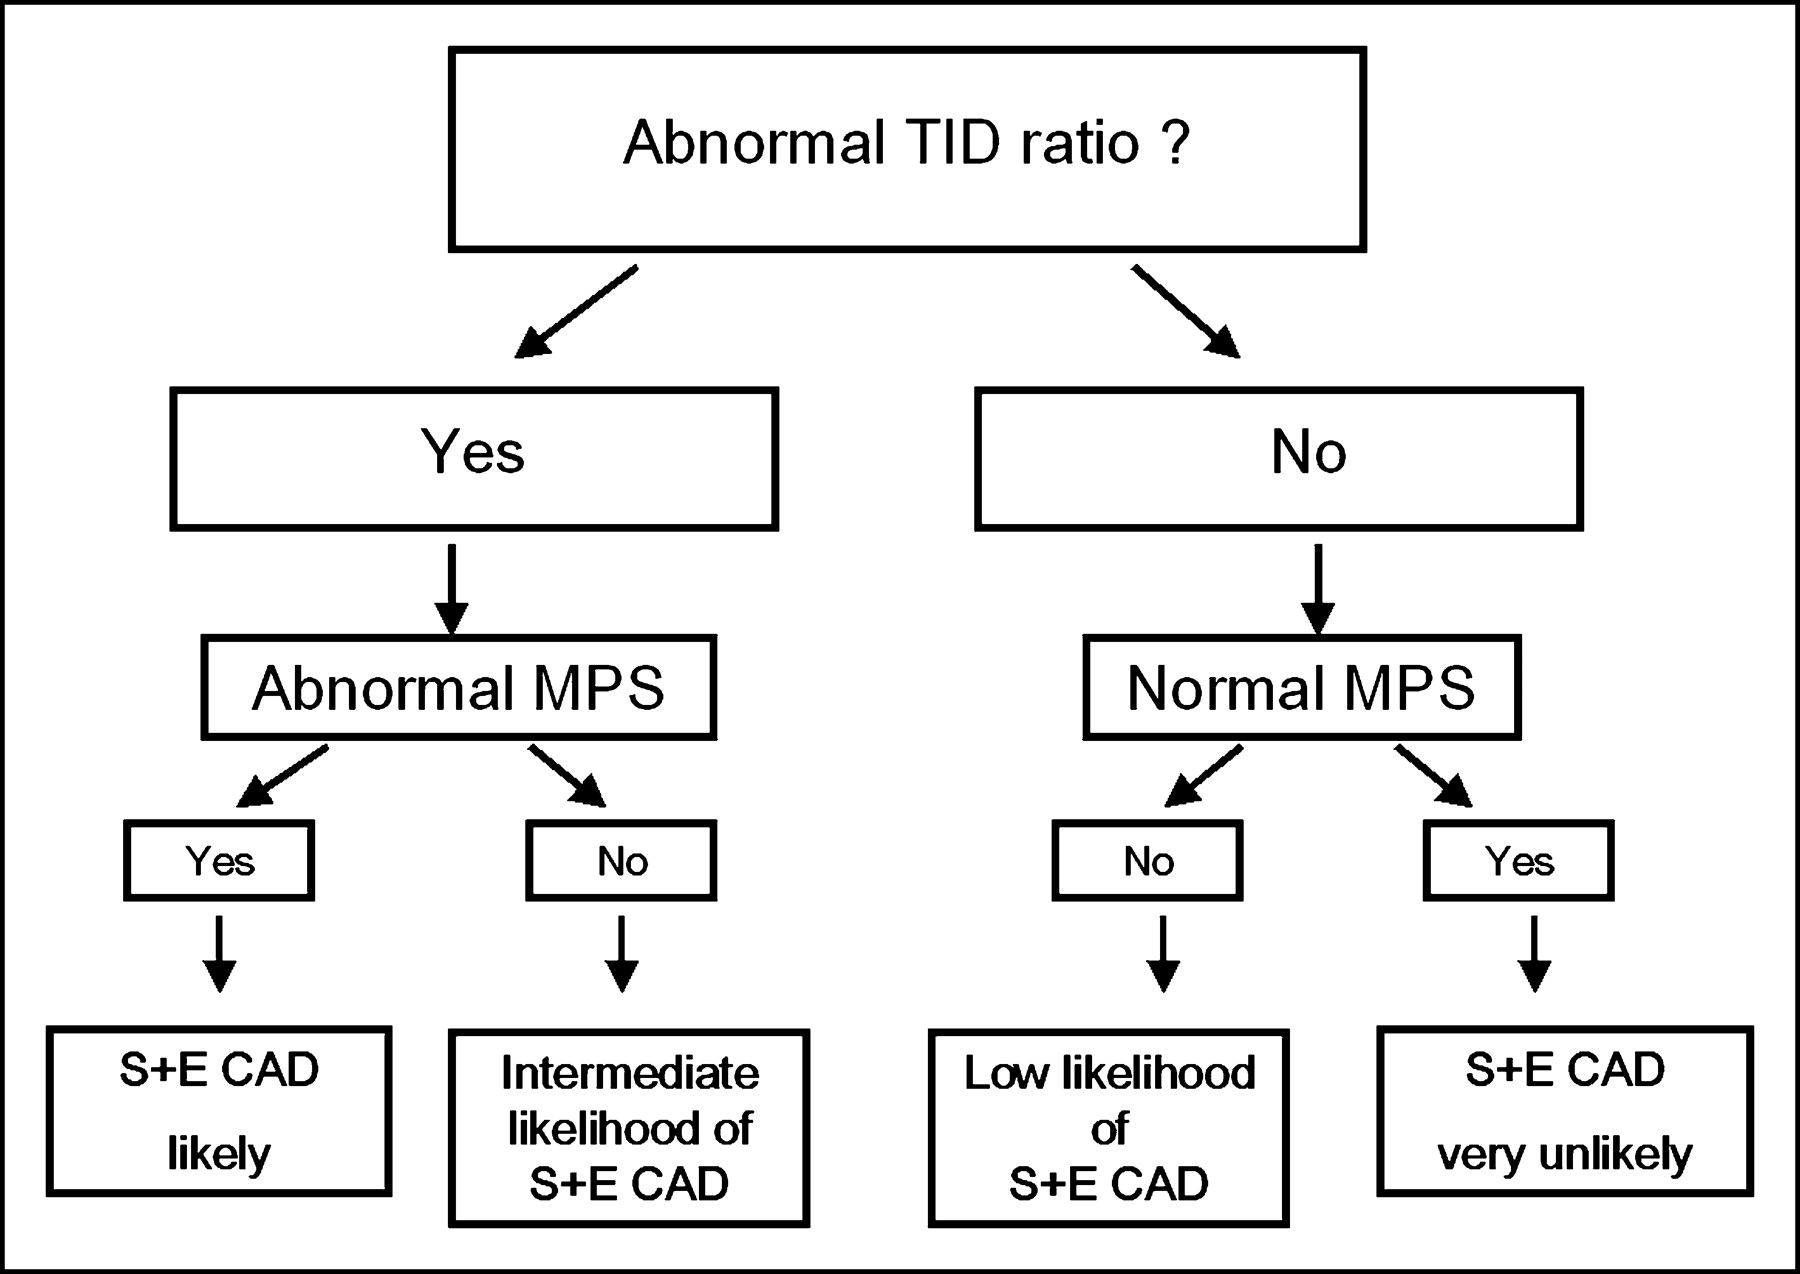
Clinical algorithm for implementing combined assessment of perfusion and TID in patients undergoing adenosine MPS. Note that consideration of extent and severity of perfusion defects, not included in this simplified algorithm, is also incorporated clinically for identification of patients with severe and extensive CAD.
Limitations
The present study used different radionuclides to produce the rest and stress images, adding complexity to the comparison of stress and rest volumes. However, by using protocol-specific normal limits that take into account the tracer differences, this and our previous studies have shown that the automatically determined TID ratio is effective in identifying severe and extensive CAD in dual-isotope studies (2). If applied to single-radionuclide studies, the cutoff for an abnormal TID ratio might be lower, as suggested by preliminary data of others (35), but the mechanisms likely to be operative in this study should still apply.
However, the specific threshold for considering TID to be present will vary according to the specific MPS protocol being used. With the dual-isotope MPS used in this study, the normal range is considerably greater than 1.0, principally because of the increased radionuclide scatter associated with the lower-energy 201Tl photon. With protocols using a single radionuclide, this ratio has been shown to be closer to 1.0; however, it would be expected to be higher with a low-dose rest/high-dose stress protocol than with a 2-d equal-dose protocol, because of the smoother filter associated with the low-dose study. Given these considerations, the cutoff of 1.36 for adenosine TID reported in this article should be considered protocol specific.
Although automated TID calculations using different software methods have been shown to be similar (34), the data presented in this paper apply to the TID ratio derived using QPS software; further studies would be required to determine whether these results apply to other software programs. The method for TID assessment used ungated volumes, representing a complex combination of end-diastolic and end-systolic volumes, which have been extensively validated. Although the ungated volumes have been shown to be reproducible (23), validation of the actual volumes of the ungated studies used in the TID measurement has not been addressed. Even with gating, the method of assessment of volumes is not accurate in patients with small left ventricles; for this reason we excluded the patients with end-systolic volume < 20 mL in both the normal-limit-development and the validation populations. The results of analysis of ventricular function (regional and global) from gated SPECT were not assessed and might have added information toward the identification of severe and extensive CAD. The degree to which TID assessment adds to the combined assessments of perfusion and function from gated SPECT has not yet been addressed.
The TID assessment of this study was based on global volumes. Regional TID assessment, potentially occurring without global TID, would be of interest to explore as a marker of severe CAD; this assessment, however, is not now part of the software used in this study. The boundaries of the left ventricle underlying the automatic method for assessment of TID do not always accurately reflect the true ventricular borders. If patient motion or other technical error has occurred, the calculations of TID may be in error. At times, the automatic algorithm for defining the ventricular boundaries fails, requiring manual adjustment of the limits defining the left ventricular region of interest, from which reprocessing with the automatic boundary selection then proceeds. In some patients, particularly in the setting of end-systolic volume < 20 mL, accurate TID assessment is not possible with the algorithm even with manual intervention, because of the limited resolution of MPS.
CONCLUSION
The automatically measured left ventricular TID ratio is a useful clinical marker that is highly specific and relatively highly sensitive for identification of severe and extensive CAD in patients undergoing separate-acquisition rest 201Tl/adenosine 99mTc-sestamibi MPS. Integration of abnormal TID ratio into the standard algorithm for interpreting myocardial perfusion images appears to improve the detection of severe and extensive CAD in adenosine MPS over assessment of perfusion defects alone.
Acknowledgments
This work was supported in part by grants from Bristol-Myers Squibb Medical Imaging, Inc., and Fujisawa Healthcare, Inc. Aiden Abidov is a Save-A-Heart Foundation, Inc., research fellow at Cedars-Sinai Medical Center. The algorithm described in this work is owned by Cedars-Sinai Medical Center, which receives royalties from its licensing. A minority portion of those royalties is shared by Daniel S. Berman and Guido Germano.
Footnotes
Received Apr. 9, 2004; revision accepted Jul. 15, 2004.
For correspondence or reprints contact: Daniel S. Berman, MD, Cedars-Sinai Medical Center, Room A1258, 8700 Beverly Blvd., Los Angeles, CA 90048.
E-mail: bermand{at}cshs.org
REFERENCES
In this issue


Jump to section
Related Articles
Cited By...
- Transient Ischemic Dilation of the Left Ventricle on SPECT: Correlation with Findings at Coronary CT Angiography
- Transient Ischemic Dilation in Patients With Diabetes Mellitus: Prognostic Value and Effect on Clinical Outcome After Coronary Revascularization
- Transient Ischemic Dilation Ratio in 82Rb PET Myocardial Perfusion Imaging: Normal Values and Significance as a Diagnostic and Prognostic Marker
- Are Shades of Gray Prognostically Useful in Reporting Myocardial Perfusion Single-Photon Emission Computed Tomography?
- Quantifying Transient Ischemic Dilation Using Gated SPECT
- The Year in Cardiac Imaging