


Abstract
Imaging of l-dopa uptake or dopamine transporter binding can monitor the progression of Parkinson’s disease. Most follow-up studies have provided data best fitted by a linear decline of their outcome measure. However, in these studies, patients were repeatedly scanned during their first years after a diagnosis had been established. Methods: We followed 6 patients with early Parkinson’s disease for 7.5 y using 123I-labeled N-(3-iodopropene-2-yl)-2β-carbomethoxy-3β-(4-chlorophenyl) tropane and SPECT. Results: Loss of dopamine transporter binding was best fitted using a single exponential approximation. A 63% loss (τ [time constant tau]) was calculated as 5.18 ± 7.62 y in the putamen and 10.62 ± 31.4 y in the caudate nucleus when a 3-parameter fit was used. Conclusion: These data approximate, for what is to our knowledge the first time, the decline of dopamine transporter binding as expected in biologic systems and may allow for models that correct for exponential decline to be developed and for disease-modifying effects in patients with advanced disease to be determined.
Parkinson’s disease (PD) is characterized by a progressive loss of dopaminergic neurons in the substantia nigra and their striatal terminals. Striatal dopaminergic innervation may be quantitatively assessed using radiolabeled l-dopa, ligands of the dopamine transporter (DAT), or the vesicular monoamine transporter 2. Specific uptake of these radiopharmaceuticals is measured using PET or SPECT (1,2). Intraindividual studies have served to calculate the rate of functional decline of dopaminergic neurons in PD and to estimate the duration of the preclinical period. Most follow-up studies have shown an annual decline ranging from 5% to 10% (3–7) and seeming to be stable during the follow-up period. However, in these studies patients were initially in an early stage of disease and were followed for only up to 5 y. Data assessed in intraindividual studies have already been used to design large-scale clinical trials investigating the effect of various drugs on the progression of PD (8,9).
Previously, we reported follow-up data on 8 patients with early PD who underwent DAT SPECT scans 1 and 2 y after an initial scan (10). In this earlier study, annual rates of decline ranged from 5% to 7% and were stable during the 2-y observation period. Our present report extends this observation. Six of the 8 patients were recruited for a 7.5-y follow-up scan.
MATERIALS AND METHODS
The patients were described in detail in our previous report (10). All patients fulfilled the diagnostic criteria of the Parkinson’s Disease Society brain bank (11). All patients were treated with l-dopa and a dopamine agonist. Three patients received additional amantadine. Treatment was basically unchanged except for dosage adjustments and introduction of entacapone in 2 patients. All studies were performed without discontinuation of therapy. The mean duration of disease before the first scan was 3.2 y, and the range was 1–6 y.
Baseline and follow-up SPECT studies were performed according to a standardized protocol. We used the 123I-labeled cocaine analog N-(3-iodopropene-2-yl)-2β-carbomethoxy-3β-(4-chlorophenyl) tropane (IPT), which has proven to be a reliable diagnostic tool for classifying the extent and degree of dopaminergic nerve cell loss in various clinical studies (10,12,13) and which may be reproducibly analyzed with low intra- and interobserver variability in PD patients (14). Ninety minutes after intravenous injection of 150 MBq of 123I-IPT, scans were acquired on a triple-head γ-camera (Prism 3000; Picker) using high-resolution fanbeam collimators, a rotational radius of 12.7–13 cm, 120 projections, 45 s per view, and a 128 × 128 matrix. Data were reconstructed by filtered backprojection, postfiltered with a low-pass filter (cutoff, 0.27; 5th order), corrected for attenuation (first-order method of Chang), and transferred to a HERMES workstation (Nuclear Diagnostics) for further quantitative evaluation. By the use of BRASS software (Nuclear Diagnostics) (15,16), all individual patient studies were coregistered to a mean template derived from IPT studies of healthy volunteers. This template was realigned according to Talairach coordinates based on a 3-dimensional magnetization-prepared rapid-acquisition gradient-echo (MPRAGE) dataset (MRI). That was used to define a 3-dimensional ROI map for the striatum, caudate, putamen, and a frontal cortex (FC) reference region based on the respective morphologic structures. Quantitative evaluation of patient studies coregistered to the template, which itself corresponded exactly to the 3-dimensional ROI map, guaranteed highly observer-independent, precise, and reproducible results due to automated processing. Specific binding of the radioligand in the basal ganglia was calculated by subtracting the mean counts per pixel in the FC, which was used as the reference region, from the mean counts per pixel in the basal ganglia and dividing the results by the mean counts per pixel in the FC ([ROI − FC]/FC). Data analysis has been modified and refined, compared with that of our previous study. Therefore, all previous data were reanalyzed to ensure comparability. Statistical data were analyzed using OriginPro software (OriginLab).
RESULTS
Specific 123I-IPT uptake ratios in healthy volunteers (n = 9) were calculated as 2.88 ± 0.15 (mean ± SD), 3.03 ± 0.14, and 2.79 ± 0.13 in the striatum ([S − FC]/FC), caudate ([C − FC]/FC), and putamen ([P − FC]/FC), respectively.
All patients showed markedly reduced striatal DAT binding in every examination. This reduction was already statistically significant, compared with the values in healthy volunteers during the first scan (P < 0.001). Specific IPT binding steadily declined during the follow-up period. Table 1 summarizes specific uptake ratios at baseline and at 1, 2, and 7.5 y of follow-up, respectively.
Uptake Ratios, Time Constants, and Correlation Coefficients Using a Single Exponential Decay Fit
Figure 1 correlates mean binding ratios with follow-up time. We applied various linear and nonlinear regression analyses. Although the small number of data points does not allow statistical comparison of these approximations, a single exponential decline nicely matched the time course of the loss of DAT binding and rendered correlation coefficients (R2) that were >0.998. We applied equations with 3 variable parameters for single exponential decline (y = A1 × exp[−x/τ1] + y0) or 2 variable parameters, where y0 was set to zero (y = A1 × exp[−x/τ1]). The disadvantage of the 3-parameter fit is that the error of the time constants exceeded the actual value, arguing for overparameterization (τ: 5.18 ± 7.62 vs. 10.62 ± 31.4). All analyses were highly significant (reduced χ2, P < 0.01). When y0 was set to zero, highly significant correlations again were calculated (P < 0.01). The errors of the resulting time constants were reasonable. However, there were discrepancies between the 2-parameter fit and the anticipated course of loss of DAT binding: First, the rates of decline were very similar in the putamen and caudate, which does not match the fact that binding in the caudate is always preserved, compared with binding in the putamen (10,17); second, the calculated preclinical period (extrapolation to control data) rendered a short interval using caudate ratios (3.99 y) and a rather long interval using putamen ratios (8.25 y). Thus, we argue that a 3-parameter fit more closely resembles the clinical situation. Table 1 indicates the R2 values and time constants using a 3-parameter fit. Our data also significantly correlated with linear or polynomial approximations. However, those correlation coefficients were low (<0.99), compared with the exponential decay approximations. Because a linear fit can be used to approximate single exponential curves when only a small section of the graph is included in the analysis, it is not surprising that there was an excellent linear fit during the first 2 y.
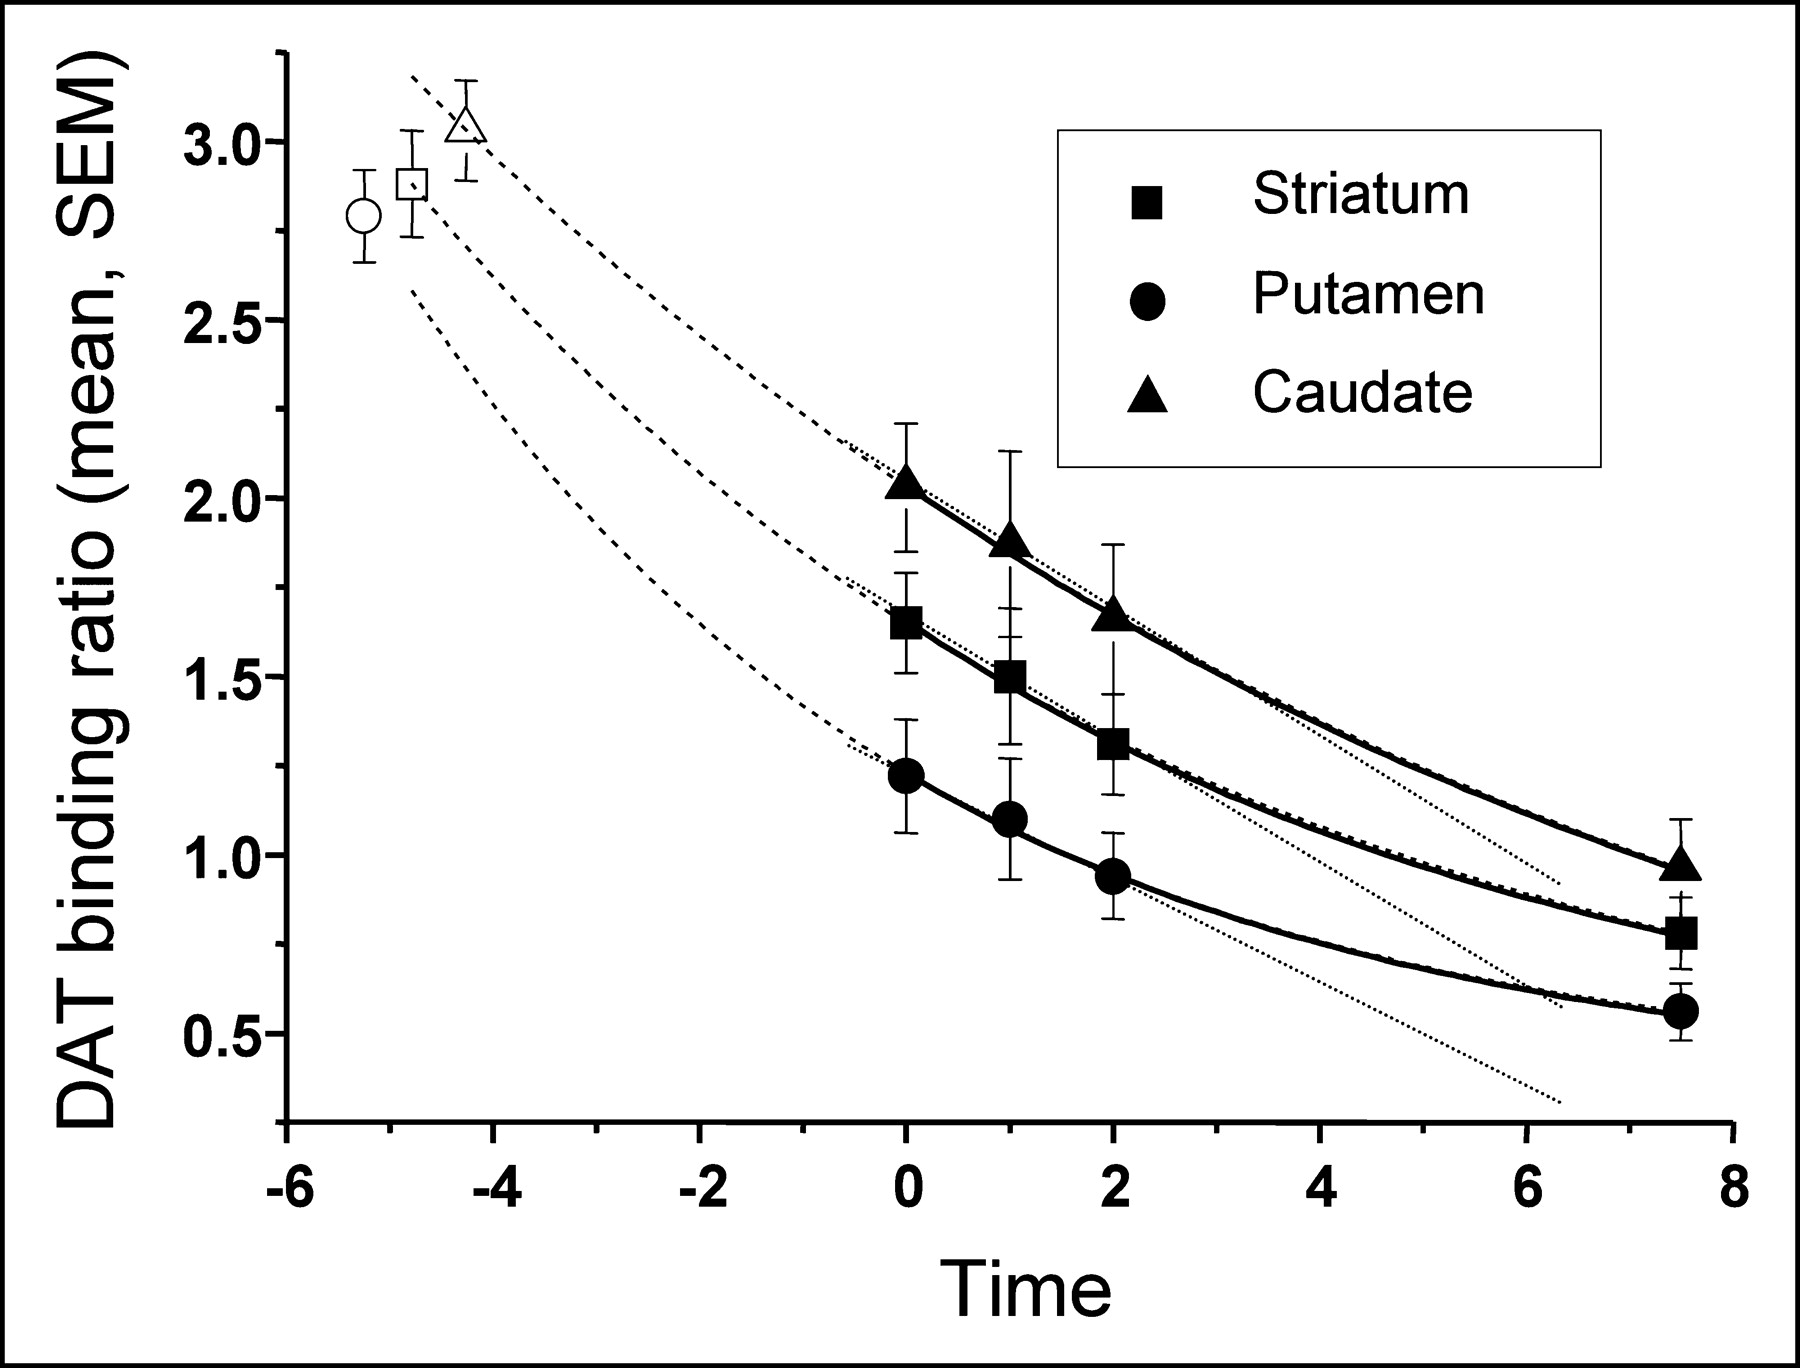
In patients with PD, data on 7.5-y follow-up of striatal DAT binding. Data are best fitted by a single exponential decay (solid line). Extrapolation of calculated single exponential decline hits control values 4–5 y before the first scan (dashed line). The 3 initial patient scans are well fitted by a linear decline (dotted line).
For calculation of a putative preclinical period, we entered the mean uptake ratio of our control group into the calculated equation. The theoretic period between the first scan in our patients and control values was calculated as 4.79 y for the striatum, 5.25 y for the putamen, and 4.26 y for the caudate nucleus. Because the mean duration between onset of clinical symptoms and the first IPT SPECT investigation was 3.2 y, the preclinical period calculated according to these DAT binding data may be considerably shorter than 5 y.
DISCUSSION
In this study, we were able to demonstrate that the rate of decline of DAT binding very well fits a single exponential decline during early to moderate PD. Another recent trial again argued for stable relative loss of DAT binding over a 5-y period (18). Although these data may disagree with ours, the observation period may have been too variable and too short to stably show the exponential decay. Although our data nicely match the anticipated time course of loss of function in biologic systems, we need to raise caution because of the limited number of data points and the small number of patients.
Extrapolating the single exponential decline to the preclinical period leads to control values 2–3 y before the onset of symptoms. We cannot exclude that the loss of function of dopaminergic neurons may not parallel the loss of DAT binding. Especially during the preclinical phase of PD, the loss of dopaminergic function could be substantially slower than in the clinical phase, thus necessitating the use of more than one exponent to approximate the decline of dopaminergic function, resulting in a longer estimation of the preclinical period. It is also likely that the rate of decline during the very early phase of the disease is considerably slower, thus arguing for a polynomial approximation and a much longer preclinical period. Because of the lack of respective data, these considerations remain speculative.
Imaging of DATs as a surrogate marker for disease progression has been introduced into clinical trials of PD patients (9). This trial demonstrated that DAT binding showed a milder decline in patients receiving a dopamine agonist than in those receiving l-dopa. One major argument against the disease-modifying effect of pramipexole proven by this study was that the percentage changes, compared with baseline, did not continue to diverge between the 2 treatment groups (19,20). However, if the rate of decline had also followed a single exponential pattern, this would not have been expected. In fact, when the data presented in this report were reconstructed (9), at least the binding ratios detected in the l-dopa group nicely matched a single exponential decline, in agreement with our present data. Also, the rate of decline (τ) seemed to be different between the 2 treatment groups, arguing for a disease-modifying effect of pramipexole, compared with l-dopa.
There has been intense discussion on whether imaging of DAT binding indeed reflects progression of PD and whether these data can be used to prove a protective effect (19,20). However, there also is sufficient evidence that functional imaging of dopaminergic nerve terminals provides a valuable adjunct to clinical rating scales when potential neuroprotective effects are assessed (21). We anticipate that significantly different time constants should distinguish between disease-modifying and drug effects. However, longer observation periods, larger patient groups, and multiple data points may be necessary to approximate meaningful time constants.
CONCLUSION
Here, we have provided evidence that the loss of DAT binding during early to moderate PD best fits a single exponential decline. Time constants may provide an accurate quantification. Using time constants as outcome measures in “neuroprotection” trials in patients with PD may allow the inclusion of patients with more advanced disease. Current neuroprotection trials always aim at patients with very early disease, or “de novo patients,” who are difficult to recruit. Thus, analyzing the actual rate of decline using assessments of time constants and multiple follow-up scans may improve not only the relevance but also the feasibility of such trials.
Acknowledgments
We thank Dr. Georg Becker for critical review of the manuscript and advice on data modeling.
Footnotes
Received Feb. 6, 2004; revision accepted Apr. 12, 2004.
For correspondence or reprints contact: Johannes Schwarz, MD, Department of Neurology, University of Leipzig, Liebigstrasse 22a, 04103 Leipzig, Germany.
E-mail: johannes{at}caltech.edu
REFERENCES
In this issue


Jump to section
Related Articles
Cited By...
- Long-term follow-up study of SWEDD patients with mild parkinsonian signs
- A Phase II study to evaluate the safety and efficacy of prasinezumab in early Parkinsons disease (PASADENA): rationale, design and baseline data
- Longitudinal change in dopamine transporter availability in idiopathic REM sleep behavior disorder
- Effects of dopaminergic treatment on striatal dopamine turnover in de novo Parkinson disease
- Molecular Imaging of the Dopamine Transporter
- Extended Studies of the Striatal Uptake of 99mTc-NC100697 in Healthy Volunteers
- Is Iterative Reconstruction an Alternative to Filtered Backprojection in Routine Processing of Dopamine Transporter SPECT Studies?