


Abstract
Using 99mTc-TRODAT-1 (99mTc-[2[[2-[[[3-(4-chlorophenyl)-8-methyl-8-azabicyclo[3,2,1]-oct-2-yl]-methyl](2-mercaptoethyl) amino]ethyl]amino]ethane-thiolato(3-)-N2,N2′,S2,S2]oxo-[1R-(exo-exo)])) brain SPECT imaging, we measured striatal dopamine transporters (DATs) activity in multiple system atrophy (MSA) to investigate the possibility of differentiating it from Parkinson’s disease (PD) and to correlate the findings with the parkinsonian (MSA-P) and cerebellar (MSA-C) subtypes of MSA. Methods: Forty-nine patients with probable MSA (30 MSA-P, 19 MSA-C), a disease control group of 36 age- and disease duration-matched patients with probable PD, and a healthy control group of 33 age-matched healthy volunteers participated in a SPECT study. The ratios of specific striatal binding-to-nonspecific occipital binding, including the striatum-to-occipital ratio (S/O), putamen-to-occipital ratio (P/O), caudate nucleus-to-occipital ratio (C/O), and putamen-to-caudate nucleus ratio (P/C), were calculated. The statistical analyses of uptakes among 4 groups used ANOVA followed by Games-Howell’s multiple comparisons. The Spearman correlation coefficient between the motor scores of Unified Parkinson’s Disease Rating Scale (UPDRS-III) and those binding ratios of the MSA-P and MSA-C groups and the PD group was also performed. Results: The striatal binding was more symmetrically reduced in the MSA-P (asymmetric index, 14.2) and MSA-C (asymmetric index, 8.1) groups, in contrast to the greater asymmetric reduction in the PD group (asymmetric index, 28.6). Overall striatal binding was significantly reduced in the MSA-P (−59.8%), MSA-C (−29.9%), and PD (−58.0%) groups with no overlap between these values and those of the control group. Like the PD group, bilateral P/O, C/O, and S/O ratio values were significantly reduced in the MSA-P and MSA-C groups. Nevertheless, the reduction of bilateral P/O and S/O ratios was more for the MSA-P group than for the MSA-C group. P/C ratios showed that the MSA-P and PD groups had similar patterns of nigral impairment, but the MSA-C group had a different pattern. No correlation between the UPDRS-III scores and 99mTc-TRODAT-1 bindings was found in both MSA-P and MSA-C groups; in contrast, a significant negative correlation was noted in the PD group. Conclusion: 99mTc-TRODAT-1 brain SPECT is capable of scientifically differentiating between the MSA-P and MSA-C subtypes, and MSA-P has more symmetric nigrostriatal damage than that in PD. 99mTc-TRODAT-1 brain SPECT imaging probably could provide important information to differentiate MSA from PD.
Multiple system atrophy (MSA) is a sporadic progressive neurodegenerative disease characterized clinically by varying degrees of parkinsonism, cerebellar ataxia, and autonomic dysfunction (1–4). Despite these overlapping syndromes with a wide phenotypical composite spectrum, MSA can be classified into mainly the striatonigral (parkinsonian) type (as in MSA-P) and the olivopontocerebellar (cerebellar) type (MSA-C), according to the predominant phenotype of motor disorder (2–5). However, pathologic examination still requires for the definite diagnosis (5). Along with the complex phenotypes, postmortem findings show variable severity of atrophy in the striatum, globus pallidus, substantia nigra, pons, medulla, cerebellum, cerebellar peduncles, olivary nucleus, and the intermediolateral column and Onuf’s nucleus of the spinal cord (2,6). The microscopic findings usually include the hallmark of oligodendroglia argyrophilic (glial) cytoplasmic inclusions (GCIs) as well as neuron loss, neuronal cytoplasmic inclusions, astrogliosis, and pigment deposition in the striatum and substantia nigra (7). Recently, GCIs have been shown to be consistently immunoreactive to α-synuclein and ubiquitin (8,9). Moreover, the accumulation of 14-3-3 protein in GCIs is probably association with the pathogenesis of MSA (10).
At present, the diagnosis of MSA relies largely on clinical criteria (5). For patients who have fulfilled the clinical criteria, the clinical diagnosis is relatively straightforward. However, the clinical distinction between MSA and Parkinson’s disease (PD) is often difficult (11,12), especially in the early stage of MSA-P when there may be a fair response to levodopa (2,12). Therefore, functional imaging with different radioligands to evaluate nigrostriatal dopamine function has been developed to differentiate between MSA patients and those with other parkinsonism (13–16). In a previous report, Brooks et al. (13) showed variable striatal 18F-fluorodopa uptake in MSA, which differs from those with PD, who have relative sparing of the caudate nucleus and severely reduced uptake in the putamen (14). Recently, 123I-labeled 2β-carbomethoxy-3β-(4-iodophenyl)tropane (β-CIT) SPECT has been used to determine the concentration of dopamine transporters (DATs) on dopaminergic nerve terminals as a possible marker for dopaminergic degeneration in PD as well as for other parkinsonism (15–18). In those imaging studies on MSA, the technique was demanding and so the number of patients studied was limited. Furthermore, the degeneration of presynaptic dopamine neurons in different subtypes of MSA has not yet been clarified (14,17).
The aim of this study was to investigate the degree and pattern of dopaminergic neuron degeneration by relatively easily performed 99mTc-TRODAT-1 (99mTc-[2[[2-[[[3-(4-chlorophenyl)-8-methyl-8-azabicyclo[3,2,1]-oct-2-yl]-methyl](2-mercaptoethyl)amino]ethyl]amino]ethane-thiolato(3-)-N2,N2′,S2,S2]oxo-[1R-(exo-exo)])) brain SPECT in a large series of patients with 2 clinically probable subtypes of MSA (19,20). 99mTc-TRODAT-1 is a new ligand of a cocaine derivative, with affinity for DAT on dopamine nerve terminals in the striatum. It acts as a marker of dopamine neuron degeneration in PD and other parkinsonism (19–22). Owing to the dominant parkinsonism and cerebellar ataxia that distinguish between MSA-P and MSA-C clinically, we hypothesize that the extent of the involvement of the nigrostriatal system in these 2 subtypes could exhibit a fundamental difference (14). Therefore, 99mTc-TRODAT-1 binding to the striatum could differ between them and this can probably provide substantial information to aid the differential diagnosis between the MSA-P and MSA-C subtypes.
MATERIALS AND METHODS
Subjects
The participants were 49 patients with MSA, 36 patients with PD who volunteered for this study at the Movement Disorders Unit, and 33 healthy control subjects. To be included, patients with MSA had to meet the recent consensus on the “probable MSA” diagnostic criteria defined by Gilman et al. (5) and patients with PD met the diagnostic criteria proposed by Calne et al. (23). The MSA patients were divided into 2 groups: MSA-P (30 patients with predominant parkinsonian features) and MSA-C (19 patients with predominant cerebellar features), according to their major neurologic motor symptoms. Those with other secondary parkinsonism, including progressive supranuclear palsy, corticobasal degeneration, diffuse Lewy body parkinsonism, and vascular parkinsonism, were excluded. Clinical assessment of each patient was performed using the Hoehn and Yahr staging (H&Y), Unified Parkinson’s Disease Rating Scale (UPDRS) (24), and Schwab and England scale of activity of daily living (ADL). This work’s research protocol has been approved by the Research Council of the Taiwan Health Organization. A written informed consent was obtained from each participant.
99mTc-TRODAT-1 Brain SPECT
99mTc-TRODAT-1 was prepared from a research lyophilized kit, supplied by the Institute of Nuclear Energy Research of Taiwan (21,22). Two milliliters of tracer contained a dose of 925 MBq (25 mCi). SPECT was performed at 4 h after its intravenous injection. SPECT images were obtained using a Siemens MULTISPECT 3 γ-camera, with fanbeam collimators and 120 equally spaced projections over 360°, taking 60 s per step and using a 128 × 128 matrix size. Individual images were reconstructed with backprojection using a Ramp-Butterworth filter, with a cutoff of 0.3 cm−1 and order of 10. The data were corrected for the effects of photon attenuation using Chang’s first-order method with an attenuation coefficient of 0.12 and with the attenuation ellipses defined on the summed images of the entire dataset and applied, without modification, to all of the images individually. No attempt was made to correct for partial-volume effects. The slice thickness and in-plane resolution was 2.9 mm. Three reconstructed transaxial slices were summed together and reoriented to be parallel to the orbitomeatal line with the highest signal in the region of the basal ganglia as the central slice (19–22). All images were reviewed blindly by 3 nuclear physicians and all decisions were confirmed by at least 2 of the 3.
MRI
The stereotactic shapes of the striatum were obtained using a SIEMENS Vision VB33D 1.5-T MRI scanner for all subjects. T1-weighted axial images (repetition time [TR], 500 ms; echo time [TE], 25 ms) and T2-weighted axial images (TR, 3,500 ms; TE, 120 ms) were obtained in the transaxial plane (6-mm thickness and 0.6-mm gap). Neuroradiologists, who did not know the clinical diagnosis of MSA and PD, performed evaluations blindly on images of each individual. The individual region of caudate nucleus and putamen on MR images will be drawn for providing the atlas for the purpose of fusion with the SPECT images and measuring the uptakes of 99mTc-TRODAT-1.
Data Processing
For analysis of 99mTc-TRODAT-1 binding in the striatum, the ratio of specific-to-nonspecific binding was calculated by the summation of 3 adjacent transversal slices representing the most intense striatal DAT binding (21,22). A standard region-of-interest (ROI) template was constructed according to a stereotactic shape from an MRI atlas and included regions for the putamen, caudate nucleus, and occipital cortex. Each ratio of specific-to-nonspecific striatal 99mTc-TRODAT-1 binding was then calculated as the specific uptake ratio (UR). UR = ([ROI counts − occipital cortex counts]/occipital cortex counts). We also calculated the putamen-to-caudate nucleus ratio (P/C), from counts in the relevant regions, using the formula ([putamen − occipital cortex]/[caudate − occipital cortex]), to investigate the relative regional variability of DAT in the caudate nucleus and putamen in all 4 groups.
In the MSA-P, MSA-C, and PD groups, we defined the contralateral striatum as the striatum located opposite the side with dominant symptoms. In the control group, the contralateral striatum denotes the right striatum and the ipsilateral striatum denotes the left striatum. We calculated the asymmetric index (ASI) from the following formula: ASI = (2 × [ipsilateral UR − contralateral UR]/[ipsilateral UR + contralateral UR]) × 100. The nuclear physicians, who were unaware of the clinical data, performed these measurements on the images.
Statistical Analyses
Data was entered into EXCEL and analyzed using SPSS (Statistical Package for the Social Science, version 10.0). P < 0.05 was considered statistically significant. The differences in the clinical information (including UPDRS score, UPDRS-III motor score, H&Y stage, and ADL score) among the MSA-P, MSA-C, and PD groups were statistically evaluated using 1-way ANOVA followed by the Games-Howell’s procedure assuming unequal variances. The same statistical approach was also used to compare the differences in the striatum-to-occipital ratio (S/O), caudate nucleus-to-occipital ratio (C/O), putamen-to-occipital ratio (P/O), and P/C ratio among these 3 groups. For investigation of the contribution of nigrostriatal damage to the clinical parkinsonism of the MSA-P, MSA-C, and PD groups, we further analyzed the correlations between the UPDRS-III scores and each of the S/O, C/O, and P/O ratios by the Spearman correlation coefficient.
RESULTS
Clinical Analyses
Table 1 shows the clinical demography of the MSA-P, MSA-C, and PD patients and healthy control subjects. The predominant subtype of our MSA patients is MSA-P, which is similar to those in Western populations (1–3) and different from the Japanese population (4). There was no significant difference in clinical parameters such as predominant sex, age, and disease duration between the 4 groups studied. However, the H&Y stage was more severe in the MSA-P (P = 0.005) and MSA-C (P = 0.001) groups than in the PD group, but no difference was found between the MSA-C and MSA-P (P = 0.865) groups. Total UPDRS scores were significantly worse in the MSA-P group (P = 0.001 compared with the PD group and P = 0.055 compared with the MSA-C group). Hoowever, there was no significant difference between the PD and MSA-C (P = 0.749) groups. The UPDRS-III scores show a similar difference, being significantly worse in the MSA-P group (P = 0.002 compared with the PD group and P = 0.023 compared with the MSA-C group). However, there was no significant difference between the PD and MSA-C (P = 0.999) patients. In brief, MSA-P patients had the most severe parkinsonian disability. ADL was significantly better in the PD group than in the MSA-P (P = 0.001) and MSA-C groups (P = 0.009), but no significant difference was found between the MSA-C and MSA-P (P = 0.800) groups.
Clinical Information for 33 Healthy Control Subjects, 36 PD Patients, and 49 MSA Patients
99mTc-TRODAT-1 Uptake and Statistical Analyses
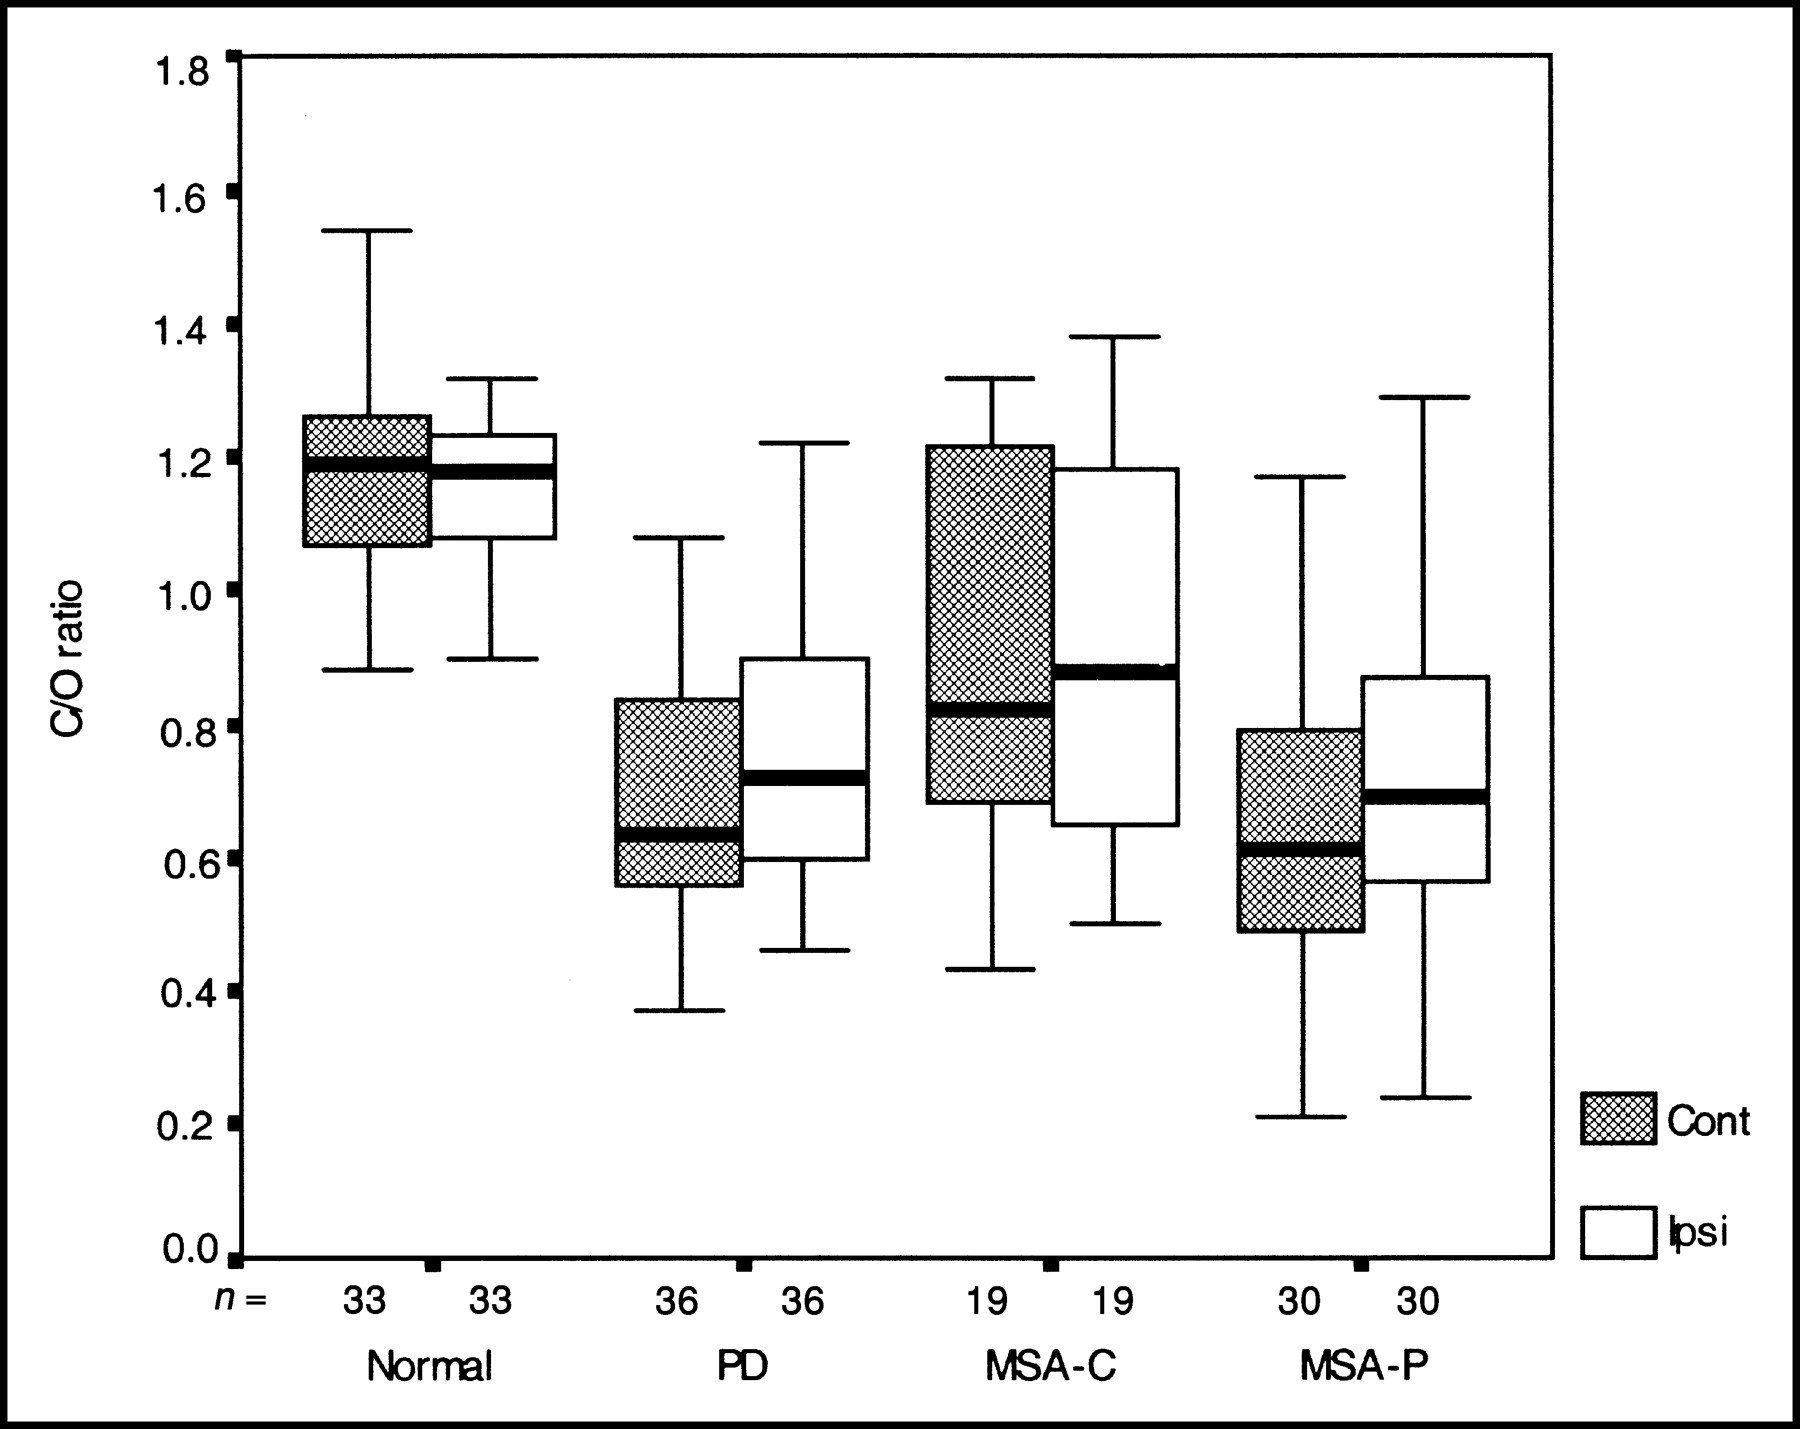
A predominantly asymmetric striatal binding was found in the PD group (ASI, 28.6) but not in MSA-P group (ASI, 14.2), MSA-C group (ASI, 8.1), and healthy control subjects (ASI, 3.3). In more detail, 35 of 36 in the PD group, 15 of 30 in the MSA-P group, and 5 of 19 in the MSA-C group have shown an ASI over the generally presumed cutoff value of 10. Overall reduction of binding in the striatum was 58.0% in PD, 59.8% in MSA-P, and 29.9% in MSA-C. Figure 1 shows 99mTc-TRODAT-1 brain SPECT images of 4 individuals of similar age, 1 from each group. Table 2 summarizes the uptake ratios, S/O, C/O, P/O, and P/C, measured contralaterally and ipsilaterally to the dominant symptomatic side in the 4 groups and their statistical analyses. There was a significant reduction in the S/O, C/O, and P/O ratios for the MSA-P and MSA-C groups compared with those of healthy subjects. These reductions in the MSA-P and MSA-C groups were similar to those for the PD group. The differences in bilateral S/O and P/O ratios (but not in the C/O ratios) between the MSA-P and MSA-C patients were also significant. Interestingly, no significant difference in the S/O, C/O, and P/O ratios was noted between the MSA-P and PD groups. A graphic representation of these uptake ratios as well as its statistical significance for the 4 groups is shown in Figures 2, 3, and 4. Comparing the contralateral and ipsilateral P/C ratios among the 4 groups, a high significance was noted between the MSA-P and MSA-C groups, but no significant difference was noted either between the MSA-C group and healthy control subjects or between the PD and MSA-P groups. These findings might further imply that the MSA-P and MSA-C groups have a different pattern of nigrostriatal involvement. The Spearman correlation coefficient between 99mTc-TRODAT-1 uptakes and UPDRS-III scores was not significant in the MSA-P and MSA-C groups, but it was significant in the PD group. These results might indicate that the presynaptic dopaminergic dysfunction was not solely responsible for the parkinsonian disabilities in either MSA-P or MSA-C subtype.

99mTc-TRODAT-1 SPECT images of 4 similarly aged individuals, 1 from each group: healthy subject (A), MSA-C patient (B), MSA-P patient (C), and PD control patient (D).

Bilateral putaminal uptakes (P/O ratios) of 99mTc-TRODAT-1 in 4 groups. Bilateral P/O ratios are significantly reduced in PD and MSA-P groups but are less reduced in MSA-C group. Cont = contralateral; Ipsi = ipsilateral.

Bilateral caudate nucleus uptakes (C/O ratios) of 99mTc-TRODAT-1 in 4 groups. Similar to findings for P/O ratios, bilateral C/O ratios are significantly reduced in PD and MSA-P groups but are only mildly reduced in MSA-C group. Cont = contralateral; Ipsi = ipsilateral.

Bilateral P/C ratios of 99mTc-TRODAT-1 in 4 groups. There is preferential involvement of putamen in PD and MSA-P groups, whereas P/C ratios for MSA-C are closer to those of healthy subjects. This indicates relatively diffuse involvement of both putamen and caudate nucleus in MSA-C group. Cont = contralateral; Ipsi = ipsilateral.
99mTc-TRODAT-1 Uptakes in Different Striatal Regions for 4 Groups
DISCUSSION
To measure the concentration of DAT in the striatum could provide objective evidence of a presynaptic dopaminergic deficit (25,26). These clinical parameters, such as predominant sex, age, and duration of illness, were matched among the 4 groups studied. Therefore, our imaging results would not be biased by these factors.
Using 99mTc-TRODAT-1 imaging, we have found that the striatal DAT concentration is reduced in both MSA-P and MSA-C subtypes of MSA and PD control subjects compared with that of healthy subjects. These findings are similar to those resulting from studies with 123I-β-CIT SPECT, which indicate that presynaptic dopamine neurons are affected (17,27). Although this is the pioneer work of 99mTc-TRODAT-1 on MSA, 99mTc-TRODAT-1 uptake data in the PD and healthy control subjects are similar to those reported previously by Mozley et al. (20) and Huang et al. (28), and those have also been found in our previous investigations on other parkinsonism (21,22). The most severe reduction of uptake was in the putamen (77%) contralateral to the dominant side in the PD group (Table 2). Therefore, our data of reduced uptake in those MSA patients are justifiable.
We have also demonstrated a significant difference of reducing striatal bindings between 2 subtypes. A marked reduction was found in MSA-P, which corresponded to the dominant clinical parkinsonism and a smaller reduction was found in MSA-C, which mainly showed cerebellar ataxia. These results achieved what we have presumed. These findings provided other evidence of nigrostriatal pathology as reported in previous studies approached with different ligands and limited patients (13,14,29) and in postmortem findings of MSA-C (2,6,30).
Using a ligand, (+)-11C-dihydrotetrabenazine, for the type 2 vesicular monoamine transporter and PET scanning, Gilman et al. found a mean reduction of putaminal binding of 71% in MSA-P and of 59% in MSA-C (14). These values are close to the mean declines of 71% and 33% in the putamen in MSA-P and MSA-C subgroups, respectively, in this study (Table 2). There is no significant difference in the mean duration of illness between the patients of Gilman et al. (3.6 and 4.7 y in MSA-P and MSA-C subtypes, respectively) (14) and the patients in this study (4.5 and 4.0 y) (Table 1). Therefore, our results suggest that fundamental differences in the severity of nigrostriatal degeneration might contribute to the parkinsonian presentation in these 2 subtypes of MSA. Nevertheless, the influence from cerebellar dysfunction should be considered (14). Certainly, 99mTc-TRODAT-1 brain SPECT is also very effective in detecting the nigrostriatal damage in MSA patients.
Rinne et al. have studied the reduction of 11C-diprenorphine and 18F-fluorodopa uptake in sporadic olivopontocerebellar atrophy (OPCA) with autonomic failure, a variant of MSA-C (pure OPCA) (29). Compared with control values, the mean uptakes of 11C-diprenorphine were mildly but significantly diminished to 85% (P/O) and 88% (C/O), whereas 18F-fluorodopa uptakes were similarly diminished to 71% (P/O) and 89% (C/O), respectively, in putamen and caudate nucleus. They suggested that subclinical nigrostriatal dysfunction is present in the majority of their patients with relatively pure OPCA. In contrast, those values are less severe compared with 67% (P/O) and 78% (C/O) in our investigation. This difference might be explained by the presence of parkinsonism, although not dominant, in our MSA-C subgroups. Therefore, our imaging data also implied mild nigrostriatal pathology existed in the MSA-C group compared with what was found in the MSA-P group (30).
There are caveats about the broad overlap of S/O, P/O, and C/O ratios among the MSA-P, MSA-C, and PD groups, and to a certain extent between patients and healthy control subjects, although the differences in the mean values are statistically significant (Table 2). However, a trend of more severe binding was found in the contralateral side in both MSA and PD patients. The overlapping results are similar to those assessed with 123I-β-CIT SPECT (17,27) and may just reflect the fact that the variable pathologic involvements of nigrostriatal dopamine neuron were found in MSA (6,29). Therefore, the group data per se might be difficult to apply to individual patients for the purpose of differential diagnosis between PD and MSA. We suggest that those findings are more interesting academically rather than a practical clinical application. Nevertheless, the 99mTc-TRODAT-1 brain SPECT images might provide some clues such as relatively symmetrically reduced uptake in favor of MSA. Taking ASI as a reference, approximately one quarter of MSA-C, half of MSA-P, and almost all PD patients showed a significant asymmetry in the striatal uptakes.
Another unfavorable result was the lack of correlation between the clinical parkinsonism (UPDRS-III score) and 99mTc-TRODAT-1 binding in the striatum by S/O, P/O, and C/O ratios of MSA-P and MSA-C subgroups. In contrast, a negative correlation was found in the PD control group. It is perhaps easy to understand that DAT activity, indicating the integrity of presynaptic dopamine neurons, is specifically damaged in PD. However, not only the presynaptic dopamine neurons but also the postsynaptic receptors in the striatum are impaired in MSA (2,6).
In MSA-P, the marked reduction of striatal DAT function is similar to that found in PD, which has been reported by Pirker et al. (17,18). However, with MSA-C, there is significantly less reduction in the striatum and, to our knowledge, this has never been documented before. In a clinicopathologic study of 35 cases of MSA, collected from the United Kingdom Parkinson’s Disease Society Brain Bank, Wenning et al. found an unsatisfactory correlation between semiquantitative measures of pathologic damage in the putamen, nigra, and olivopontine area and age at onset, age at death, and duration of disease (6). However, they found parkinsonism was associated with pronounced damage to the nigra, and cerebellar features were associated with greater damage in the olivopontocerebellar area. Those results are inconsistent with the severe reduction of DAT binding in MSA-P but less severe reduction in MSA-C in our study.
The different presynaptic deficits between MSA-P and MSA-C could provide an explanation for the variable results of 18F-fluorodopa uptake in a group of MSA patients containing all subtypes reported by Brooks et al. (13). Therefore, this imaging technique is able to further separate the subtypes of MSA-P and MSA-C. The reduction of striatal 99mTc-TRODAT-1 uptake in the MSA-P and MSA-C groups was nevertheless more evenly distributed compared with those of PD.
Although the extent of reduction of 99mTc-TRODAT-1 uptake in the striatum of MSA-P is similar to that of PD, there was a significant bilateral asymmetry in PD. If the uptake in the striatum is similar in PD and MSA-P, but MSA-P patients have higher UPDRS-III scores (MSA-P, 43.4; PD, 29.9), then extra nigral lesions must contribute to this disability in MSA-P. There was a relatively symmetric bilateral involvement of the striatum in MSA, both for MSA-P and MSA-C, which differs from that in PD (23). These findings could correspond to the common bilateral clinical presentation of MSA patients. This implies that the asymmetric onset of parkinsonian symptoms is probably an important clue for the diagnosis of PD, in contrast to the relatively symmetric onset in MSA-P (1,2). That the impaired P/C ratios were similar in MSA-P and PD groups might indicate that the pattern of nigral lesions was similar in both groups. It further suggests that the ventrolateral tier of the substantia nigra is the most vulnerable area in MSA-P (31). The selective vulnerability of the ventrolateral tier of the substantia nigra is not specific for PD. Considering this pathologic observation, these degenerative diseases might be presumed to share a similar pathogenic mechanism.
Whether 99mTc-TRODAT-1 brain SPECT has any influence on the treatment regime is an interesting question. In this study, a greater loss of dopamine neurons was found in MSA-P than in MSA-C. These findings probably correspond to a period of moderate or good response to levodopa treatment in 8 of 30 MSA-P patients compared with the mild response in 5 of 19 MSA-C patients in our series, which is similar to that in a previous report (2). However, there was no significant difference in the striatal uptakes between 8 MSA-P and 5 MSA-C patients. Follow-up of 99mTc-TRODAT-1 brain SPECT for evaluation of the progressive loss of levodopa response is warranted in the future, in keeping with the neuroprotection therapy.
Another issue relating to the applicability of 99mTc-TRODAT-1 brain SPECT should be addressed. The advantages of 99mTc-TRODAT-1 are its ease of use, wide availability, and superiority over 123I-β-CIT for routine nuclear medicine use (27). This is particularly true for a large-scale investigation such as our study of MSA patients. The lower striatum-to-cerebellum ratio observed by 99mTc-TRODAT-1 compared with that of 123I-labeled N-ω-fluoropropyl-2β-carbomethoxy-3β-(4-iodophenyl)tropane, a radioiodinated cocaine analog, is a major drawback (32). However, this could be effectively compensated by using a higher dose of tracer, such as the dose in this study (925 MBq [25 mCi]) compared with that in previous reports (740 MBq [20 mCi]) (20,28). The higher background activity in the brain is a disadvantage, which may turn into an advantage, because the uptake in the skull or scalp is actually served as a marker for outlining the boundary of brain tissue, which greatly facilitates the data analysis.
CONCLUSION
We have demonstrated the fundamental differences in the striatal DAT activity between PD and MSA and also between the MSA-P and MSA-C subtypes in a large group of MSA patients. We conclude that 99mTc-TRODAT-1 brain SPECT is useful in distinguishing between the parkinsonian and cerebellar subtypes of MSA for scientific research purposes. It might also provide an important clue for the differentiation between the MSA and PD groups. However, for the conventional diagnostic setting of individual MSA patients, 99mTc-TRODAT-1 brain SPECT might also be helpful to differentiate it from PD or to divide the MSA-P and MSA-C subtypes clinically.
Acknowledgments
We are in debt to Prof. Hank Kung for his advice on the 99mTc-TRODAT-1 SPECT imaging technique and also are in debt to Prof. Sinclair Wynchank for his great help with the English in this article. This research work was financially supported by the National Science Council, Taiwan, under contract NSC-90-2314-B-182A-080.
Footnotes
Received Feb. 19, 2003; revision accepted Sep. 10, 2003.
For correspondence or reprints contact: Tzu-Chen Yen, MD, PhD, Department of Nuclear Medicine, Chang Gung Memorial Hospital at Taipei, 199, Tung Hwa North Rd., Taipei 105, Taiwan.
E-mail: yen1110{at}adm.cgmh.org.tw


