


Abstract
Radioimmunotherapy for non-Hodgkin’s lymphoma often results in surprisingly high response rates compared with those expected from estimated absorbed radiation doses. Several factors, including radiobiologic response, selective targeting, and heterogeneous absorbed radiation within the lymphoma, are likely to contribute to the lack of a dose–response relationship. This article investigates the impact of nodal regression on absorbed radiation dose and applies a correction factor to account for its effect. Methods: The radioactivity in and regression of 37 superficial lymph nodes were measured in 7 non-Hodgkin’s lymphoma patients treated with 775–3,450 MBq/m2 of 131I-Lym-1 monoclonal antibody. Nodal dimensions were measured with calipers and radioactivity was quantitated using gamma-camera imaging on multiple days after 131I-Lym-1 injection. Both nodal regression and radioactivity were fit with monoexponential functions. Formulas were developed to account for simultaneous change in nodal mass and radioactivity. All lymph nodes with size and radioactivity measurements, and exponential-fit coefficients of determination of >0.8, were included in the analysis. Results: A 3 orders-of-magnitude node-to-node variation in initial radiopharmaceutical concentration (MBq/g) was observed, with the highest concentrations in the smallest nodes. Reduction in radioactivity as a function of time (biologic half-life) varied by about a factor of 2. In contrast, the rate of nodal regression varied by orders of magnitude, from a 14-h half-time to no regression at all. Five nodes regressed with a half-time that was shorter than their observed effective radiopharmaceutical half-life. Accounting for the effect of nodal regression resulted in dose corrections ranging from 1 (no correction) to a factor of >10, with 70% of nodes requiring a correction factor of at least 20% and >50% of nodes requiring a correction factor of >2. Corrected for nodal regression, 46% of nodes analyzed had absorbed radiation doses of >10 Gy and 32% had doses of >20 Gy. Conclusion: These results highlight the importance of accounting for change in mass, particularly tumor regression, when assessing absorbed radiation dose for tissues whose mass changes during the time the radiation dose is being absorbed. The increase in calculated absorbed dose when this change is considered provides better insight into the high nodal response rates observed in non-Hodgkin’s lymphoma patients.
Remarkable improvements in cancer control have been associated with radioimmunotherapy (RIT) for non-Hodgkin’s lymphoma (NHL), suggesting that the combination of radiation and molecular targeting molecules (in this case, antibodies) is a promising avenue for treating widespread cancer (1). However, some enigmas remain in understanding how RIT works to improve tumor control. One feature is the high response rate (nodal regression) for relatively modest calculated radiation doses, disproportionately better than that associated with similar doses from external-beam radiation (2,3). Several biologic explanations have been put forward to explain these differences, including selective targeting of cells responsible for tumor volume doubling, nonhomogeneous binding throughout the tumor, targeting of the tumor vasculature, and block of cell cycle progression (3–5).
Estimation of radiation dose deposition may also play an important role. For radiation therapy, radiation is delivered with external sources, which result in a geometrically determined field of radiation in the area being treated. For a uniformly dosed volume, which is often the case, the tumor receives a constant dose, independent of whether it is growing or shrinking. When radiation is delivered through drug-based molecular targeting, dosimetry depends primarily on the concentration of activity in the targeted mass, modified by transport of radiation energy in or outside the mass. This results in nonuniform dose delivery (3) that changes as a function of time and tumor variation.
This article reports on an investigation of the possible contribution of nodal regression to absorbed radiation dose, differing from the standard dose estimation approach used for RIT for patients treated with the Lym-1 antibody for NHL. Lym-1 is a monoclonal antibody that preferentially targets malignant lymphocytes and has been shown to induce therapeutic responses in most patients with NHL and chronic lymphocytic leukemia (6–9).
In patients who respond to treatment, the size of the lymph nodes often decreases dramatically over a 1- to 10-d period. At the same time, the concentration of radioactive emitter is changing due to pharmacokinetic processes and physical decay of the radioactive atoms. Traditionally, dose to lymph nodes (and other organs) is determined by measuring the amount of radioactive emitter through γ-detection with planar or tomographic imaging, then determining the number of radioactive decays per mass of tissue, and inferring absorbed radiation dose. If the mass of the host tissue (in our case, the lymph node) is decreasing, the assumption of constant mass can result in an underestimate of the absorbed radiation dose.
MATERIALS AND METHODS
Patients were selected from a group of 51 lymphoma patients (32 men, 19 women) who entered trials using 131I-Lym-1 therapy (10). Nodal regression was measured after the first treatment, in the subset of patients for whom caliper measurements of nodal size and planar images of activity were available for lymph nodes, measured on multiple days. Seven NHL patients met these criteria. Patients received 131I-Lym-1 doses ranging from 775 to 3,450 MBq/m2. Table 1 summarizes patient characteristics.
Summary of Administered Dose, Number of Accessible Nodes, Number of Nodes With Activity Measurements, and Number of Nodes Carried Through Study
This article reports results for relationships between nodal regression and nodal size, pharmacokinetics, and absorbed dose, and evaluates whether the correction for nodal regression resulted in radiation absorbed doses more consistent with observed nodal regression, based on experience with external-beam radiation therapy.
Radiopharmaceutical
Lym-1 is an IgG2a mouse monoclonal antibody that has a high affinity against a discontinuous epitope on the β-subunit of the human leukocyte DR antigen located on the surface membrane of malignant B-lymphocytes (11,12). Its production, purification, and preparation for treatment are described elsewhere (10).
Assessment of Nodal Regression
Each lymph node was characterized as an ellipsoid, whose volume is described by 2 caliper measurements. The largest and smallest perpendicular dimensions were measured with calipers for all superficial, enlarged nodes observed in each patient. Nodes were assumed to be spheric or elongated (the third dimension is assumed to be the same as the smallest caliper measurement).
All node-size measurements made within the first 10 d of treatment were included for assessing mass change. The most recent pretreatment node-size measurement (generally the day of or day before treatment) was used as the node size at time (t) = 0. Nodal mass was determined from volume by assuming a density of 1 g/cm3.
Nodal regression measurements were fit with a monoexponential function. To assess whether nodal regression was more accurately modeled with an exponential or linear function, the coefficient of determination (R) was compared for exponential and linear fits to each node whose regression was evaluated. For the majority (∼80%) of evaluable nodes (R for exponential fit was >0.8), the exponential fit gave a higher or equal R value than the linear fit. The exponential function was used because it was generally better than the linear fit and is consistent with simple exponential population growth and reduction.
If nodal regression was not fit by a monoexponential with an R value of ≥0.8, it was rejected. This criterion resulted in the rejection of 2 nodes, both in patient 6: a 17-g initial-mass parotid node that regressed within 1 d to 11 g and then to 1.6 g by day 9 and a small supraclavicular node (0.1-g initial mass) that grew between the first and second measurements and then shrunk. Nodes that were excluded on the basis of an R value had half-lives of ≥10 d (i.e., they were not shrinking appreciably) or they grew during the time of observation (negative half-time).
Two nodes (right axilla, patient 7) that coalesced during the measurement period were not included. For 3 nodes, there were not enough nonzero mass data points to obtain an exponential fit. Two of these nodes were associated with measured activity and did not contribute to estimates of absorbed radiation dose and dose correction. One inguinal node (patient 5) regressed to an immeasurable mass within 2 d. The effective half-life for its activity was 1 d. Because of the paucity of mass measurement data for this node, it was not used.
Radiation Quantification
Nodal 131I activity was measured by serial planar imaging, using a Bodyscan camera (Siemens Medical Systems, Inc.), immediately, 2–6 h, and daily for 7–10 d after administration of 131I-Lym-1. Detailed methods for quantitative imaging have been described previously (13,14).
Using a visual boundary, regions of interest (ROIs) that included either a single node or localized group of nodes were converted to percentage injected dose. A reference source with a known amount of 131I served to calibrate the amount of 131I for each image. When activity from individual nodes in a group was not separable in planar images, the measured activity was assigned to the sum of the masses and, for dose calculations, apportioned to give a constant activity per initial mass for each node in the group.
In patient 2, 2 nodes with very different masses (47 and 0.5 g) appeared to have the same initial activity concentration. However, this was an artifact of how initial activities were obtained: The activities for both of these left axillary nodes were measured in a single ROI and assigned to the sum of their masses. Large and small nodes were also lumped together in 2 other cases: 2 left clavicular nodes with masses of 6 and 44 g in patient 4 and 2 right posterior cervical nodes with masses of 0.5 and 8 g in patient 6. In all other cases where activity per mass was assigned to a group of nodes, all nodes in the group were within a factor of 2 in mass. The result of common activity-concentration assignment to nodes of very different mass is likely to be an underestimate of the initial activity concentration in the smaller node and a relatively smaller overestimate of the initial activity concentration in the larger node.
Because the nodes were superficial (palpable), no attenuation correction was performed in the conversion of measured counts to radioactivity in each node, leading to a potential small underestimation of tumor absorbed radiation dose, particularly for larger nodes.
To assess the accuracy of quantification, biopsy samples were obtained from 4 nodes 1 or 3 d after administration of 131I-Lym-1. All samples were >0.4 g to reduce the effects of activity heterogeneity inside the tumor. 131I concentrations in excised samples were measured using a calibrated γ-well detector and confirmed the accuracy of gamma-camera image quantification (10).
The time-dependent behavior of activity was characterized using a monoexponential function fit to data for each node or node group. All nodes with both measured activity and biologic activity-decay fits with R >0.8 were used. The R value criterion was met by all but 1 node-activity measurement set: a left preauricular node in patient 1. The activity measurements for the preauricular node in patient 1 were only available on 3 d and were near the gamma-camera detection threshold.
Once our observations were confined to the lymph nodes that passed exponential fit tests for both activity reduction and nodal regression, 37 nodes in 7 NHL patients were found to be evaluable. Two patients were injected with relatively lower radiopharmaceutical doses of 775 and 1,030 MBq/m2, whereas 5 patients were injected with higher radiopharmaceutical doses of 2,680–3,450 MBq/m2. The initial injected activity, for purposes of calculations made here, was determined as the sum of the injected treatment dose and the residual amount of activity from any pharmacokinetic dose. Node-site-specific activity measurements made within the first 24 h of treatment-dose administration were used for all but 1 patient (patient 6): In this case, the node activities (as a fraction of injected activity) determined from the initial (pharmacokinetic) dose were used for the earliest (<24 h) time points. The pharmacokinetics have been shown to be the same for both levels of injected radiopharmaceutical (10).
Calculation of Absorbed Radiation Dose
For constant mass, the usual dosimetry assumption, dose was defined as:
 where A0 is the initial activity, m0 is the mass of the node, S(m0) is the S factor, or conversion from decays per mass (kBq-h) to radiation absorbed dose (cGy), λ is the effective decay constant (radioactive + biologic decay, where the effective half-life was defined as teff = ln (2)/λ). Integrating over time resulted in:
 where t refers to the time of integration. X(m) refers to the mass × the S factor. Because X(m) decreased with decreasing mass due to an increasing amount of β-particle energy leaving the node, it was included in the time integration when estimating absorbed dose. The absorbed fraction was estimated from a logarithmic-function fit to tabulated values (15) by assuming that the absorbed fraction for an ellipsoid was the same as that for an equal-volume sphere. The empiric, fitted X(m) function, shown in Figure 1, agreed with Monte Carlo simulations to within less than ±4% for sphere sizes ranging from 0.01 to 1,000 g. To include the absorbed fraction in the dose integration, the following equation was used:
 where ξ is the nodal regression constant. X(m) was converted to a function of time, X(t), as follows:

 For variable mass, dose was calculated as:
 Integrated through t = ∞, this resulted in:
 as long as ξ < λ, or the nodal regression half-time was smaller than the effective (radioactive + biologic decay) half-life. As the nodal regression half-time decreased, but was still greater than measured activity-reduction half-life (effective half-life), the absorbed radiation dose integral converged at higher values.

Empiric, analytic fit to Monte Carlo-simulated absorbed fraction data for water spheres ranging in size from 0.01 to 1,000 g. R2 is square of R for fitted curve.
The situation changed if the nodal regression half-time was shorter than the observed activity half-life (effective half-life). In this case, which was observed in 5 nodes, the absorbed radiation dose continued to increase with time. When the nodal regression half-time was shorter than the effective activity half-life, the absorbed radiation dose was estimated by integrating until the last nodal mass observation, using the following equation:
 where t refers to the total integration time.
Because it was only possible to assess nodal regression up to the final nodal mass measurement point, dose was determined by integrating up to the time the final nodal mass measurement, for the purpose of observing the effect of the absorbed radiation dose on the final mass of the node. The rationale for limiting the integration period for this comparison is that nodal mass could not be influenced by absorbed radiation dose that would be contributed after the measurement was made. The choice of integration time decreased the size of the dose correction for nodal regression by as much as 66%.
RESULTS
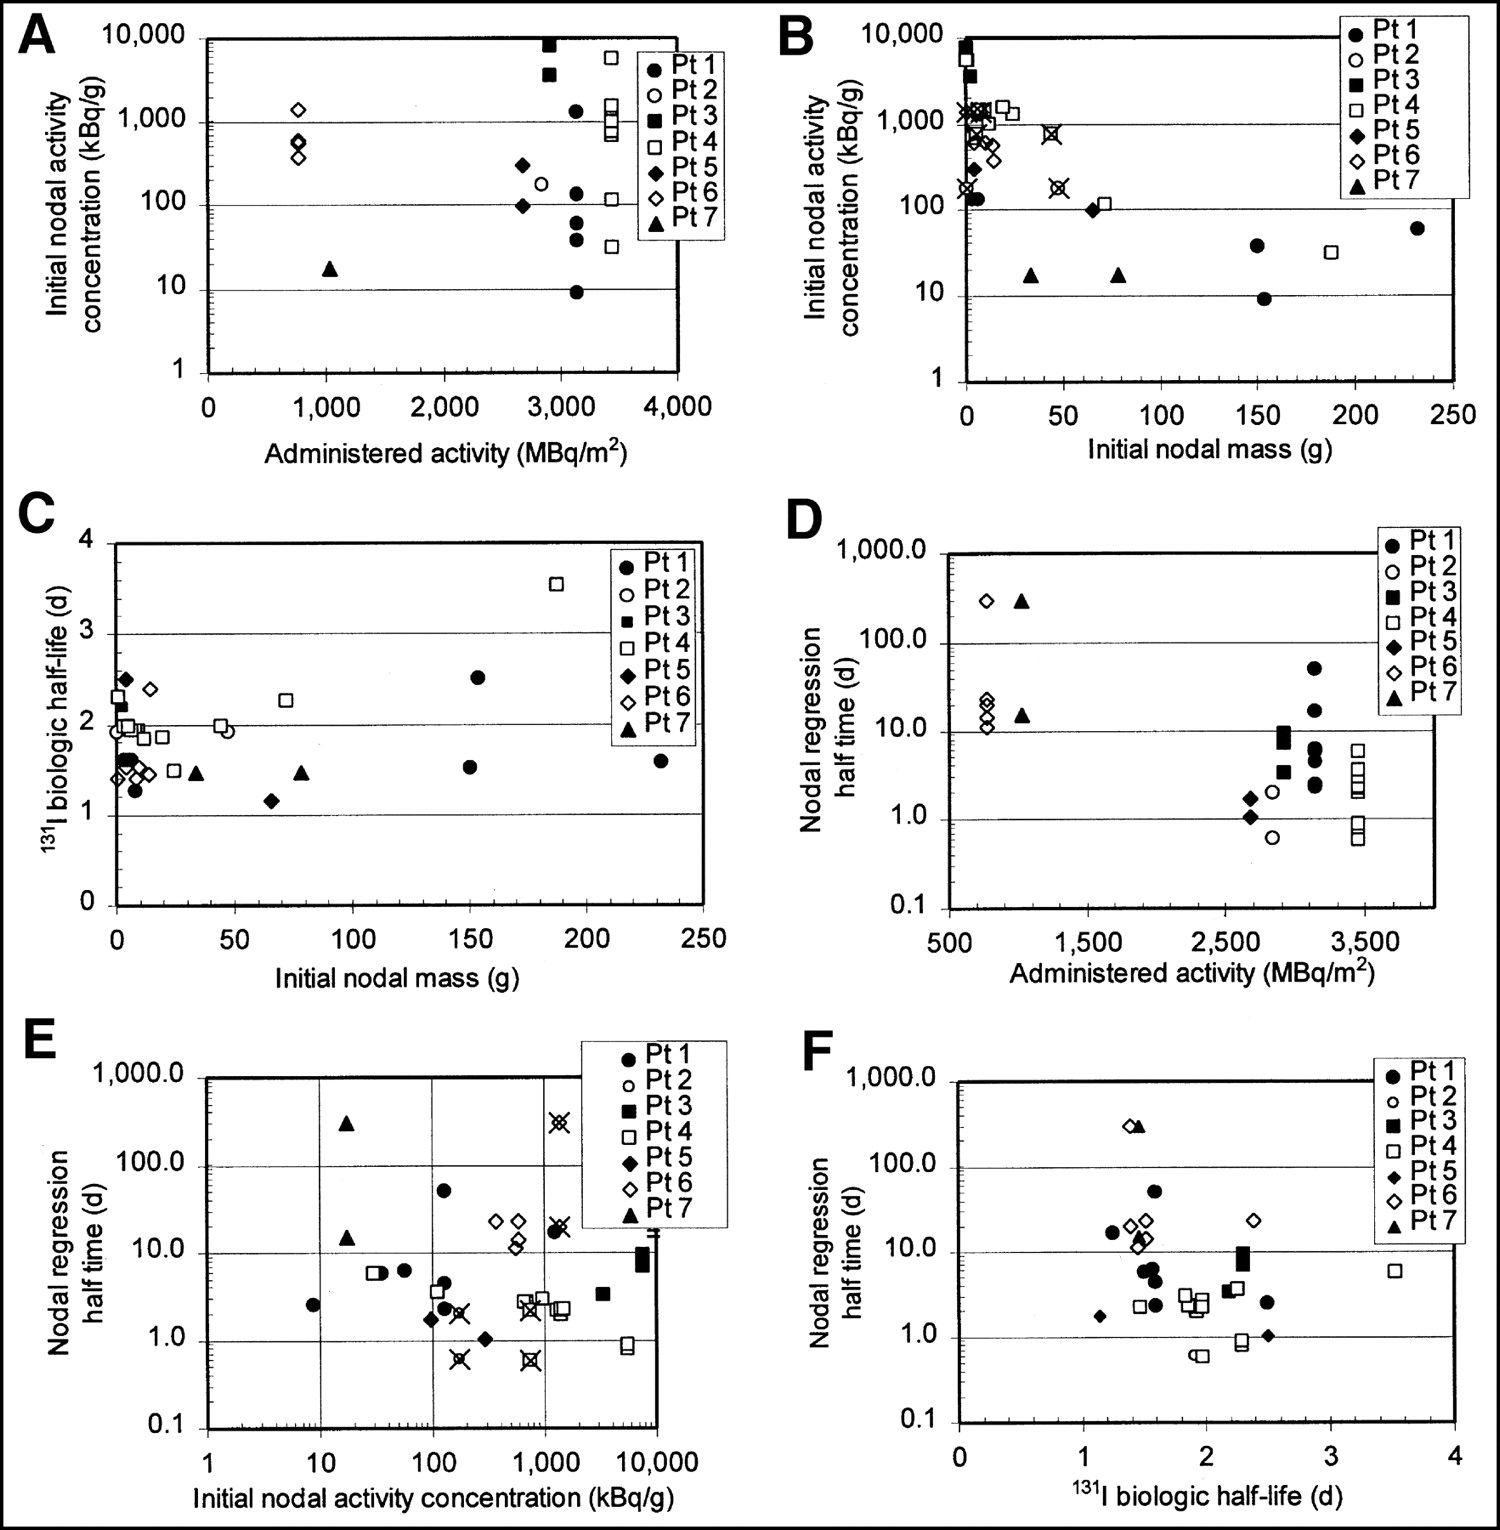
Initial activity concentrations (kBq/g) in lymph nodes varied significantly, from concentrations of <10 kBq/g to >10,000 kBq/g. As shown in Figures 2A and B, initial nodal activity concentration appeared to be more related to initial nodal mass (Fig. 2B) than to administered activity (Fig. 2A). X marks in Figure 2 identify pair nodes with dissimilar masses that were imaged in the same ROI and assigned the same activity per nodal mass. The effect of this assignment would be to artificially reduce the activity per nodal mass in the smaller node and increase the activity per nodal mass in the larger node, but to a smaller extent.

Relationship between administered activity, initial nodal mass, initial nodal activity concentration, and nodal regression half-time, 131I biologic half-life. Initial nodal activity concentrations appear to be more related to nodal mass (A) than to administered activity (B). 131I biologic half-life did not appear to depend strongly on initial nodal mass (C). Nodal regression half-time is >10 d in all nodes for those patients treated with 700–1,000 MBq/m2 injected activities and is <10 d for all except 2 nodes in patients treated with >2,800 MBq/m2 (D). In contrast, nodal regression half-time does not appear to depend strongly on node’s initial activity concentration (E). Wide variation in nodal regression half-times, ranging from <1 d to no change in mass (arbitrarily assigned to 300 d for plotting on graph), were associated with relatively small variation in 131I biologic half-life (F). X marks in B and E identify pairs of dissimilar masses that were imaged in same ROI and assigned same activity per nodal mass. Pt = patient.
Biologic half-lives ranged from about 1.1 to 2.5 d, with 1 slight outlier (an inguinal node in patient 4) at 3.5 d, and did not appear to depend on initial node mass (Fig. 2C). Intrapatient biologic half-life variation (first through third quartile range of <0.6 d) was smaller than interpatient variation (first through third quartile range of 1.3 d).
Figures 2D and 2E show that the nodal regression rate varied widely, with half-times ranging from <0.6 d (faster than the activity was observed to decrease), observed for 5 nodes, to no change in mass (infinite half-time), observed for 2 nodes. Nodal regression half-time is >10 d in all nodes for those patients treated with 700–1,000 MBq/m2 injected activities and is <10 d for all except 2 nodes in patients treated with >2,800 MBq/m2 (Fig. 2D). In contrast, nodal regression half-time did not appear to depend strongly on the node’s initial activity concentration (Fig. 2E). Wide variations in the rate of nodal regression were not associated with corresponding variations in the 131I biologic half-life in the node (Fig. 2F).
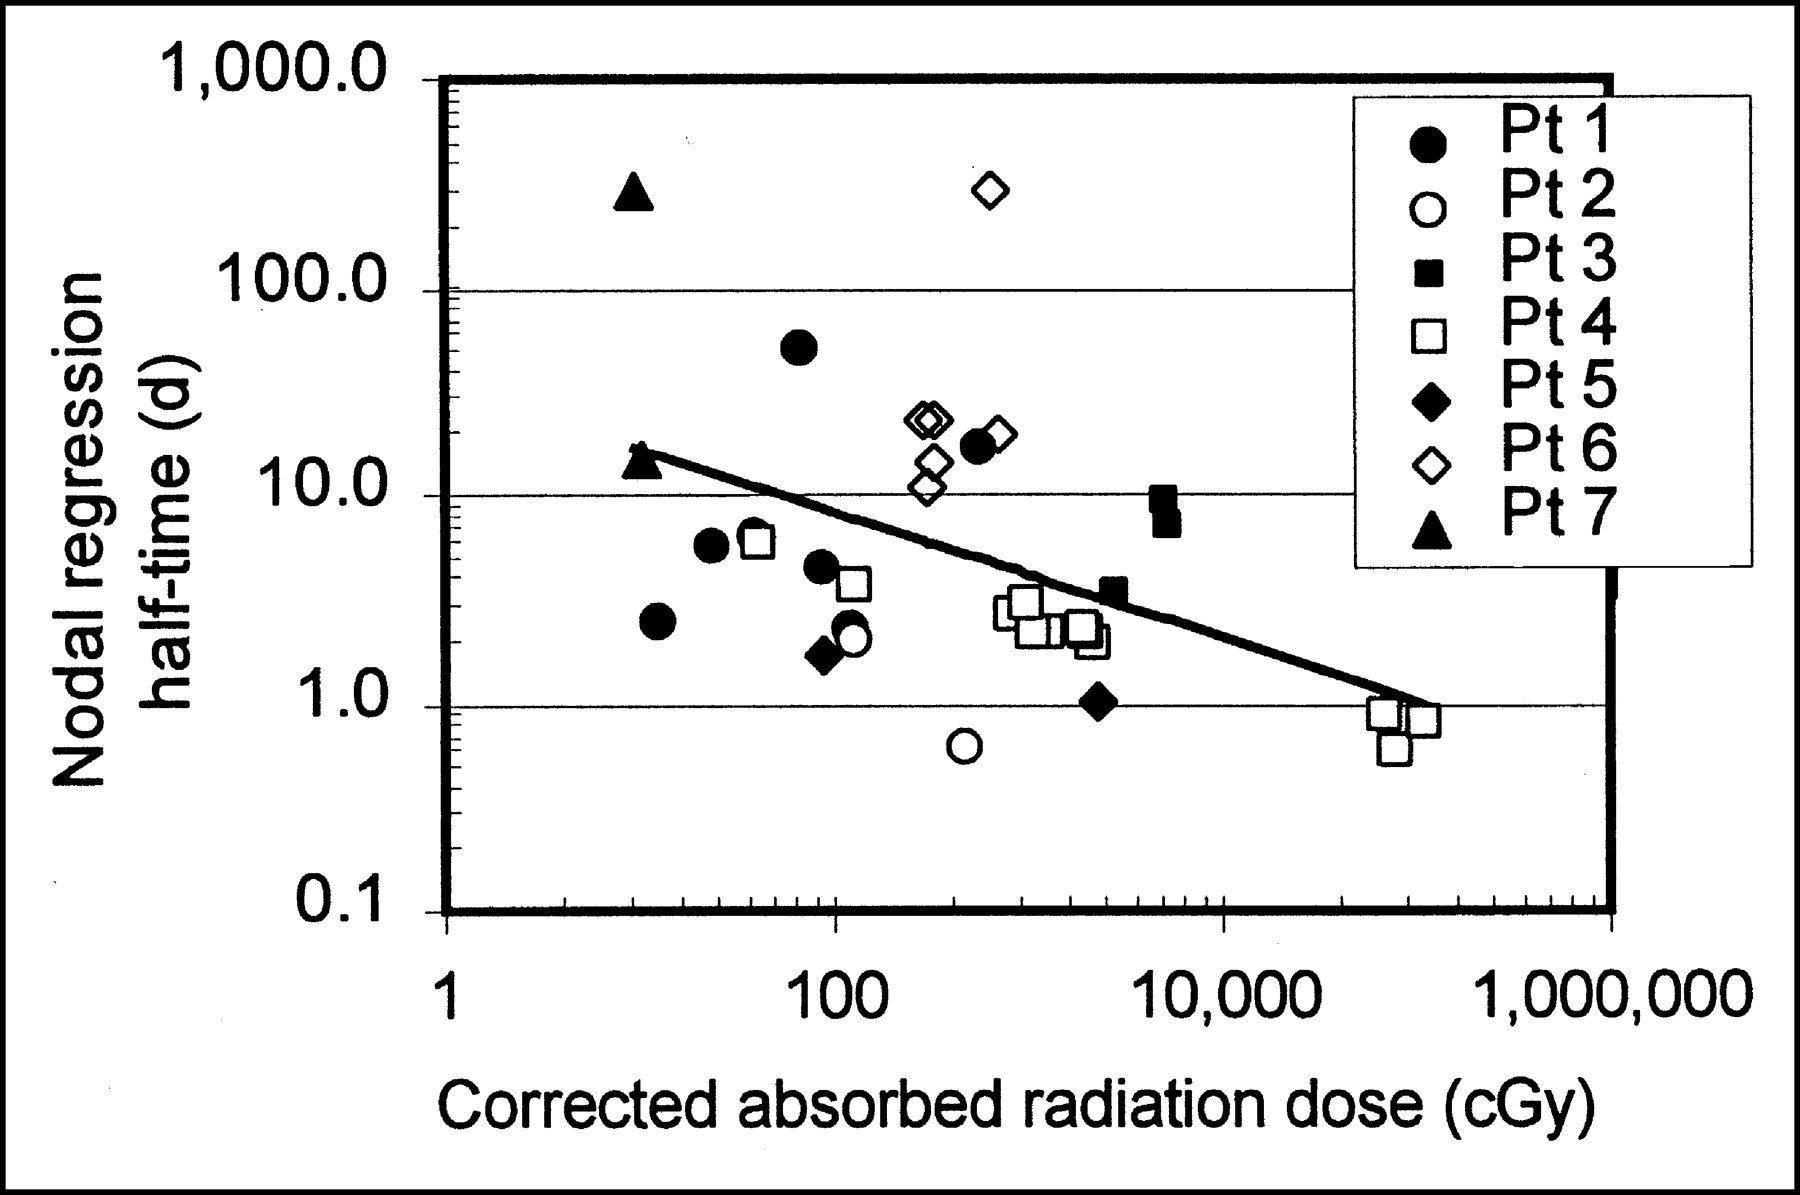
Figure 3 shows the relationship between nodal regression and absorbed radiation dose (corrected for nodal regression), although it is unclear which of these quantities is causative, because nodal regression clearly impacts absorbed radiation dose. The line in Figure 3 shows the result of a least-squares fit (with P = 0.004) to all nodal data shown.

Greater corrected absorbed radiation doses were generally associated with shorter nodal regression half-times. Line shows least-squares fit, which has P = 0.004. Pt = patient.
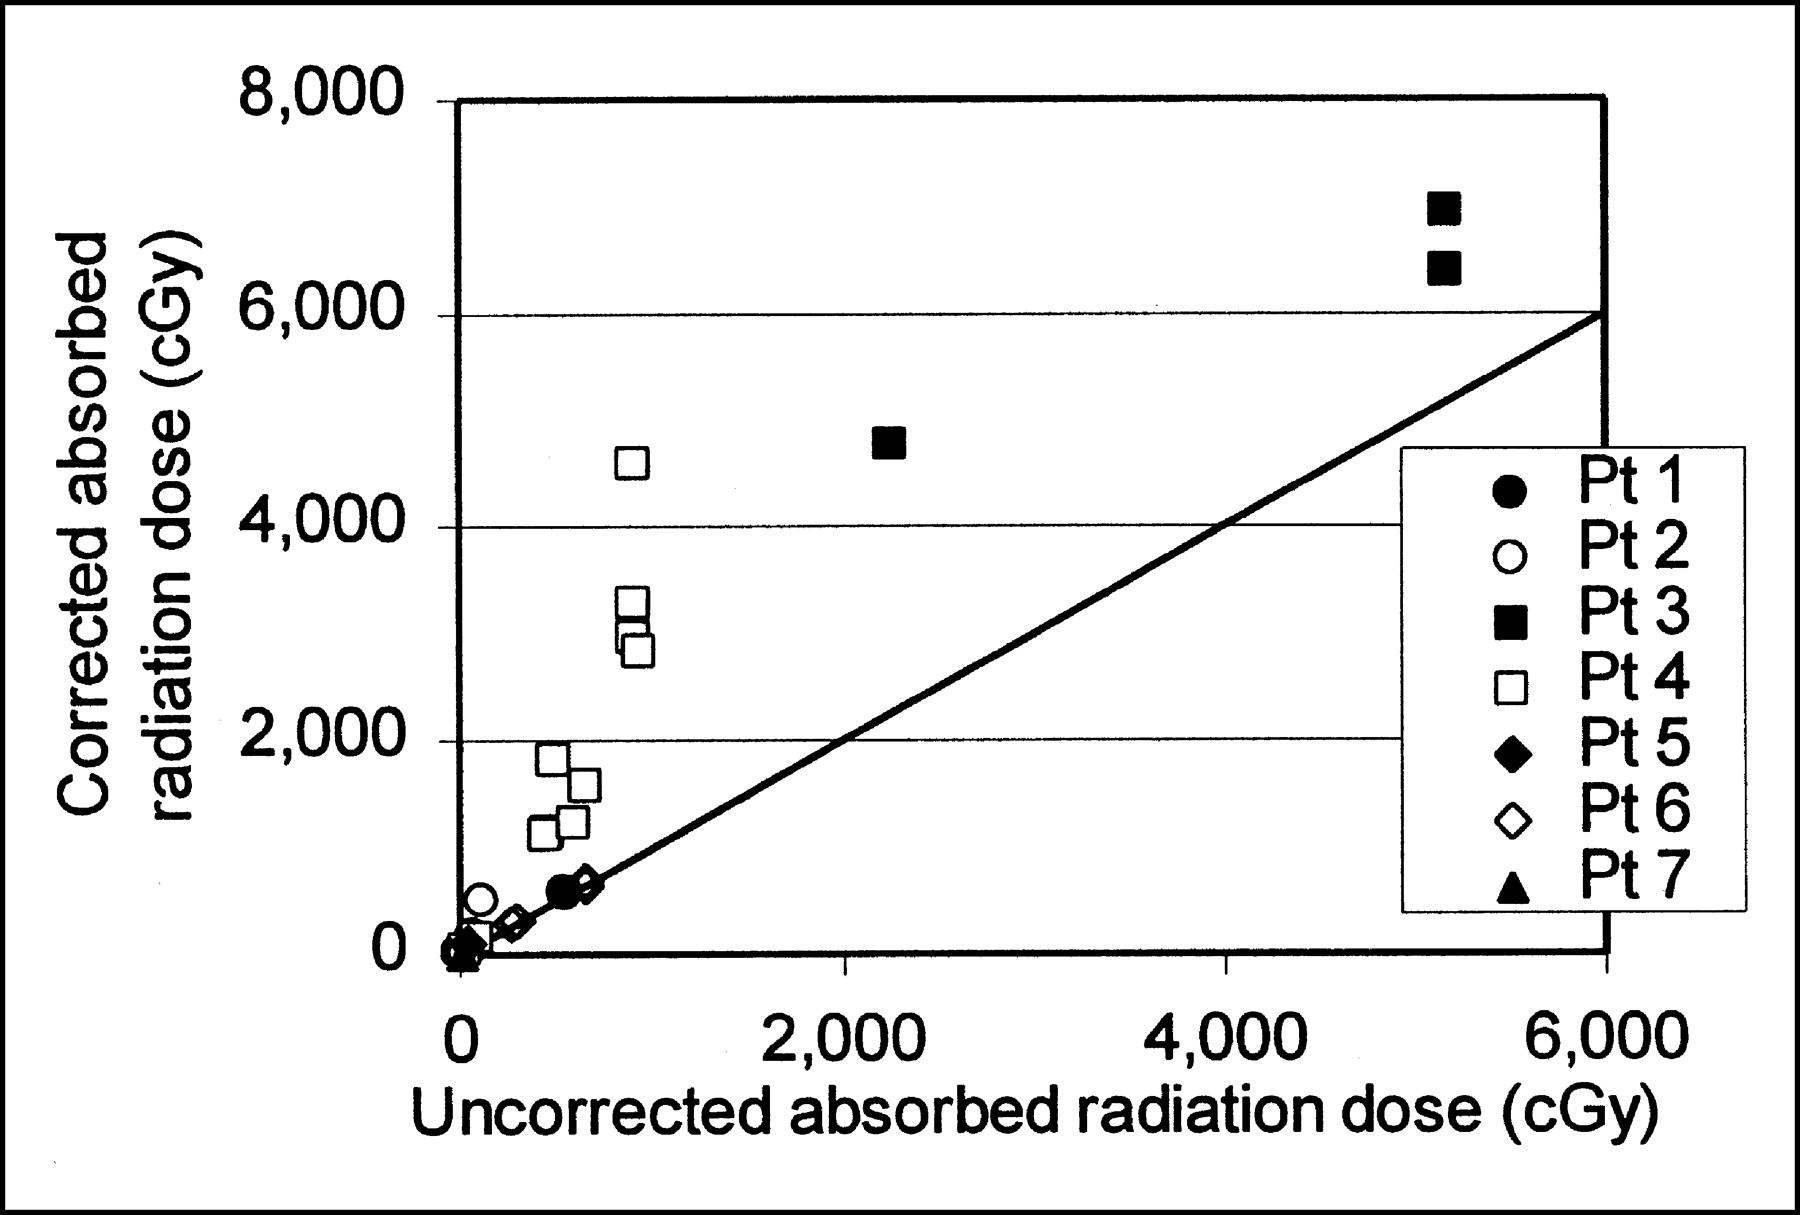
Nodal regression resulted in substantial revisions in absorbed radiation dose estimates, with corrections ranging in magnitude from 1 (no correction) to a factor of >5 for nodes with regression half times less than the activity effective half-life, and even larger adjustments (factors of 5.7–166) for the fastest-regressing nodes. Figure 4 compares revised absorbed radiation dose and the absorbed radiation dose that was predicted with no correction for nodal mass regression. Corrected radiation dose values are uniformly greater than uncorrected ones.

Corrected and uncorrected absorbed radiation dose. Dose correction generally increases with increasing absorbed radiation dose. Plot does not include nodes whose regression half-time was shorter than activity effective half-life. Plot does include line of identity for corrected and uncorrected absorbed radiation dose. Pt = patient.
Figure 5 shows the relationship between nodal regression half-time and the magnitude of the dose correction. Doses were determined by integrating to t = ∞, and the 5 fast-regressing nodes were not included. Data for all patients fell into the same pattern, with the radiation dose correction increasing dramatically with increasing nodal regression rate. Accounting for the effect of nodal mass regression resulted in dose corrections ranging from 1 (no correction) to a factor of >10, with 70% of nodes requiring a correction factor of at least 20%, and >50% of nodes requiring a correction of a factor of ≥2. The apparent asymptotic value of dose correction factor at about 2 d reflects the consistency of the 131I effective half-life, as the dose correction factor approaches infinity as the mass-regression half-life approaches the 131I effective half-life. For comparisons shown in Figures 4 and 5, doses are determined by integrating to t = ∞, and the 5 fast-regressing nodes are not included, as their doses did not converge with time. Correction factors for the 5 fast-regressing nodes, even when integrated through only the time until the final measurements, ranged from 5.7 to 166.
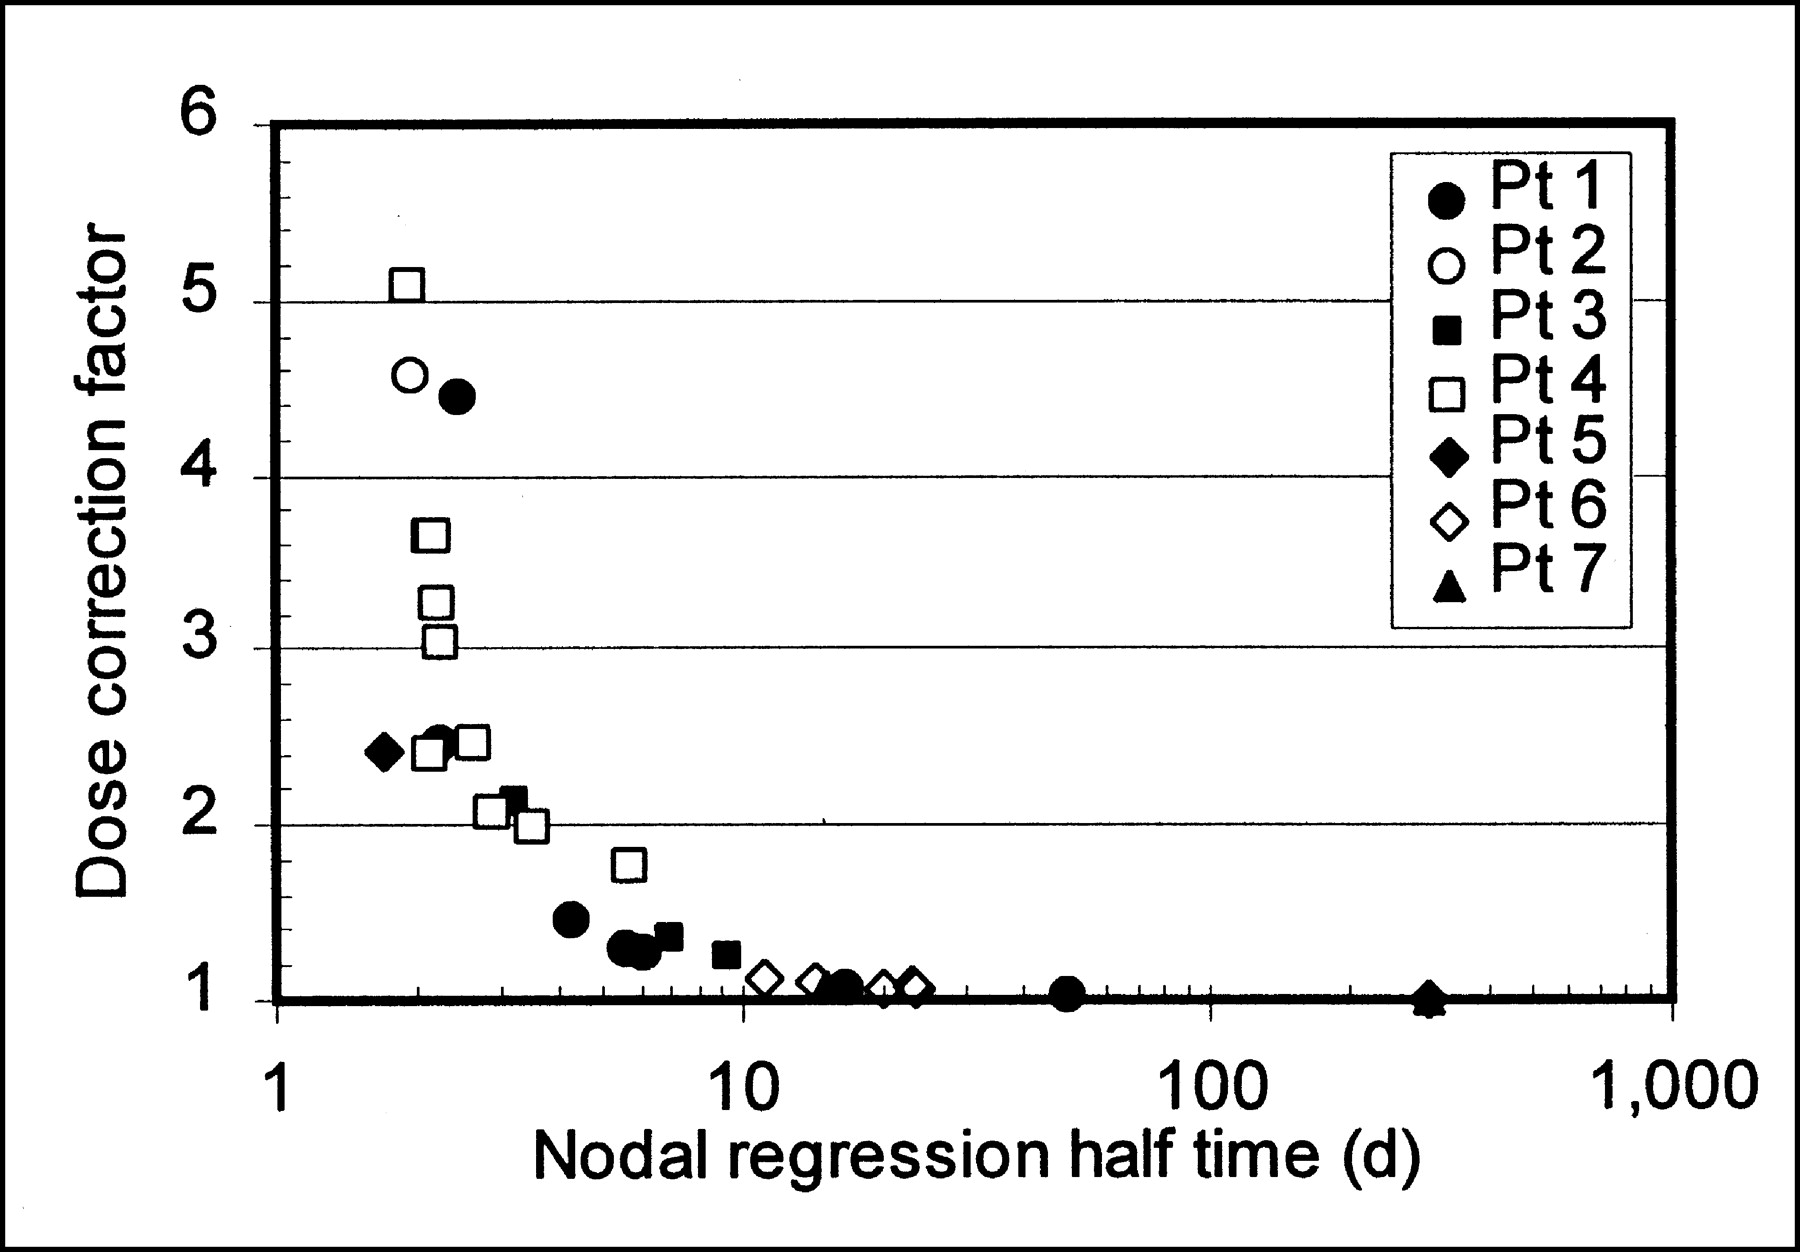
Correction factor for absorbed radiation dose resulting from nodal regression. Plot does not include nodes whose regression half-time was shorter than 131I effective half-life. Pt = patient.
To estimate dose–response, nodal response was defined as:

Although this does not represent the enduring response of the lymph node, it serves as a short-term measure of response to radiation. A value of 1 means that the nodal mass decreased to 0, whereas a value of 0 means that there was no regression. Nodal response, which represents a non-time–dependent final mass, is different than nodal regression half-time, which represents the rate at which the node regressed. Figure 6A shows that nodal response follows a more noticeable trend toward increasing response at increased absorbed radiation doses when corrected radiation absorbed doses (red symbols) are used. The red line shows a least-squares fit (P = 0.005) to nodal response versus corrected dose data. A least-squares fit to nodal response versus uncorrected dose data had a 30% smaller slope with P = 0.15 and is not shown. Dose corrections are greatest for those nodes with the highest response (Fig. 6B). For both Figures 6A and 6B, absorbed radiation dose was calculated by integrating only to the final nodal mass measurement time. The rationale for this is that measured nodal mass regression is not impacted by absorbed radiation dose that has not been delivered yet. Nodes whose absorbed radiation dose diverged with time, requiring a fixed integration interval to obtain a finite value for absorbed radiation dose, are each marked with an X. Limiting the dose integration time to the final mass measurement resulted in a maximum dose correction factor of 2.5 (excluding the 5 fast-regressing nodes). In contrast, the maximum dose correction (excluding the 5 fast-regressing nodes) for integration to t → ∞ is 5.
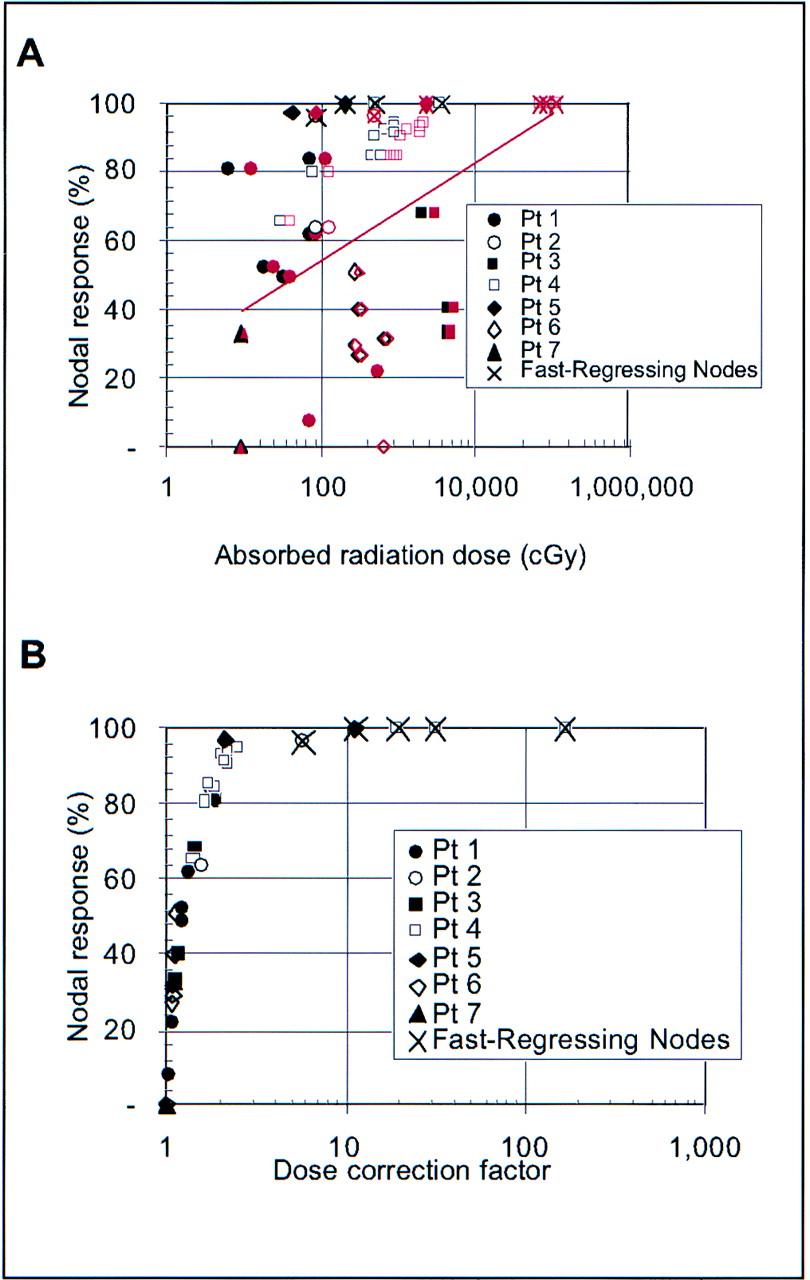
Nodal regression compared with uncorrected (black symbols) and corrected (red symbols) absorbed radiation dose (A) and dose correction factor (B). In A, uncorrected dose is shown with black symbols and corrected dose with red symbols, and red line shows least-squares fit (P = 0.005) to nodal regression vs. corrected absorbed radiation dose. Absorbed radiation dose was calculated by integrating only to final measurement time. Pt = patient.
Figure 7, which demonstrates the impact of nodal size and injected activity on corrected absorbed dose, shows that nodes with the highest radiation doses were small in size (Fig. 7A), which increased the initial 131I activity concentration, and were located in a patient who received a high injected activity (Fig. 7B), which presumably increased the rate of nodal regression.

Nodes with highest doses were small in size (A), which was consistent with higher initial 131I activity concentration, and were located in patients who received high administered activities (B). Pt = patient.
In summary, initial 131I activity concentration depended on initial nodal mass, with higher concentrations in smaller nodes, but not on injected activity (Figs. 2A and 2B). The rate of nodal regression (measured as the nodal regression half-time) depended on injected activity, but not strongly on initial activity concentration or initial nodal mass.
The lymph nodes with the highest doses were small in size and were located in a patient who received a high injected activity. In fact, all nodes with absorbed radiation doses of >700 cGy were in the high-administered-activity group, had mass regression half-times of <10 d, and had initial masses of <24 g, as demonstrated in Figure 7 (nodal regression half-time is shown in Fig. 3). As shown in Figure 2A, administered activity and initial 131I concentration in an individual node are not clearly related to each other.
DISCUSSION
Although the absorbed radiation doses (23–4,260 cGy) reported for RIT for NHL have been in the range for yielding a therapeutic response for this highly radiosensitive malignancy, therapeutic response (16–18) has often seemed disproportionately greater than expected when compared with responses from doses of external-beam radiation in patients (1,18,19).
In animal models, RIT has been shown to be more effective, less effective, or as effective as equivalent doses of external-beam radiation therapy (2). In general, tumors with a good repair capacity, as evidenced by a large shoulder on the radiation survival curve, tended to have a significant dose rate effect. This was probably also modified by tumor doubling time (2,5). In addition, other factors such as cell cycle redistribution with accumulation of cells in the G2/M phase, targeting of a rapidly proliferating subpopulation of well-oxygenated and accessible tumor cells, effects of tumor blood flow or vasculature, rapid reoxygenation of hypoxic cells, effects on repair and repopulation, and radiation- or antibody-induced apoptosis may explain, in part, the increased efficacy of RIT compared with fractionated external-beam radiation therapy (3).
There can be significant discrepancies between macroscopic and microscopic absorbed radiation dose because of the heterogeneity of radioisotope distribution in the lymph node (20–22). In quantitative autoradiography experiments, Griffith et al. (23) correlated film density with corresponding microthermoluminescent dosimeters, measuring absorbed dose heterogeneity of up to 400% for 131I-Lym-1 monoclonal antibody in Raji B-cell lymphoma xenografts. Roberson and Buchsbaum (24) combined 3-dimensional, serial-section autoradiographs with estimates of energy loss, dose-rate dependence, hypoxic fraction, and cell proliferation to reconcile external-beam radiotherapy and RIT (within measurement uncertainties) for LS174T human colon cancer xenografts treated with 60Co single-fraction exposure and 131I-labeled 17-IA monoclonal antibody therapy.
Another explanation is dose estimation: Generally, absorbed radiation dose estimates assume that initial mass is unchanged during the decay of the activity. For some circumstances, the mass of the target tissue or normal organs does not change substantially during the time period when most of the absorbed radiation dose is being delivered. However, for the 86% responders in a maximum tolerated dose, toxicity, and efficacy trial of 131I-Lym-1, nodal regression was observable within days and usually maximized within 1 wk after a therapy dose (6). Under these circumstances (rapid tumor regression), it would seem necessary to account for the changing activity concentration. Indeed, the work herein corroborates this speculation.
Our analysis showed that accounting for the effect of nodal mass regression resulted in dose corrections ranging from 1 (no correction) to a factor of >5, with 70% of nodes requiring a correction factor of at least 20% and >50% of nodes requiring a correction factor of ≥2. The size of the dose correction factor depended strongly on the rate at which nodal regression occurred, with faster regression corresponding to asymptotically higher absorbed radiation dose correction factors (Figs. 5 and 6B). Five nodes regressed so rapidly that their corrected dose no longer converged with time, leading to dose correction factors, even when bounded to the last mass-measurement time point, of 5.7–166. Corrected for mass regression, 46% of all nodes analyzed had absorbed radiation doses of >10 Gy and 32% had doses of >20 Gy.
Three quantities impacted the equation of absorbed radiation dose to a lymph node: the initial 131I activity concentration in the node, the 131I biologic half-life, and the nodal regression half-time. We found that 2 of these quantities, the initial 131I activity concentration in the node and the nodal regression half-time varied by orders of magnitude from 1 node to another, both between patients and within an individual patient. In contrast, the 131I biologic half-life was much more consistent, varying by only a factor of about 2 for all but 1 measurement, and were even more consistent for nodes within a patient.
The orders-of-magnitude node-to-node variation in 131I activity concentration in the node (Fig. 2) resulted in a wide range of initial activity concentrations and absorbed radiation doses delivered to patient nodes, independent of whether the patient was treated in the high- or low-administered-dose group. The impact of node-to-node variation is evident by comparing Figures 2A and 2B: Figure 2A, plotting administered activity per patient surface area, shows a clear bimodal distribution of activities, whereas Figure 2B shows a continuous range of node-specific initial activity concentrations.
The question is: Why is the measured activity reduction rate (biologic half-life) independent of wide variations in nodal regression rate, as shown in Figure 2F? This appears to mean that nodes whose masses regress hold onto the radiopharmaceutical (in terms of concentration) better than those that do not regress. The effect is most apparent in the 5 nodes whose regression time constant is actually shorter than the effective half-life (reflecting both pharmacokinetics and physical radionuclide decay). In these nodes, the activity concentration actually increases with time. Figure 2F shows that the nodal regression for the fastest-regressing nodes is actually not an aberration but is simply the end of a continuum of observed regression half-times. One additional clue is that the nodal regression half-time is influenced by the amount of administered activity (Fig. 2D).
If nodal regression was simply related to absorbed radiation dose, the nodes with the highest absorbed radiation doses would have also had the greatest amounts of regression. Although this relationship was present, as Figure 6A shows, it was not uniformly so. In addition to radiobiologic considerations, one possible reason is that our final mass observations may have stopped too early in some instances: The final mass was measured only 3–9 d after the treatment, limited by the fact that patients were treated with multiple radiopharmaceutical injections, so mass measurements at extended times would have included further radiation doses. The improvement in apparent dose–response that we observed when radiation dose was corrected for nodal regression is consistent with more recent reports on improvements in tumor dose–response (25) as well as dose–response relationships in normal tissue damage (26).
CONCLUSION
The results reported here highlight the importance of accounting for mass changes in assessing absorbed radiation dose for nodes (or other tissues) that regress soon after treatment starts. Accounting for the effect of nodal regression resulted in absorbed radiation dose corrections ranging from 1 (no correction) to a factor of >10, with 70% of nodes requiring a correction factor of at least 20%, and >50% of nodes requiring a correction factor of ≥2. Corrected for mass regression, 46% of all nodes analyzed had absorbed radiation doses of >10 Gy and 32% had doses of >20 Gy.
Acknowledgments
The authors thank Desiree Goldstein, RN, Linda Kroger, MD, Aina Yuan, PhD, and Rebecca Myer, BS, for their contributions to data acquisition and initial analysis of nodal regression. This research was supported by grants from the National Cancer Institute (PO1-CA47829) and the U.S. Department of Energy Office of Biologic and Environmental Research and was performed under the auspices of the U.S. Department of Energy by the Lawrence Livermore National Laboratory under contract W-7405-ENG-48.
Footnotes
Received Dec. 20, 2002; revision accepted Apr. 21, 2003.
For correspondence or reprints contact: Christine L. Hartmann Siantar, PhD, Lawrence Livermore National Laboratory, P.O. Box 808, Livermore, CA 94550.
E-mail: chs{at}llnl.gov
REFERENCES
In this issue


Jump to section
Related Articles
Cited By...
- Dosimetry in Clinical Radiopharmaceutical Therapy of Cancer: Practicality Versus Perfection in Current Practice
- 131I-Tositumomab Radioimmunotherapy: Initial Tumor Dose-Response Results Using 3-Dimensional Dosimetry Including Radiobiologic Modeling
- Methodology to Incorporate Biologically Effective Dose and Equivalent Uniform Dose in Patient-Specific 3-Dimensional Dosimetry for Non-Hodgkin Lymphoma Patients Targeted with 131I-Tositumomab Therapy
- Dose-Fractionated Radioimmunotherapy in Non-Hodgkin's Lymphoma Using DOTA-Conjugated, 90Y-Radiolabeled, Humanized Anti-CD22 Monoclonal Antibody, Epratuzumab