


Abstract
The limited spatial resolution of SPECT scanners does not allow an exact measurement of the local radiotracer concentration in brain tissue because partial-volume effects (PVEs) underestimate concentration in small structures of the brain. The aim of this study was to determine which brain structures show greater influence of PVEs in SPECT studies on healthy volunteers and to investigate aging effects on SPECT after the PVE correction. Methods: Brain perfusion SPECT using 99mTc-ethylcysteinate dimer was performed in 52 healthy men, 18–86 y old. The regional cerebral blood flow (rCBF) was noninvasively measured using graphical analysis. SPECT images were corrected for PVEs using gray-matter volume, which was segmented from coregistered MR images and convoluted with spatial resolution of SPECT scanners. Absolute rCBF data were measured using a 3-dimensional (3D) stereotactic template for regions of interest on anatomically standardized SPECT. We examined correlation of advancing age with rCBF before and after the PVE correction. To validate the correction method for PVEs, a Hoffman 3D brain phantom experiment was also performed. Results: The PVE correction remarkably reduced the coefficient of variation for SPECT counts in the whole phantom. The PVE correction made the rCBF distribution more homogeneous throughout the brain with less intersubject variation than the original distribution. There were significant negative correlations between age and adjusted rCBF in the bilateral perisylvian and medial frontal areas. These correlations remained significant after the PVE correction. Instead of a positive correlation in the medial temporal structures between age and adjusted rCBF before the PVE correction, the sensorimotor and parietal areas mainly showed positive correlations after the correction. Conclusion: SPECT data reflect both brain volume loss and functional changes. Use of the PVE correction in brain perfusion SPECT provides a more accurate determination of rCBF even in healthy volunteers.
Functional changes in the brains of healthy elderly people and patients with neurodegenerative disorders have been studied widely by SPECT. However, due to the limited spatial resolution of SPECT, the accurate measurement of tracer concentration in brain structures depends on several physical limitations—particularly, the relation between object size and scanner spatial resolution. This relation, known as the partial-volume effect (PVE), biases the measured concentration in small structures by diminishing the true concentration. The PVE causes a volume-averaging effect between the tissue elements of gray matter, white matter, and cerebrospinal fluid in a region of brain.
Recently, the high-resolution anatomic detail available with MRI techniques has led to the development of MR-based methods to correct PET or SPECT data for PVEs (1–5). We have already applied this approach to determine which brain structures show the greatest influence of PVEs in SPECT studies on Alzheimer’s disease (5). The aim of this study was to determine which brain structures show the greatest influence of PVEs in SPECT studies in healthy men and to investigate aging effects on brain perfusion SPECT before and after correction for PVEs.
MATERIALS AND METHODS
Subjects
The subjects were 52 healthy men, 18–86 y old (mean ± SD, 58.4 ± 20.5 y). Their performance was within normal limits on both the Wechsler Memory Scale-Revised (6) and the Wechsler Adult Intelligence Scale-Revised (7). The Mini-Mental State Examination score (8) for subjects >55 y old ranged from 26 to 30 (mean ± SD, 28.6 ± 1.4). All subjects were right-handed and were screened by questionnaire and medical history to exclude those with medical problems potentially affecting the central nervous system. In addition, none of them had asymptomatic cerebral infarction detected by T2-weighted MRI. The Ethics Committee of the National Center of Neurology and Psychiatry approved this study for healthy volunteers, all of whom gave informed consent to participate.
Global and Regional CBF Measurements
Before SPECT was performed, an intravenous line was established in all subjects. They were injected, while lying down in the supine position with eyes closed in a dimly lit, quiet room. Each received a 600-MBq intravenous injection of 99mTc-ethylcysteinate dimer (99mTc-ECD). The global CBF was noninvasively measured using graphical analysis, as has been described in reports without any blood sampling (9). The passage of the tracer from the aortic arch to the brain was monitored in a 128 × 128 format for 100 s at l-s intervals using a rectangular gamma camera with a parallel-hole collimator on a triple-head SPECT system (Multispect3; Siemens Medical Systems, Inc.). Regions of interest (ROIs) were hand-drawn over the aortic arch (ROIaorta) and both brain hemispheres (ROIbrain). A hemispheric brain perfusion index (BPI) was determined as follows before the start of the initial backdiffusion of the tracer from brain to blood (9):
 Eq. 1 where ku is the unidirectional influx rate for the tracer from blood to brain, which is determined by the slope of the line in graphical analysis within the first 30 s after injection. ROIaorta size and ROIbrain size are the drawn sizes of ROI for aorta and brain, respectively. Then, the BPI was converted to global cerebral blood flow (CBF) values using the following regression equation obtained from previous 133Xe inhalation studies (9):
 Eq. 2
Eq. 2
Ten minutes after the injection of 99mTc-ECD, brain SPECT was performed using cameras equipped with high-resolution fanbeam collimators. For each camera, projection data were obtained in a 128 × 128 format for 24 angles of 120° at 50 s per angle. A Shepp and Logan Hanning filter was used as a filtered backprojection method for SPECT image reconstruction at 0.7 cycle/cm. Attenuation correction was performed using Chang’s method with an optimized effective attenuation coefficient of 0.09 cm−1. To calculate regional CBF (rCBF) and to correct for incomplete retention of 99mTc-ECD in the brain, the following linearization algorithm (10) of the curvilinear relationship between brain activity and blood flow was applied:
 Eq. 3 where Fi and Fr represent CBF values for a region i and a reference region, respectively, and Ci and Cr are the SPECT counts for the region i and the reference region r, respectively. The cerebral hemisphere was used as the reference region, and global CBF obtained from graphical analysis was substituted for Fr. The linearization factor α was set to 2.59 (10).
PVE Correction
Correction for PVE was performed for atrophy correction in SPECT images using MRI (1.0-T system, Magnetom Impact Expert, Siemens) on a Sun SPARC computer (Sun Microsystems, Inc.) using ANALYZE version 2.5 (Biologic Imaging Resource, Mayo Foundation), Automated Image Registration (AIR) version 5.05 (www.loni.ucla.edu/NCRR/Software/AIR.htm) (11,12), and Statistical Parametric Mapping 99 (SPM99) running on MATLAB, version 5.3 (Mathworks Inc.), as described previously (5). This correction was mainly based on the method described by Mueller-Gaertner et al. (1) and Labbe et al. (2). A three-dimensional (3D) volumetric acquisition of a T1-weighted gradient-echo sequence produced a gapless series of thin sagittal sections using a magnetization preparation rapid acquisition gradient-echo sequence (echo time/repetition time, 4.4/11.4; flip angle, 15°; acquisition matrix, 256 × 256; slices thickness, 1.23 mm). The acquired MR images were reformatted to gapless 2-mm-thick transaxial images. MR images were then converted to the same isometric matrix size as that for SPECT images using ANALYZE. SPM99 then segmented these isometric MR images into gray matter, white matter, cerebrospinal fluid, and other compartments. The segmentation procedure involves calculating for each voxel a Bayesian probability of belonging to each tissue class based on a priori MRI information with inhomogeneity correction for magnetic field (13). The AIR software was used to align the SPECT to the MRI scans of each subject using a 6-parameter rigid-body transformation as described by Ibanez et al. (4). Before coregistration of SPECT and MRI, the outer scalp was removed from MRI by applying a binary mask for the whole brain (mentioned later) to the MRI. A 3D convolution with the point spread function of the SPECT device (assumed to be a simple 3D gaussian with full width at half maximum [FWHM] of 9.0 × 9.0 × 9.0 mm) was performed to obtain coefficients of dispersion for each voxel as also described by Ibanez et al. (4). This procedure of identification of spatial resolution between gray-matter SPECT and MR images makes it possible to correct PVEs by division of these 2 images in the final procedure. These convoluted gray-matter and white-matter images were normalized to have a maximum count of 1.0 as 32-bit real values. A binary volume image was created from this convoluted gray-matter image with the threshold set to 35% of the maximum value as a mask image for gray matter. A mask image for the whole brain was created from this mask image for gray matter by filling the interior holes in the brain. White- matter SPECT images were then simulated from these normalized white-matter MR images with convolution as follows. The maximum count of 1.0 for the normalized white-matter MR image was replaced by the maximum SPECT count in the white matter. To get the maximum count for the white matter of SPECT, an ROI was automatically determined by setting the threshold to >95% of the maximum count density of the white-matter MR images. Thus, an automatically determined ROI exists in the centrum semiovale, where manual ROIs had been drawn in a previous study (5). The gray-matter SPECT images were obtained by subtraction of these white-matter SPECT images from the original SPECT images coregistered to MRI. The gray-matter SPECT image was then divided by the normalized gray-matter MR image with equivalent spatial resolution to SPECT on a voxel-by-voxel basis. The mask image for gray matter was applied to this divided image. To avoid edge effects resulting form this division on a voxel-by-voxel basis, we imposed a constraint on the algorithm as described by Ibanez et al. (4). The maximal corrected rCBF value for any voxel could not exceed the maximal voxel rCBF value in the SPECT image before the PVE correction. A global gray-matter CBF value after the PVE correction was then set to the same value as that before the PVE correction. The entire procedure is summarized in Figure 1.
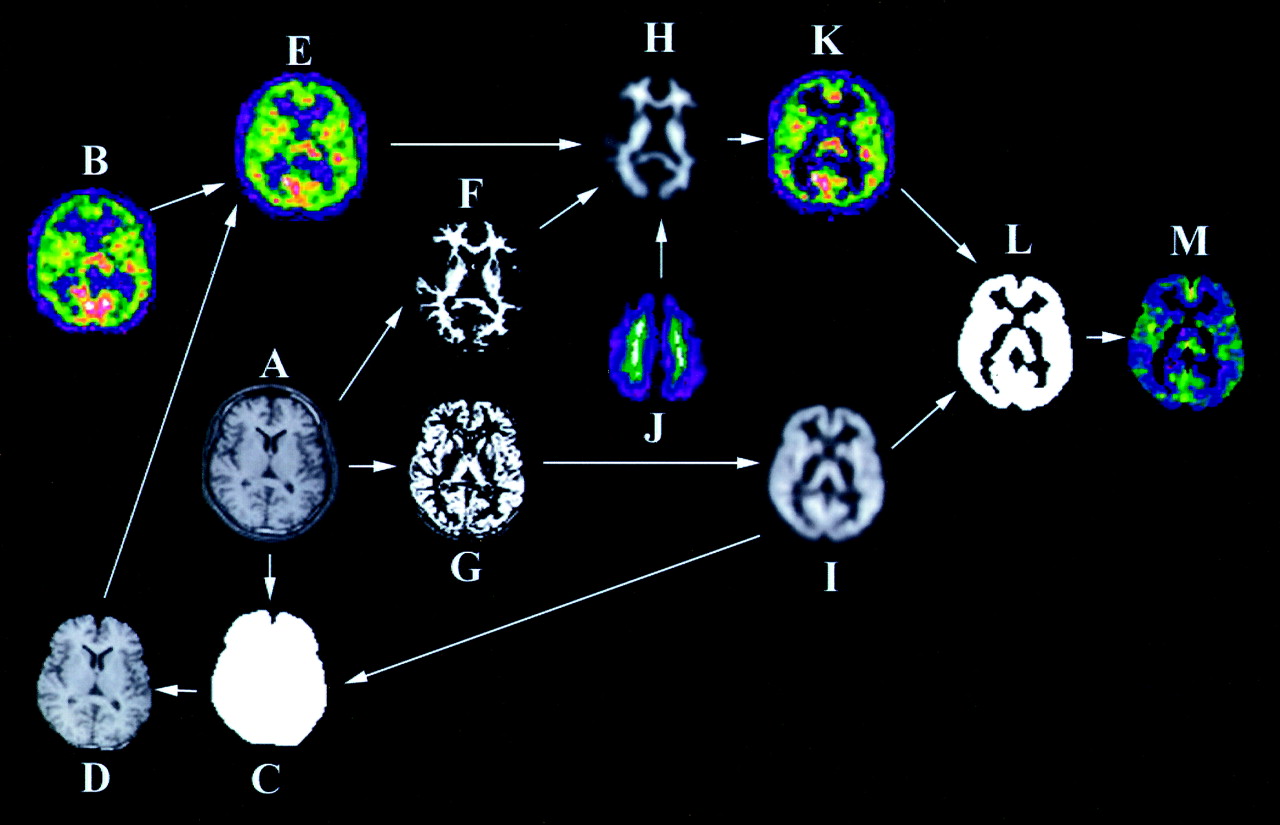
Procedures of correction algorithm for PVEs in SPECT data using MR images. Original SPECT image (B) was coregistered to MRI after scalp editing (D) of original MR image (A) using binary mask for whole brain (C). Original MRI was segmented into white matter (F) and gray matter (G). Segmented images were convoluted with point spread function of SPECT device. White-matter SPECT image (H) was then simulated from convoluted white-matter MR image (H). For this simulation, maximum count for white matter of SPECT, ROI was automatically determined by setting threshold to >95% of maximum count density of white-matter MR images (J). Gray-matter SPECT images (K) were obtained by subtraction of simulated white-matter SPECT image from original SPECT image coregistered to MRI (E). Lastly, gray-matter SPECT image (K) was divided by convoluted gray-matter MR image (I) on voxel-by-voxel basis. Gray-matter SPECT image with PVE correction (M) was finally obtained from application of binary mask for gray matter (L) to divided image.
Phantom Study
To validate the correction method for PVEs, a Hoffman 3D brain phantom (Biodex Medical Systems, Inc.) (14) experiment was performed. For both SPECT and MRI acquisitions, the phantom was filled with a solution containing 40 kBq/mL 99mTcO4− and 4 mmol/mL Cu2SO4, respectively. MRI and SPECT data of the filled phantom were then acquired in the same manner as in the human study. The PVE correction of SPECT data was performed as described above.
Image Formatting and Analysis
All subsequent image manipulation and data analysis were performed on a personal computer with an operating system of Windows XP (Microsoft). Gray-matter SPECT images before and after atrophy correction and convoluted gray-matter images segmented from MRI were spatially normalized in SPM99 to a standardized stereotactic space based on the Talairach and Tournoux atlas (15), using 12-parameter linear affine normalization and further 12 nonlinear iteration algorithms with an original template for 99mTc-ECD (16) and with a template for a priori gray matter of SPM99, respectively. Images were then smoothed using a 12-mm FWHM isotropic gaussian kernel. The initial parameters of the image matrix were 128 × 128 × n, where n = the number of slices covering the whole brain. The final image format is 16 bit, with a matrix size of 79 × 95 × 68 and a voxel size of 2 × 2 × 2 mm.
Data were analyzed using the SPM99 program. Statistical parametric maps are spatially extended statistical processes used to characterize regionally specific effects in imaging data. SPM99 combines the general linear model and the theory of gaussian fields (17) to make statistical inferences about regional effects. We compared SPECT data before and after the PVE correction in a paired manner. Absolute rCBF data were measured using a 3D stereotactic ROI template (3DSRT) (18) on anatomically standardized SPECT before and after the PVE correction. We also examined the correlation of advancing age with rCBF before and after the PVE correction using SPM99. The analysis was performed with or without implication of changes in global CBF levels as a confounding covariate. The gray-matter threshold was set at 0.8. We first used the raw data (absolute rCBF parametric maps without global normalization obtained from Eq. 3) and then adjusted rCBF images (normalization of global CBF values obtained from Eq. 2 for each subject to 50 mL/100 g/min with proportional scaling) regarding relative rCBF distribution. Correlation of advancing age with gray-matter volume was also examined using voxel-based morphometry as described in a previous study (19). The resulting set of values for each contrast constituted a statistical parametric map of the t statistic SPM{t}. The SPM{t} maps were then transformed to the units of normal distribution (SPM{Z}), and the height threshold was set to P < 0.001. The resulting regions were then examined in terms of multiple comparisons. The significance of each region was estimated with a threshold of P = 0.05 using distributional approximations from the theory of gaussian fields (17).
RESULTS
Phantom Study
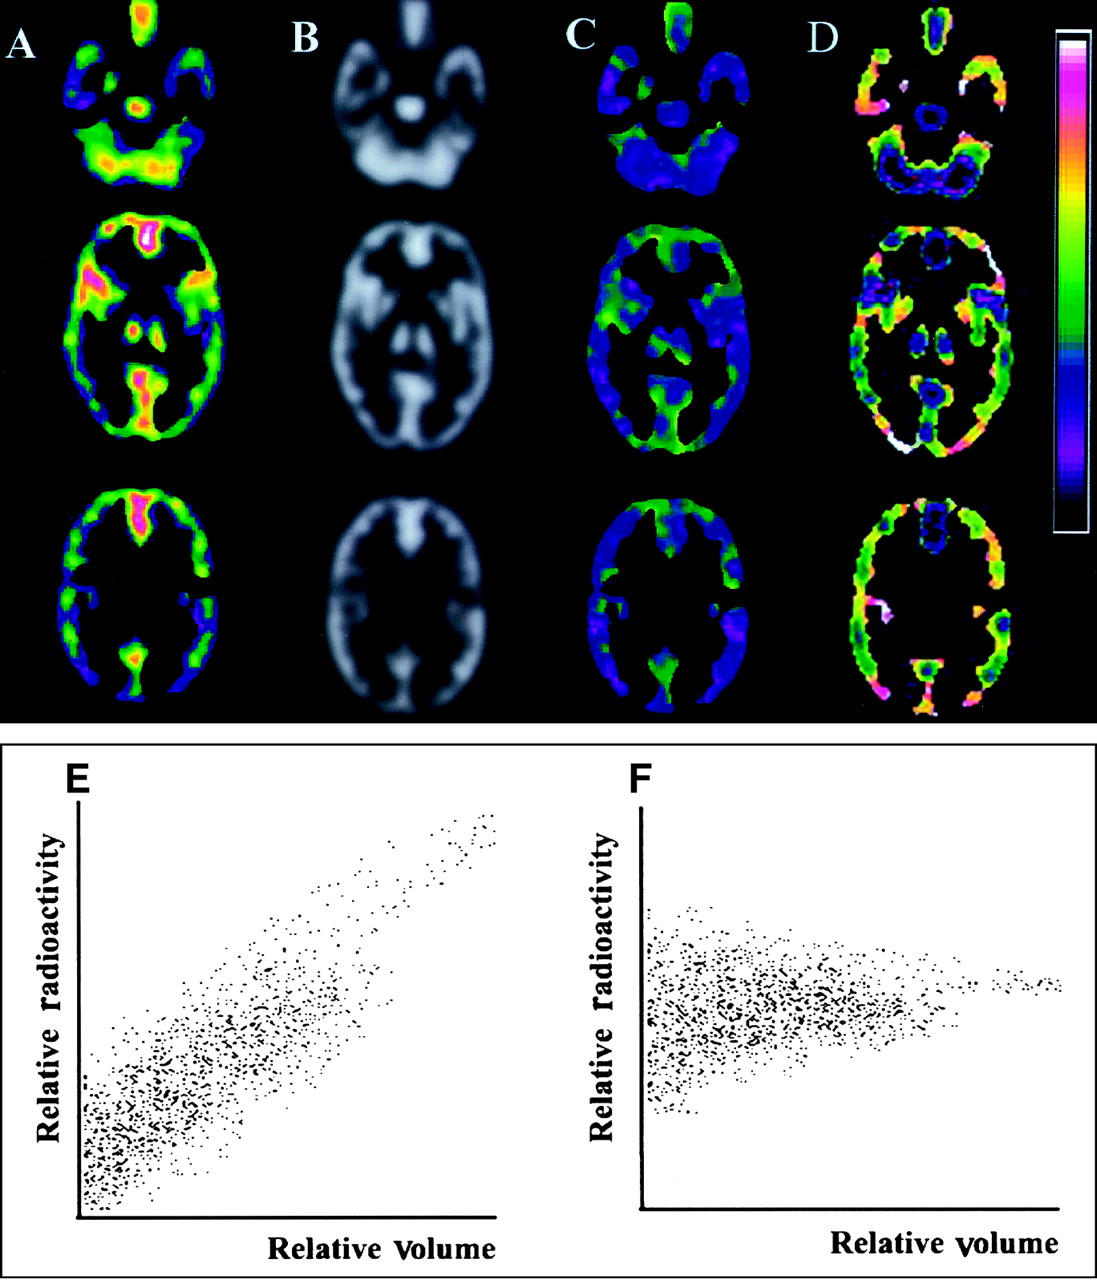
Figure 2A shows SPECT images before and after the PVE correction, MR images convoluted with spatial resolution of SPECT scanners, and a correction map for PVEs. The SPECT image corrected for PVEs provided more homogeneous tracer distribution throughout the phantom than the original SPECT image. The coefficient of variation for SPECT counts in the whole phantom decreased from 30.3% to 12.4% after the PVE correction. Regional SPECT counts showed a linear correlation with regional volume obtained from convoluted MRI before the PVE correction in scatter plots (Fig. 2B). After the PVE correction, this linear relationship became flat, which indicates uniform SPECT counts throughout the phantom irrespective of regional volume.

Phantom study for validation of correction algorithm for PVEs. (A–D) SPECT images for Hoffman phantom before and after PVE correction. Division of original SPECT image (A) for Hoffman 3D brain phantom by MR image convoluted with point spread function of SPECT scanner (B) provided SPECT image corrected for PVEs (C). Correction map (D) was created by division of SPECT image corrected for PVEs (C) by original SPECT image (A). PVE correction provided much more homogeneous tracer distribution throughout phantom than that in original SPECT. (E and F) Relationship between regional SPECT counts and regional gray-matter volume in Hoffman phantom. (E) Regional SPECT counts showed linear correlation with regional volume obtained from convoluted MRI before PVE correction in scatter plots. (F) After PVE correction, linear relationship became flat, which indicates independence of SPECT counts from regional volume.
Comparison of SPECT Images Before and After PVE Correction
Spatially normalized SPECT images for average and SDs in 52 healthy men are shown before and after the PVE correction in Figure 3. Figure 4 shows SPM99 results for differences of absolute rCBF before and after the PVE correction. The PVE correction made the rCBF distribution more homogeneous with less intersubject variation than the original distribution. This homogeneity is confirmed in Table 1 using 3DSRT. The PVE correction reduced the regional differences in average values of absolute rCBF from 15.0 to 9.2 mL/100 g/min. Moreover, the correction resulted in a 19.9% reduction, on average, in the SD of the absolute rCBF. On calculating rCBF from global CBF, which is constant before and after the PVE correction according to Equation 3, the PVE correction reduces the rCBF in the cerebellum, basal forebrain, cingulate gyri, medial temporal areas, basal ganglia, insula, medial occipital areas, and temporal cortices, while increasing the rCBF in the perisylvian, medial and upper frontal, medial occipital, sensorimotor, and parietal cortices.
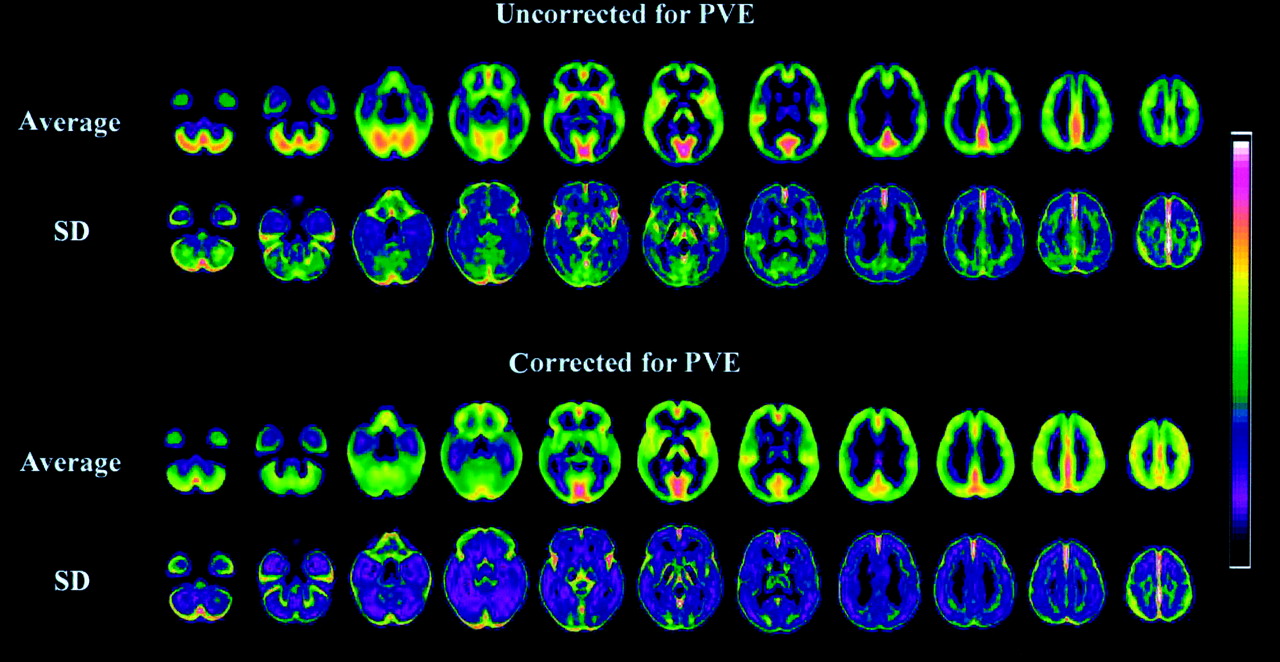
Spatially normalized gray-matter SPECT images for average and SDs in 52 healthy men before and after PVE correction. Note more homogeneous distribution and less SD of rCBF after PVE correction.

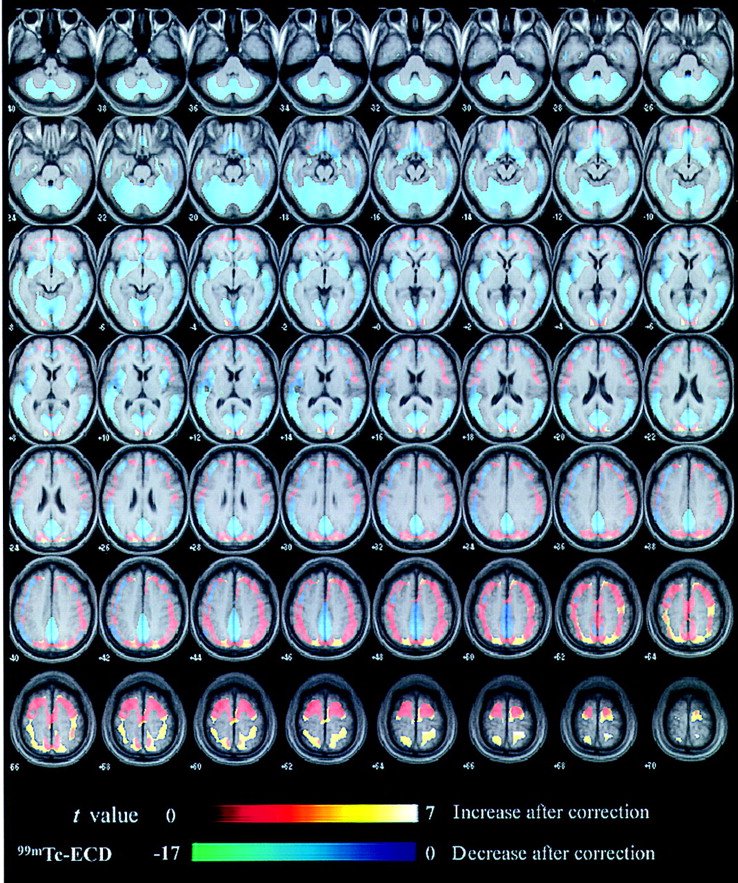
SPM99 results for differences of absolute rCBF before and after PVE correction. Warm color bar and cool color bar represent increase and decrease of rCBF after PVE correction, respectively.
Absolute Changes of rCBF After PVE Correction
Aging Effects on Global CBF
The average and SD of global CBF values for 52 healthy men was 40.6 ± 4.6 mL/100 g/min. There was a significant negative correlation with age and global CBF values (P < 0.001; r = −0.484).
Aging Effects on rCBF and Gray-Matter Volume
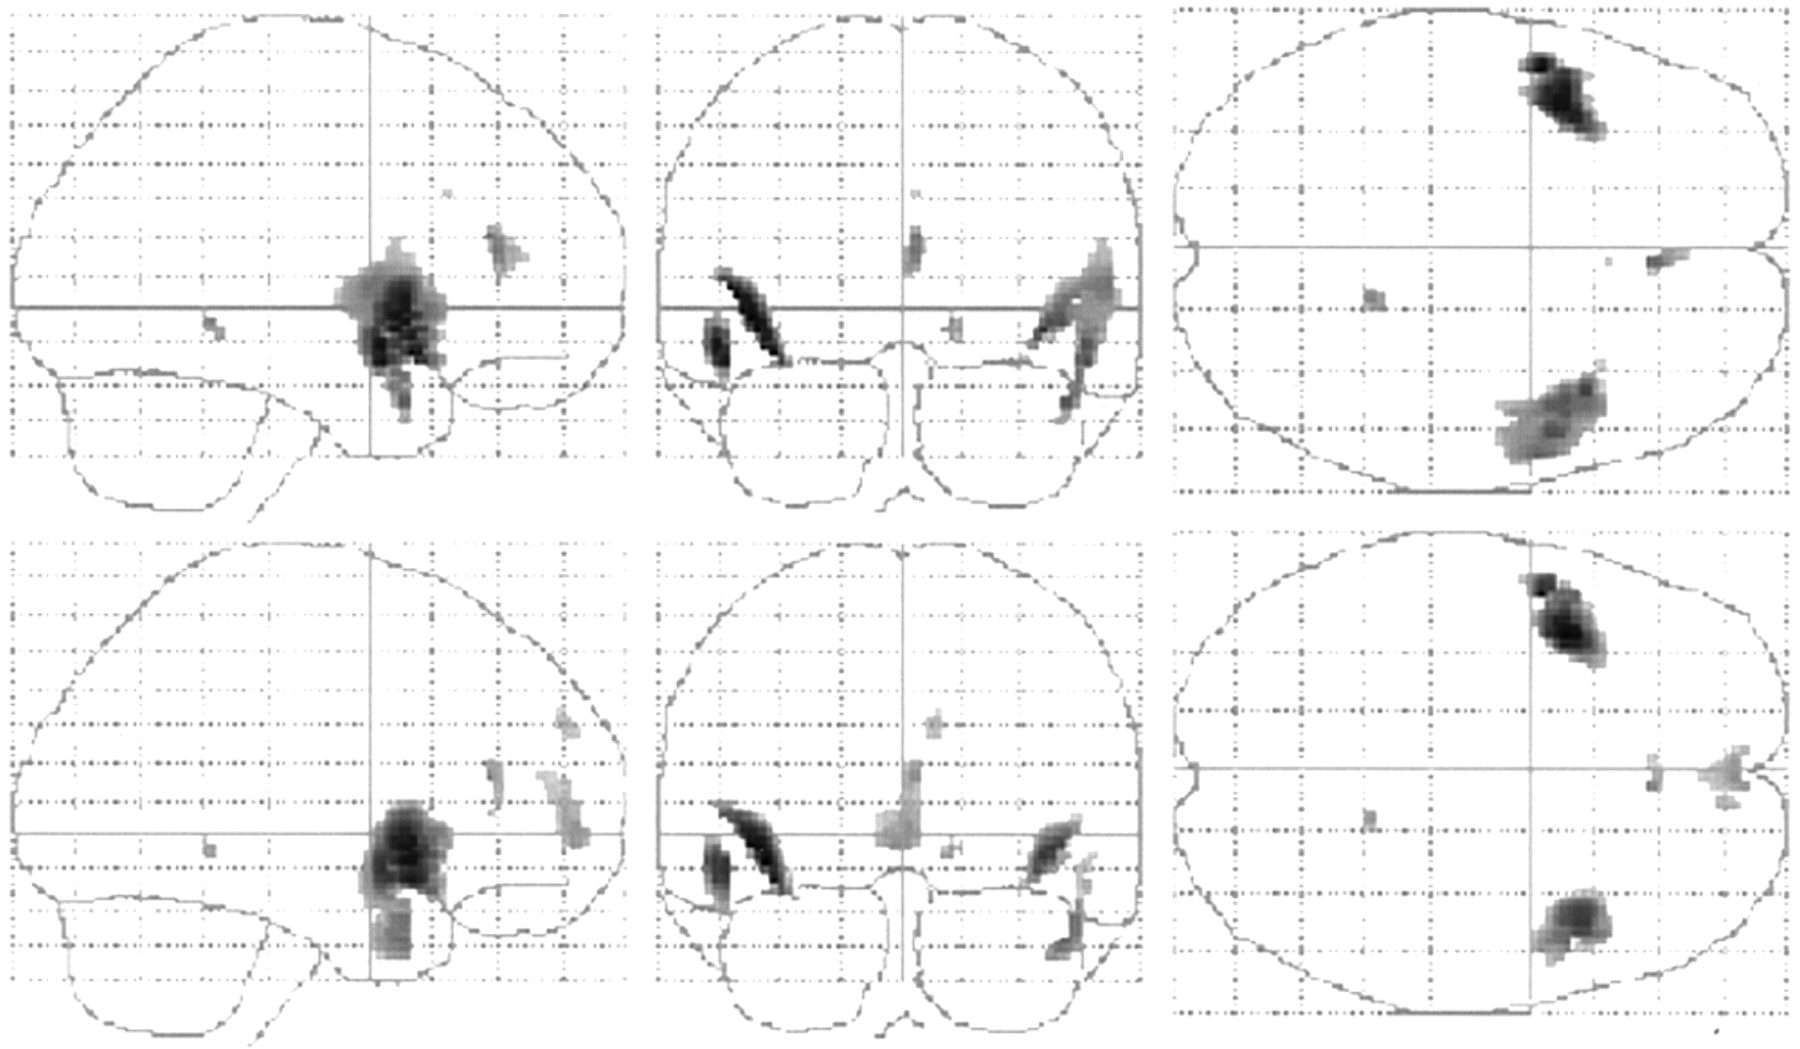
There were significant negative correlations between age and adjusted rCBF in the bilateral insulae, bilateral superior temporal gyri, right inferior frontal gyrus, right anterior cingulate gyrus, and right parahippocampal gyrus before the PVE correction (Table 2; Fig. 5). After the PVE correction, there were significant negative correlations between age and adjusted rCBF in the bilateral insulae, bilateral superior temporal gyri, bilateral inferior frontal gyri, right middle temporal gyrus, bilateral anterior cingulate gyri, right superior frontal gyrus, right parahippocampal gyrus, and right medial frontal gyrus.

Maximum intensity projections of SPM99 results for negative correlation of adjusted rCBF with advancing age before (top) and after (bottom) PVE correction. Height threshold <0.001, corrected for multiple comparisons.
Location and Peaks of Significant Adjusted rCBF Decreases or Increases with Advancing Age Before and After PVE Correction
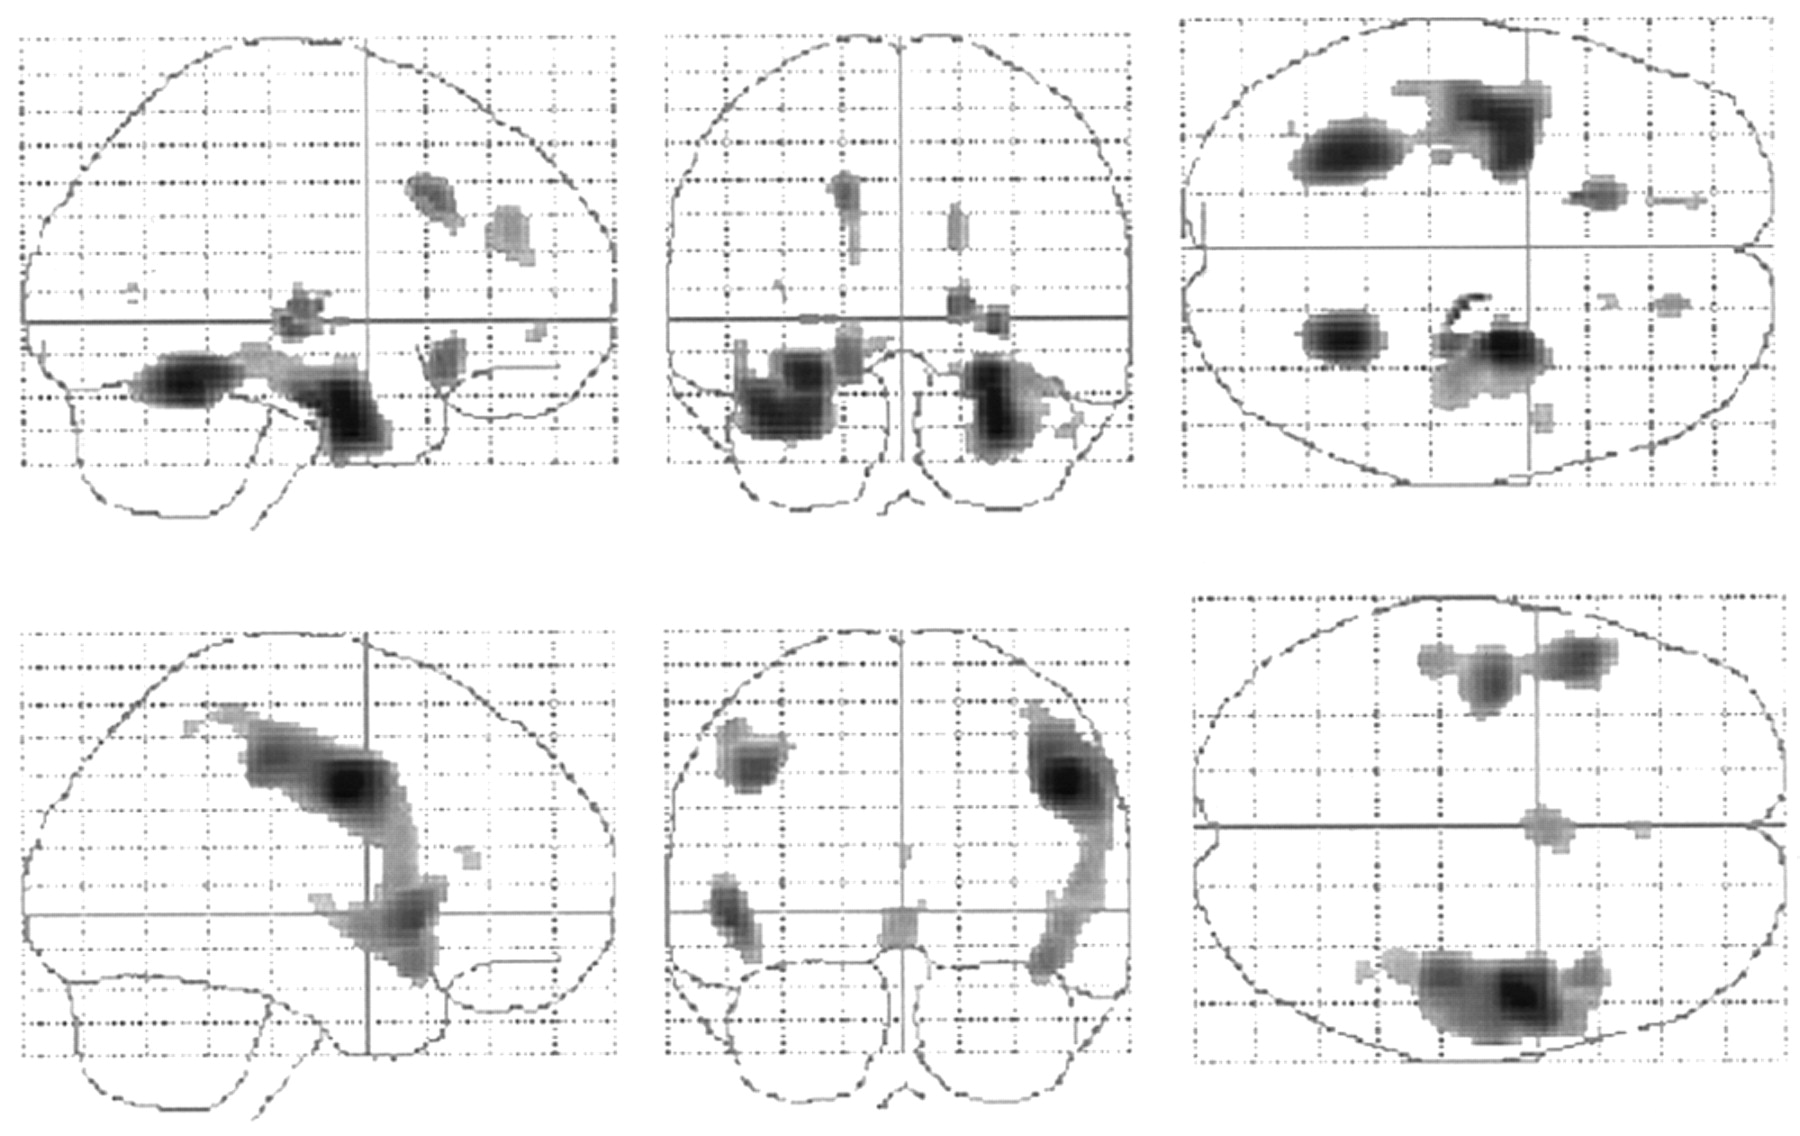
There were significant positive correlations between age and adjusted rCBF in the left fusiform gyrus, left inferior occipital gyrus, right amygdala, and right medial frontal gyrus before the PVE correction (Table 2; Fig. 6). In contrast, after the PVE correction, there were significant positive correlations between the bilateral postcentral gyri, bilateral paracentral lobules, bilateral precunei, and left middle occipital gyrus.

Maximum intensity projections of SPM99 results for positive correlation of adjusted rCBF with advancing age before (top) and after (bottom) PVE correction. Height threshold <0.001, corrected for multiple comparisons.
There were significant negative correlations between age and regional gray-matter volume in the bilateral precentral gyri, bilateral superior temporal gyri, bilateral postcentral gyri, bilateral anterior cingulate gyri, right inferior frontal gyrus, and right insula (Table 3; Fig. 7). On the other hand, there were positive correlations between age and regional gray-matter volume in the right parahippocampal gyrus, bilateral cerebellar hemispheres, left fusiform gyrus, left amygdala, bilateral putamina, left subcallosal gyrus, right thalamus, right medial frontal gyrus, right middle temporal gyrus, and right inferior frontal gyrus.

Maximum intensity projections of SPM99 results for positive (top) and negative (bottom) correlation of regional gray-matter volume with advancing age. Height threshold <0.001, corrected for multiple comparisons.
Location and Peaks of Significant Decreases or Increases of Gray-Matter Volume with Advancing Age
DISCUSSION
After the PVE correction, the rCBF distribution became more homogeneous throughout the brain with less intersubject variation than the original distribution. Significant negative correlations between age and adjusted rCBF before the PVE correction remained in the bilateral perisylvian and frontal areas after the PVE correction. Significant positive correlations between age and adjusted rCBF shifted from the limbic areas before the PVE correction to the sensorimotor and parietal areas after the PVE correction.
There have been 2 MRI-based approaches to the correction of PVEs in PET or SPECT images. The 2-compartment method (3,4) corrects PET or SPECT data for the diluting effects of cerebrospinal fluid spaces. The 3-compartment method (1,2,5) used in this study accounts for the effect of partial-volume averaging between gray and white matter. In a comparative study of these 2 methods, Meltzer et al. (20) reported greater accuracy for absolute quantitative measures of the 3-compartment algorithm than the 2-compartment algorithm, although the 3-compartment algorithm is more sensitive to errors—particularly, image segmentation and image registration. In this study, well-established software programs, SPM99 and AIR, were used for segmentation and registration, respectively. This phantom study validated this 3-compartment algorithm. The PVE correction provided much more homogeneous radioactivity throughout the phantom than that in the original SPECT image.
The PVE correction provided more homogeneity and reduced intersubject variability in rCBF distribution in this study. However, Meltzer et al. (3) did not report such alterations after the PVE correction in FDG PET studies. This may be partly due to the difference in correction methods for PVEs. Because the 2-compartment method used in their study does not correct for the diluting effect of white matter on gray-matter activity, possible heterogeneity of brain white matter in aged subjects may introduce errors. The 2-compartment algorithm cannot fully recover the radioactivity for gray matter. We believe that the 3-compartment algorithm with a high-recovery coefficient of gray-matter radioactivity is better suited for SPECT studies. Reduction of intersubject variability might be suitable for construction of a normal database in such a statistical analysis as a 3D stereotactic surface projection method (21), because smaller SDs of rCBF in a normal database yield larger Z scores for rCBF of a patient. However, the PVE correction has been reported to lessen the difference in regional cerebral metabolic rate for glucose (rCMRglu) between patients with Alzheimer’s disease and control subjects (4). Further studies must be performed to determine whether the PVE correction has an advantage in sensitive detection of an abnormality in rCBF or rCMRglu for a patient.
Numerous investigations have been performed on the relationship between advancing age and CBF or metabolism using PET or SPECT. Recent investigations have introduced voxel-by-voxel analysis in the stereotactic space using anatomic standardization techniques to avoid subjectivity and to adopt the principle of data-driven analysis. Martin et al. (22) first reported the use of the SPM software for this investigation in a PET study. They demonstrated an age-related decrease in adjusted rCBF in the cingulate, parahippocampal, superior temporal, medial frontal, and posterior parietal cortices bilaterally and in the left insular and left posterior prefrontal cortices. Petit-Taboue et al. (23) reported a significant decline in rCMRglu with age using the SPM software in the perisylvian temporoparietal and anterior temporal areas, insula, inferior and posterior-lateral frontal regions, anterior cingulate cortex, head of caudate nucleus, and anterior thalamus, in a bilateral and essentially symmetric fashion. Herholz et al. (24) also reported a significant decline in rCMRglu with age in the anterior cingulate and in frontolateral perisylvian cortex bilaterally. In these PET studies, the most common reductions with advancing age are observed in the dorsolateral and medial frontal areas, perisylvian and insular cortices (25). Similar results have been observed in recent SPECT studies by applying statistical analysis after spatial normalization to the standard brain to investigation of aging effects. Pagani et al. (26) demonstrated a significant decrease in 99mTc-hexamethylpropyleneamine oxime uptake with increasing age in the brain vertex, left frontotemporal cortex, and temporocingulate cortex. Van Laere et al. (27) reported an age-related decline in 99mTc-ECD uptake in the anterior cingulate gyrus, bilateral basal ganglia, left prefrontal, left lateral frontal, left superior temporal, and insular cortices.
In contrast to the many investigations on aging effects, there have been few reports on the relationship between age and rCBF or rCMRglu after the PVE correction in PET or SPECT. This may be due to methodologic difficulties and the necessity of acquisition of 3D MRI for this correction. Meltzer et al. (28) corrected PVEs in PET for healthy volunteers using the 2-compartment method. They reported that statistically significant and trend significant negative correlations between age and rCBF were observed in the lateral temporal and lateral orbitofrontal cortex and in the anterior cingulate gyrus and parietal cortices, respectively, before but not after the PVE correction. Only the medial orbitofrontal cortex continued to show a negative correlation between age and rCBF after the PVE correction. However, they did not use anatomic standardization techniques to investigate the relationship between age and rCBF. In our study using the SPM software, consistent negative correlations between age and adjusted rCBF were observed in the bilateral perisylvian and frontal areas before and after the PVE correction. All of the affected structures are association, or paralimbic, cortices, believed to subserve higher-order functions such as cognition, which includes memory, attention, and the control of behavior (29,30). The decreases reported here are independent of differences in global CBF between subjects and, therefore, represent a true age-related redistribution of rCBF. This finding suggests a potential true decline in regional CBF with advancing age in these regions.
In contrast to negative correlations, results of positive correlations between age and rCBF showed marked differences before and after the PVE correction. Instead of the positive correlation in the limbic areas before the correction, the sensorimotor and parietal areas showed positive correlations after the correction. This change could be explained by the relationship between age and gray-matter volume. The perisylvian and sensorimotor areas showed significant atrophy with advancing age. On the other hand, the limbic areas showed significant preservation of regional gray-matter volume in elderly subjects in our study. Less influence of PVEs in the limbic areas in the elderly subjects would lead to a relative increase of adjusted rCBF with advancing age. Good et al. (31) studied aging effects in 465 healthy adult human brains using the same voxel-based morphometry as in our study. They observed accelerated loss of gray-matter volume symmetrically in the parietal lobes, pre- and postcentral gyri, insulae, and anterior cingulate cortex. They also observed relative preservation of gray-matter volume symmetrically in the amygdala, hippocampi, entorhinal cortices, and thalami. The lack of substantial age-related changes in the amygdala and hippocampal regions was also demonstrated by Raz et al. (32). Their results are in good accordance with the results from our voxel-based morphometry. From these observations, the greatest influence of PVEs was present in the sensorimotor areas in healthy men. This area has been reported by Van Laere to show a relatively lower functional decrease with aging as compared with the structural atrophy (33).
Finally, we must emphasize that our study analyzed rCBF of only healthy men. Several reports have indicated sex differences in gray-matter volume and rCBF or rCMRglu (26,27,32,33). An additional study on healthy women would be desirable to clarify accurate sex differences in brain function using SPECT with the PVE correction.
CONCLUSION
SPECT data reflect both brain volume loss and functional changes. Correction for PVEs provides a more accurate determination of the regional pattern of rCBF in elderly control subjects by diminishing the artifactual effect of regional differences in tissue loss on the rCBF data. We applied an MRI-based method of correction for PVEs to SPECT data in healthy elderly men. Our data confirm that true rCBF without PVEs shows more homogeneous distribution in the brain with less intersubject variability. Moreover, we confirmed that diminished rCBF with advancing age is not accounted for solely by cerebral atrophic changes.
Acknowledgments
We are very thankful to the technical staff in our hospital for data acquisition and to John Gelblum for proofreading this manuscript.
Footnotes
Received Dec. 13, 2002; revision accepted Mar. 28, 2003.
For correspondence or reprints contact: Hiroshi Matsuda, MD, Department of Radiology, National Center Hospital for Mental, Nervous, and Muscular Disorders, National Center of Neurology and Psychiatry, 4-1-1, Ogawahigashi, Kodaira, 187-8551, Tokyo, Japan.
E-mail: matsudah{at}ncnpmusashi.gr.jp
REFERENCES
In this issue


Jump to section
Related Articles
Cited By...
- Influence of Attenuation Correction by Brain Perfusion SPECT/CT Using a Simulated Abnormal Bone Structure: Comparison Between Chang and CT Methods
- Brain structural plasticity in survivors of a major earthquake
- MR Imaging-Based Correction for Partial Volume Effect Improves Detectability of Intractable Epileptogenic Foci on Iodine 123 Iomazenil Brain SPECT Images: An Extended Study with a Larger Sample Size
- Distribution of Cortical Benzodiazepine Receptor Binding in Right-Handed Healthy Humans: A Voxel-Based Statistical Analysis of Iodine 123 Iomazenil SPECT with Partial Volume Correction
- MRI-Based Correction for Partial-Volume Effect Improves Detectability of Intractable Epileptogenic Foci on 123I-Iomazenil Brain SPECT Images
- Role of Neuroimaging in Alzheimer's Disease, with Emphasis on Brain Perfusion SPECT
- Effects of antidepressant treatment with rTMS and fluoxetine on brain perfusion in PD