


Abstract
123I-Labeled radiotracers are suitable for in vivo imaging of the dopaminergic system by SPECT. However, precise measurement of striatal uptake is limited by scatter, attenuation, and the finite spatial resolution of the camera. We studied the quantitative accuracy that can be achieved with 123I SPECT of the dopaminergic neurotransmission system. Methods: Using a Monte Carlo simulation and brain phantom experiments, we studied the biases in brain and striatal absolute uptake estimates and in binding potential (BP) values for different processing schemes with corrections for attenuation, scatter, and the partial-volume effect. Results: Without any correction, brain activity was underestimated by at least 65%, and absolute striatal activity measured in regions corresponding to the anatomic contours of the striata was underestimated by about 90%. With scatter and attenuation corrections only, estimated brain activity was accurate within 10%; however, striatal activity remained underestimated by about 50%, and BP values were underestimated by more than 50%. When combined with attenuation and scatter corrections, anatomically guided partial-volume effect correction (PVC) reduced the biases in striatal activity estimates and in BP values to about 10%. PVC reliability was affected by errors in registering SPECT with anatomic images, in segmenting anatomic images, and in estimating the spatial resolution. With registration errors of 1 voxel (2.1 × 2.1 × 3.6 mm3) in all directions and of 15° around the axial direction, PVC still improved the accuracy of striatal activity and BP estimates compared with scatter and attenuation corrections alone, the errors being within 25%. A 50% overestimation of the striatal volume yielded an approximate 30% change in striatal activity estimates with respect to no overestimation but still provided striatal activity estimates that were more accurate than those obtained without PVC (average errors ± 1 SD were −22.5% ± 1.0% with PVC and −49.0% ± 5.5% without PVC). A 2-mm error in the spatial resolution estimate changed the striatal activity and BP estimates by no more than 10%. Conclusion: Accurate estimates of striatal uptake and BP in 123I brain SPECT are feasible with PVC, even with small errors in registering SPECT with anatomic data or in segmenting the striata.
Brain neurotransmission SPECT is currently devoted mostly to imaging of the dopaminergic system. The majority of the radiopharmaceuticals used for studying presynaptic transporter binding or postsynaptic dopamine D2 receptor status are labeled with 123I. Common indications are early diagnosis of Parkinson’s disease (1–3) and evaluation of parkinsonian syndromes (4–6).
Visual assessment of the images can be considered sufficient in many diagnostic situations. However, semiquantitation is highly recommended, for example, in the measurement of the specific binding potential (BP) of striatal subregions (7,8). A quantitative approach becomes even more important in additional promising indications, such as the measurement of disease progression (9), the assessment of Lewy body dementia (10), and the monitoring of neuroprotective treatments (11).
The value of attenuation and scatter corrections for improving the accuracy of quantitative measurements has been pointed out by Hashimoto et al. (12) and Almeida et al. (13). Even with these corrections, accurate estimates of striatal activity are especially challenging, given the small size of the striata. Indeed, a partial-volume effect (PVE) attributable to the limited spatial resolution of SPECT devices induces a large underestimation of activity in small structures (14). In 123I brain SPECT, radioactivity concentration in the striata can be underestimated by more than 50% if no correction for PVE is used (15). The purpose of this study was to assess the quantitative accuracy that can be achieved with 123I SPECT of the dopaminergic neurotransmission system as a function of the phenomena for which corrections are used and of the methods used to estimate uptake in the different structures of interest.
MATERIALS AND METHODS
Phantom
A 123I SPECT Monte Carlo simulation and acquisitions of a radiology support device (RSD) striatal brain phantom (Radiological Support Devices Inc.) were performed. This phantom consists of 5 realistic compartments corresponding to the brain, left and right caudate nuclei, left putamen, and right putamen and separated by polyurethane walls. The brain compartment has a volume of 1,303 mL, and the volumes of the caudate nucleus and putamen compartments are 5 and 6 mL, respectively.
SPECT Acquisitions
SPECT scans were performed with a 3-headed camera (PRISM 3000 XP; Philips). This camera was equipped with a hollow line transmission source, located at the 50-cm focal line of the oppositely mounted low-energy, high-resolution fanbeam collimator. For all tomographic acquisitions, the radius of rotation was 15.9 cm, and 120 projections (step-and-shoot mode, matrix size = 128 × 128) were acquired over 360° (reconstructed pixel size = 2.1 mm, slice thickness = 3.6 mm, angular sampling of 3°). The system spatial resolution characterized by the full width at half maximum (FWHM) in the object plane at a distance corresponding to the radius of rotation was 11 mm. Three datasets were obtained.
First, the phantom was entirely filled with water without any activity. The transmission line source was filled with 99mTc at 111 MBq/mL. A 300-s blank scan and a transmission scan (T scan) (15 s per projection) were performed in the 20% energy window centered on 140 keV (126–154 keV). The blank scan included about 31 million counts in the whole field of view.
Second, the phantom was removed from the table and filled with 123I activity: 710 kBq/mL in the left putamen, 1,310 kBq/mL in the right putamen, 1,070 kBq/mL in the left caudate nucleus, 1,400 kBq/mL in the right caudate nucleus, and 118 kBq/mL in the brain compartment. These values were derived from a preliminary study of patients undergoing 123I-N-ω-fluoro-propyl-2β-carbomethoxy-3β-(4-iodophenyl)tropane explorations (DaTSCAN; Nycomed Amersham). The phantom was placed on the table again at the same position as for the T scan by use of a laser positioning device. An emission scan (E scan) (15 s per projection) was acquired in 4 energy windows (92–139, 139–142, 142–175, and 175–179 keV). This acquisition yielded about 13 million counts in the set of projections corresponding to the 20% energy window centered on 159 keV (142–175 keV).
Finally, without moving the phantom, a simultaneous emission–transmission scan (E/T scan) was acquired in the 4 energy windows used for the E scan and with 15 s per projection. This acquisition yielded about 14 million counts between 142 and 175 keV.
Monte Carlo Simulation
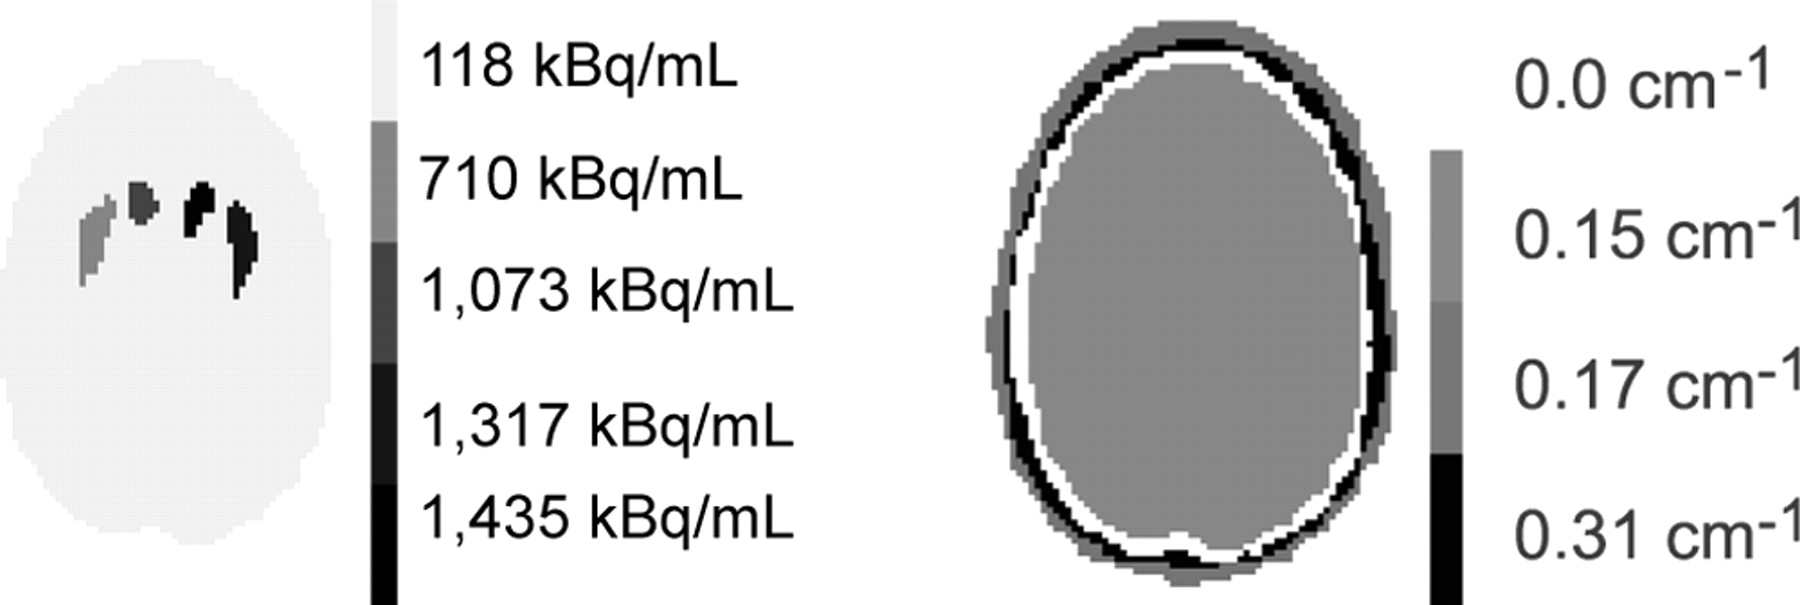
A Monte Carlo simulation of a numerical model of the RSD brain phantom was performed by use of the SimSET code (University of Washington) (16). The numerical phantom was obtained from the CT scan (Tomoscan LX; Philips) of the RSD phantom acquired with the brain cavity filled with water and the striata filled with iodine contrast medium. Twenty-one slices of 512 × 512 pixels were acquired (pixel size = 0.48 mm, slice thickness = 7 mm). These slices were interpolated in the axial direction to obtain 41 slices of 512 × 512 pixels with a slice thickness of 3.6 mm. The resulting CT images were manually segmented into 5 compartments: right putamen, left putamen, right and left caudate nuclei, and the rest of the brain, referred to as the background in the following text. 123I activity concentrations similar to those used for the acquisitions were set in each compartment (Table 1; Fig. 1). The attenuation map required for the simulation was derived from the segmented CT images by assigning fixed attenuation coefficients at 159 keV to the air (0 cm−1), brain tissue (0.15 cm−1), bone (0.31 cm−1), and connective tissue (0.17 cm−1), as identified on the segmented CT images (Fig. 1).

Example of activity and attenuation (159 keV) maps used for simulation.
Activity and BP Values Used for Simulation and Phantom Experiments
Only the 159-keV photons of 123I were simulated. The Monte Carlo simulation included the effects of attenuation and Compton and Rayleigh scatter in the phantom. The distance-dependent collimator response was considered analytically in the simulator, given the characteristics of the collimator (septal thickness, hole length, and hole dimensions). A total of 120 emission projections of 128 × 128 pixels were obtained over 360° with a pixel size of 2.1 mm for each of 16 energy windows (4.75 keV wide) from 102 to 178 keV. A total of 500 million photons were generated, and 8.8 million events were detected in the projections corresponding to the 20% energy window centered on 159 keV. The simulated data were sorted so that projections including only primary events (PRIM) or both primary and scatter events were obtained. In the 20% energy window, 77% of the events were primary photons and 23% were scatter. The imaging system FWHM in the object plane at a distance corresponding to the 15.9-cm radius of rotation was 7 mm.
Data Processing and Reconstruction
Processing schemes differing with regard to the involved corrections were assessed by studying the accuracy of 123I striatal uptake estimated from the resulting images.
Preprocessing of Acquired Data and Scatter Correction.
The simultaneously acquired E/T projections were first corrected for cross talk by use of the method described by Tung et al. (17). The T, E, and E/T projections were all corrected for radioactive decay.
Three sets of projections were considered: projections acquired in the 20% energy window centered on 159 keV, denoted as 20% projections; projections resulting from the triple-energy window (TEW) scatter correction method (18) with the 142- to 174-keV window as the principal energy window and the windows at 139–142 and 174–179 keV as secondary energy windows; and, for simulated data only, projections including only PRIM, which mimicked projections ideally corrected for scatter.
Attenuation Correction and Reconstruction.
Attenuation correction was performed by modeling attenuation in the ordered-subset expectation maximization (OSEM) (19,20) reconstruction algorithm. This procedure is referred to as OSEM-A in the following text. For the simulated data, the segmented attenuation map used for the simulation was considered, without the inclusion of any blurring or noise in the map. For the acquired data, the transmission data were converted to projections of linear attenuation coefficients. These were reconstructed by use of OSEM with 12 iterations and 12 subsets and convolved by use of a 3-dimensional (3D) gaussian filter of 4-mm FWHM. The resulting transmission maps were scaled from 140 to 159 keV to obtain the attenuation coefficients appropriate for the correction of the 123I emission data by use of the following linear relationship:
 Eq. 1 where μTc is the attenuation coefficient measured at 140 keV, μTc-H2O is the water attenuation coefficient at 140 keV, μI-H2O is the water attenuation coefficient at 159 keV, and μI is the measured attenuation coefficient appropriately scaled at 159 keV.
The simulated and acquired emission projections were reconstructed by use of OSEM (19,20) with 12 iterations and 12 subsets to ensure convergence. Reconstructed images were convolved by use of a 3D gaussian filter of 8.5-mm FWHM.
PVE Correction (PVC).
PVC was performed by use of a method derived from the region-of-interest (ROI) technique proposed by Rousset et al. for PET (21). In this method, the mean value measured in an anatomic ROI j (ROIj) is expressed as the weighted sum of the activity concentrations Ai present in the compartments i:
 Eq. 2 where wij represents the contribution of compartment i to ROIj. With this model, the activity concentrations Ai in the different compartments can be estimated by inverting equation 2 given the measured activity values ROIj and the weights wij. To apply this method, the segmented CT images of the brain phantom used for the simulation were considered. Binary volumes of images corresponding to each of the 5 compartments were created by assuming a constant activity concentration Ai in each of these compartments. These 5 binary volumes were also considered as five 3D ROIs corresponding to ROIj for j = 1 to 5. Two approaches, denoted PVC1 and PVC2, were used to calculate the 25 weights wij involved in the model.
In PVC1, each volume of images corresponding to a binary compartment was convolved with 3D gaussian isotropic kernels of 11-mm FWHM for the Monte Carlo simulation and 14-mm FWHM for the acquisitions. For each compartment i, the value in ROIj of the images resulting from the convolution gave the weight wij. The FWHM values used for the convolution step were derived from the simulation and acquisitions of a 123I line source centered in the field of view, with the same acquisition and reconstruction parameters as those used for the brain phantom simulation and acquisitions. A profile through the reconstructed line source was fitted to a gaussian function to derive the FWHM values. Because striata are close to the center of rotation of SPECT acquisitions and because striatal uptake is very focal in dopaminergic system imaging, the spatial resolution in the reconstructed striatal region was assumed to be well estimated by using centered line source acquisitions and by keeping all acquisition and reconstruction parameters the same as those used for the brain phantom simulation and acquisitions.
In PVC2, each volume of images corresponding to a binary compartment was projected by use of a fanbeam projector modeling attenuation with the attenuation map corresponding to the processed dataset (simulated, T map from the T scan, or T map from the E/T scan). The resulting projections were convolved by 2-dimensional gaussian functions (mimicking detector response functions) of 7-mm FWHM for the Monte Carlo simulation and of 11-mm FWHM for the acquisitions. These FWHM values were chosen on the basis of the assumption that the striata were approximately at the center of rotation of SPECT acquisitions and hence at a collimator distance equal to the radius of rotation. These projections were reconstructed by use of OSEM with 12 subsets and 12 iterations, including attenuation correction with the same attenuation map as that used for calculating the projections. Reconstructed images were convolved with a 3D gaussian filter of 8.5-mm FWHM. For each compartment i, the value in ROIj of the resulting reconstructed images gave the weight wij.
Only the 4 striatal compartments were corrected for PVE. The uptake measurements in the rest of the brain (see below) were assumed not to be affected by PVE.
Robustness of PVC.
To apply PVC, the striata have to be segmented by use of the high-resolution anatomic CT images registered with the SPECT images. We studied the effect of registration and segmentation errors between the SPECT volumes and the CT volumes on the reliability of PVC2 with the simulated data. The effect of misregistration was studied by shifting the simulated SPECT volume with respect to the segmented CT map by up to 1.1 cm along the left–right or the back–front direction in the axial slices and along the axial direction and by rotating the SPECT volume by up to 15° around the axial direction. To investigate the sensitivity of PVC to segmentation errors, the anatomic masks used for the calculation of the weights wij involved in the correction were eroded or dilated so that their volumes were 2.2 times smaller and 1.5 times larger than the true volumes. The robustness of the correction with respect to a poor estimate of the spatial resolution in the reconstructed images was studied by calculating the weights wij needed for PVC on the basis of the assumption that the FWHM was up to 2 mm larger or smaller than the detector response for the Monte Carlo simulation (FWHM = 7 mm).
Processing Schemes.
In total, 5 processing schemes were considered: no correction—20% projections reconstructed without any correction; AC—20% projections reconstructed with attenuation correction only; SAC-TEW or SAC-PRIM—projections corrected for scatter with TEW or projections of primary photons (PRIM) reconstructed with attenuation correction; AC-PVC—20% projections reconstructed with attenuation correction and PVC1 or PVC2 for PVE compensation; and SAC-TEW-PVC or SAC-PRIM-PVC—scatter-corrected projections reconstructed with attenuation correction and corrected for PVE with PVC1 or PVC2.
Quantitative Measurements
Calibration for Absolute Quantitation.
For assessment of the accuracy of absolute uptake estimates, a calibration factor that relates a number of detected counts to an activity must be obtained. This is usually done by separate acquisition of a calibration phantom, either a point or a line source in scatter-free conditions, or a phantom with a size and geometry close to those of the objects to be subsequently processed with the calibration factor. In this work, we used an original calibration procedure that is applicable irrespective of the dissimilarity between the calibration phantom and the objects under investigation. We performed an acquisition of a 91-mL sphere containing 123I at 1,715 kBq/mL using the same protocol as that used for the brain phantom E scan. For dealing with scatter that might be different for the calibration phantom and for the data to be subsequently processed with the calibration factor, the sphere projections were corrected for scatter with TEW and scaled to the total number of photons acquired in the energy range of 92–175 keV. On the basis of the assumption that the scatter correction was accurate, this scaling yielded projections identical (except for their noise properties) to those that would be obtained if all photons detected in the energy range of 92–175 keV were unscattered. These rescaled projections were reconstructed by use of OSEM with 12 subsets and 12 iterations, including attenuation correction with a theoretic transmission map that was easy to derive for this simple phantom. A calibration factor was then calculated as the ratio between the known amount of activity in the sphere and the number of counts in a large ROI including the whole sphere. This calibration factor was used to estimate activity concentrations from the brain phantom acquisitions as follows. Before reconstruction, the projections—either corrected for scatter or not, depending on the processing scheme—were scaled to the total number of counts acquired between 92 and 175 keV. This procedure corresponds to the assumption that all events detected in the projections were unscattered. These scaled projections were then reconstructed with or without attenuation correction and with or without PVC. The ROI measurements obtained from the reconstructed images were multiplied by the calibration factor to obtain the activity values corresponding to the measured number of counts.
The same calibration procedure was applied to the simulated data. The calibration factor was calculated as the ratio between the known amount of activity in the 5 compartments and the total number of counts detected between 102 and 178 keV. Before reconstruction, the 20%, TEW, or PRIM projections were scaled to the total number of counts acquired between 102 and 178 keV. These scaled projections were reconstructed by use of OSEM with 12 subsets and 12 iterations (including or not including attenuation correction), postfiltered, and corrected or not corrected for PVE. The regional count measurements obtained from the reconstructed images were multiplied by the calibration factor to deduce activity values.
Assessment of Quantitative Accuracy.
For the simulated data, activity measurements in the striata were obtained for the 3D ROIs corresponding to the exact compartments of the activity distribution map. Background brain activity was measured in a large 3D cylindric region far from the striata. For the real data, the same ROIs as those used for the simulated data were used after spatial registration of the segmented CT map with the reconstructed SPECT images by use of an algorithm that maximizes mutual information (22). For each processing scheme, the following parameters were measured from the reconstructed images: putamen activity; caudate nucleus activity; background activity; and BP values, defined as (striatal activity − background activity)/background activity, where striatal activity was measured in the putamen ROIs and in the caudate nucleus ROIs and background activity was measured in the background ROI.
The true values for these quantitative indices are summarized in Table 1.
RESULTS
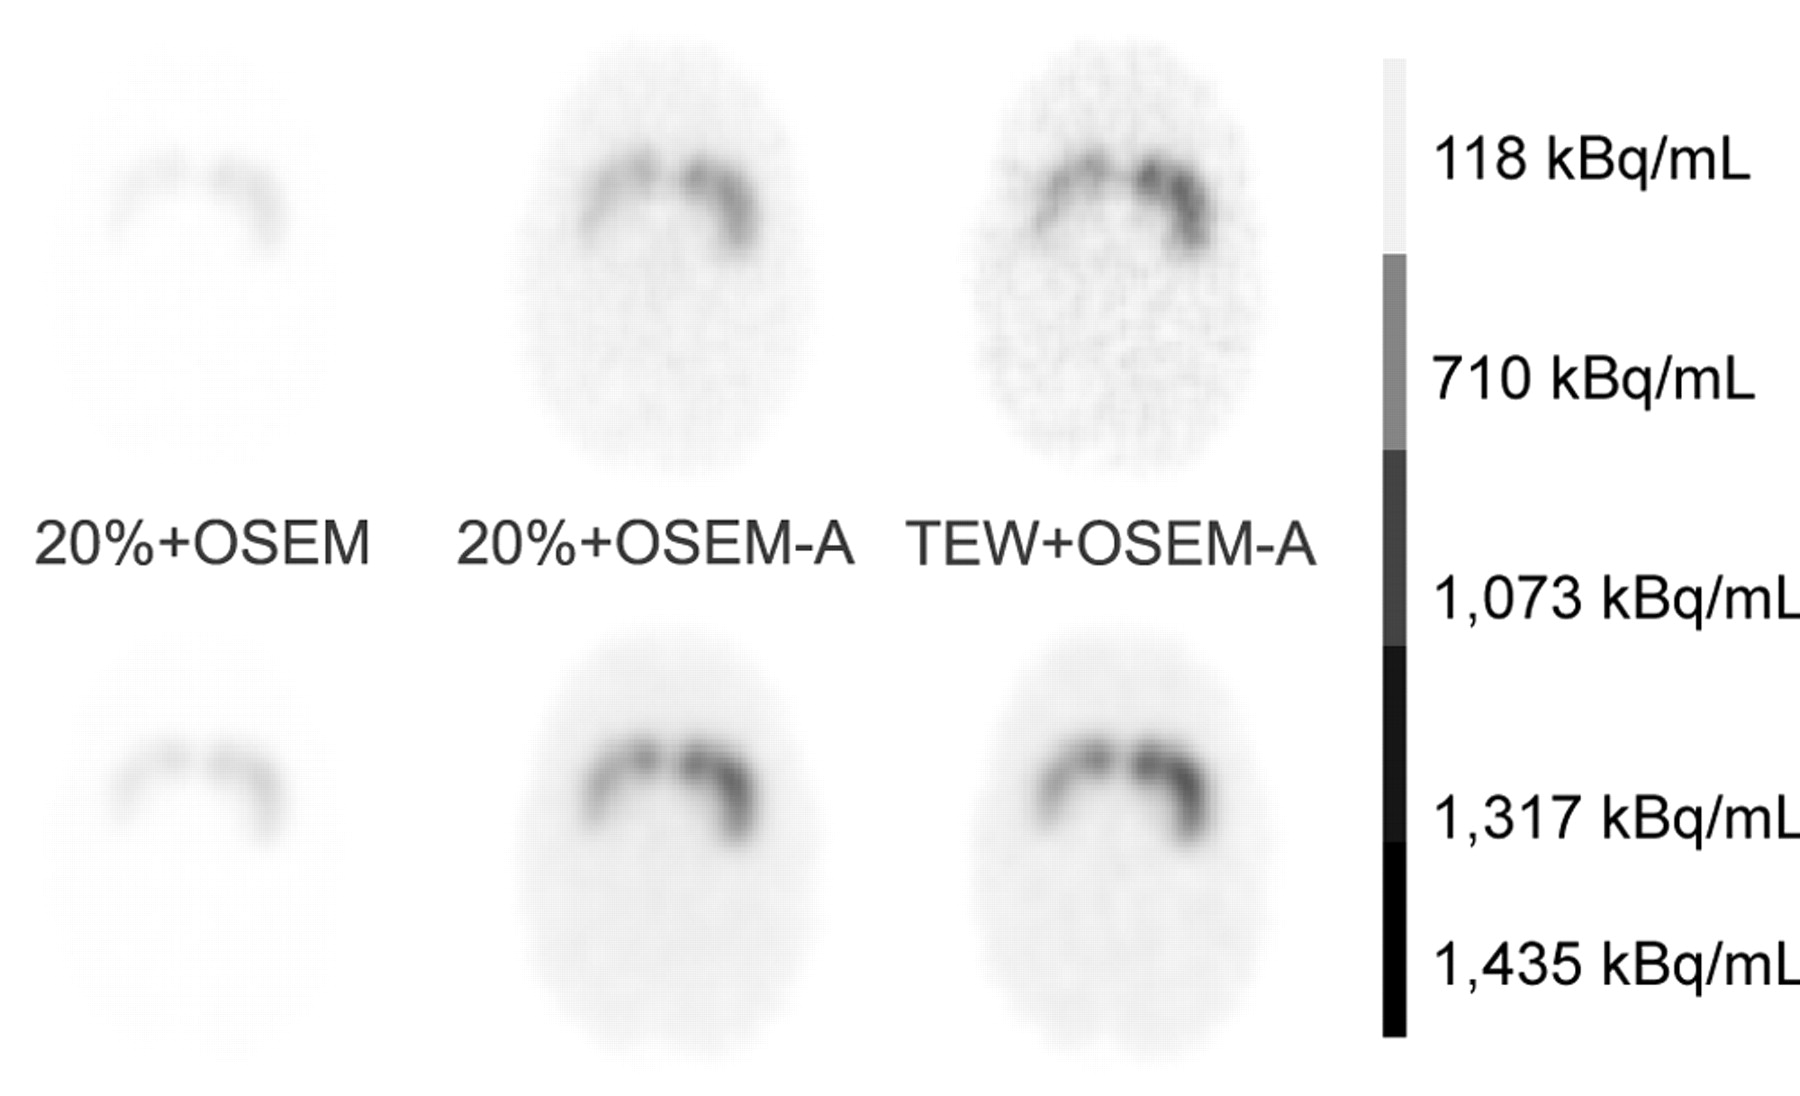
Figure 2 shows examples of reconstructed slices obtained from the simulated and acquired data. Tables 2 and 3 summarize the average percent errors in putamen activity, caudate nucleus activity, background activity, putamen BP, and caudate nucleus BP as a function of the processing schemes for the simulated and acquired data. The putamen (respectively caudate nucleus) values were obtained by averaging the percent errors observed for the left putamen and the right putamen (respectively caudate nuclei).

Example of slices reconstructed from acquisitions (top row) and from simulation (bottom row) with 3 processing schemes: no correction (20%+OSEM), AC (20%+OSEM-A), and SAC (TEW+OSEM-A).
Errors in Activity Estimates and in BP Values for Brain Simulation
Errors in Activity Estimates and in BP Values for Real Acquisitions
Absolute Activity Estimates
For the real acquisitions, we first present the results obtained when the emission and transmission data were acquired sequentially. We then considered the differences in results when emission and transmission data were acquired simultaneously.
Without any correction, the striatal activity was underestimated by 85.5% on average for the simulated data (Table 2) and by 90% on average for the real data (Table 3). The activity underestimation was less severe in the background (67% for the simulated data and real data) than in the striata.
Performing attenuation correction only was almost sufficient to achieve a reliable estimate of the background activity, as the bias in the activity estimate was within 12% for simulated and real data (AC data in Tables 2 and 3). However, striatal activity remained severely underestimated (54% for the simulated data and 67% for the real data).
Combining scatter and attenuation corrections (SAC data in Tables 2 and 3) did not much change the bias in the background compartment, which stayed within 10%. On the other hand, combining scatter and attenuation corrections decreased the average bias in striatal activity from 54% to 49% for simulated data and from 67% to 55% for real data.
The simulated data also suggested that TEW scatter correction was quantitatively reliable enough; when combined with attenuation correction, it yielded results very close to those obtained from the primary events only (SAC data in Table 2).
The association of scatter and attenuation corrections was not sufficient for the accurate quantitation of striatal activity (SAC data in Tables 2 and 3). The remaining high bias (about 50%) was attributable to PVE, as suggested by 4 observations: The large background compartment was not affected by such bias; the bias was higher in the caudate nuclei (5 mL in volume) than in the putamen (6 mL in volume; more compact than the caudate nuclei); for the same striatal structure, the greater the contrast with the background, the greater the underestimation (results not shown; for instance, for SAC-TEW, the bias values were −41% for the left putamen with a true BP of 5 and −50% for the right putamen with a true BP of 10.1); and the bias was considerably reduced by PVC.
When PVC was combined with attenuation correction only (AC-PVC data in Tables 2 and 3), the striatal activity underestimations averaged 3% and 24% for the simulated and acquired data, respectively. This difference in bias almost disappeared when scatter correction was combined with PVC and attenuation correction (SAC-PVC data in Tables 2 and 3); the striatal activity was then underestimated by about 7% for both simulated and real data. PVC was efficient at making quantitative bias almost independent from the size of the compartment, as activity was estimated accurately within 10% in all compartments.
Our results did not show a significant difference in accuracy between PVC1 and PVC2.
Measurements obtained from the data corresponding to the E/T scan were relatively close to those obtained for sequential E scan and T scan (Table 3), although the activity values measured in all compartments appeared slightly higher for simultaneous E/T scan than for sequential E scan and T scan.
BPs
Brain SPECT 123I studies are most often interpreted semiquantitatively in terms of BPs. Without any correction, BPs were underestimated by 63% on average for the simulation and by 73% on average for the acquisitions (“None” data in Tables 2 and 3). Attenuation correction alone did not substantially improve the accuracy in BP estimates; the bias values were still 63% and 71% on average for the simulated and acquired data, respectively (AC data in Tables 2 and 3). Adding scatter correction to attenuation correction decreased the bias in BPs, but BPs remained underestimated by more than 50% (SAC data in Tables 2 and 3). Similar to what was observed for absolute quantitation, the bias values were slightly higher for the caudate nuclei (−60%; SAC-TEW for simulation) than for the putamen (−54%; SAC-TEW for simulation) because of differences in shape and size between these 2 structures.
The key correction for achieving reliable BP estimates was PVC. PVC alone (results not shown) yielded average bias values for BPs of −11% and −24% for the simulation and acquisitions, respectively. When associated with attenuation correction only (AC-PVC data in Tables 2 and 3), PVC yielded BPs accurate within 10% for the simulated data, but higher biases remained for the real data (a BP underestimation of 16% on average). PVC associated with scatter correction yielded average bias values for BPs of only 3% for the simulation and 3% for the acquisitions (results not shown). Combining attenuation correction, scatter correction, and PVC yielded average bias values for BPs of 5% for the simulation and 13% for the acquisitions (SAC data in Tables 2 and 3).
Robustness of PVC
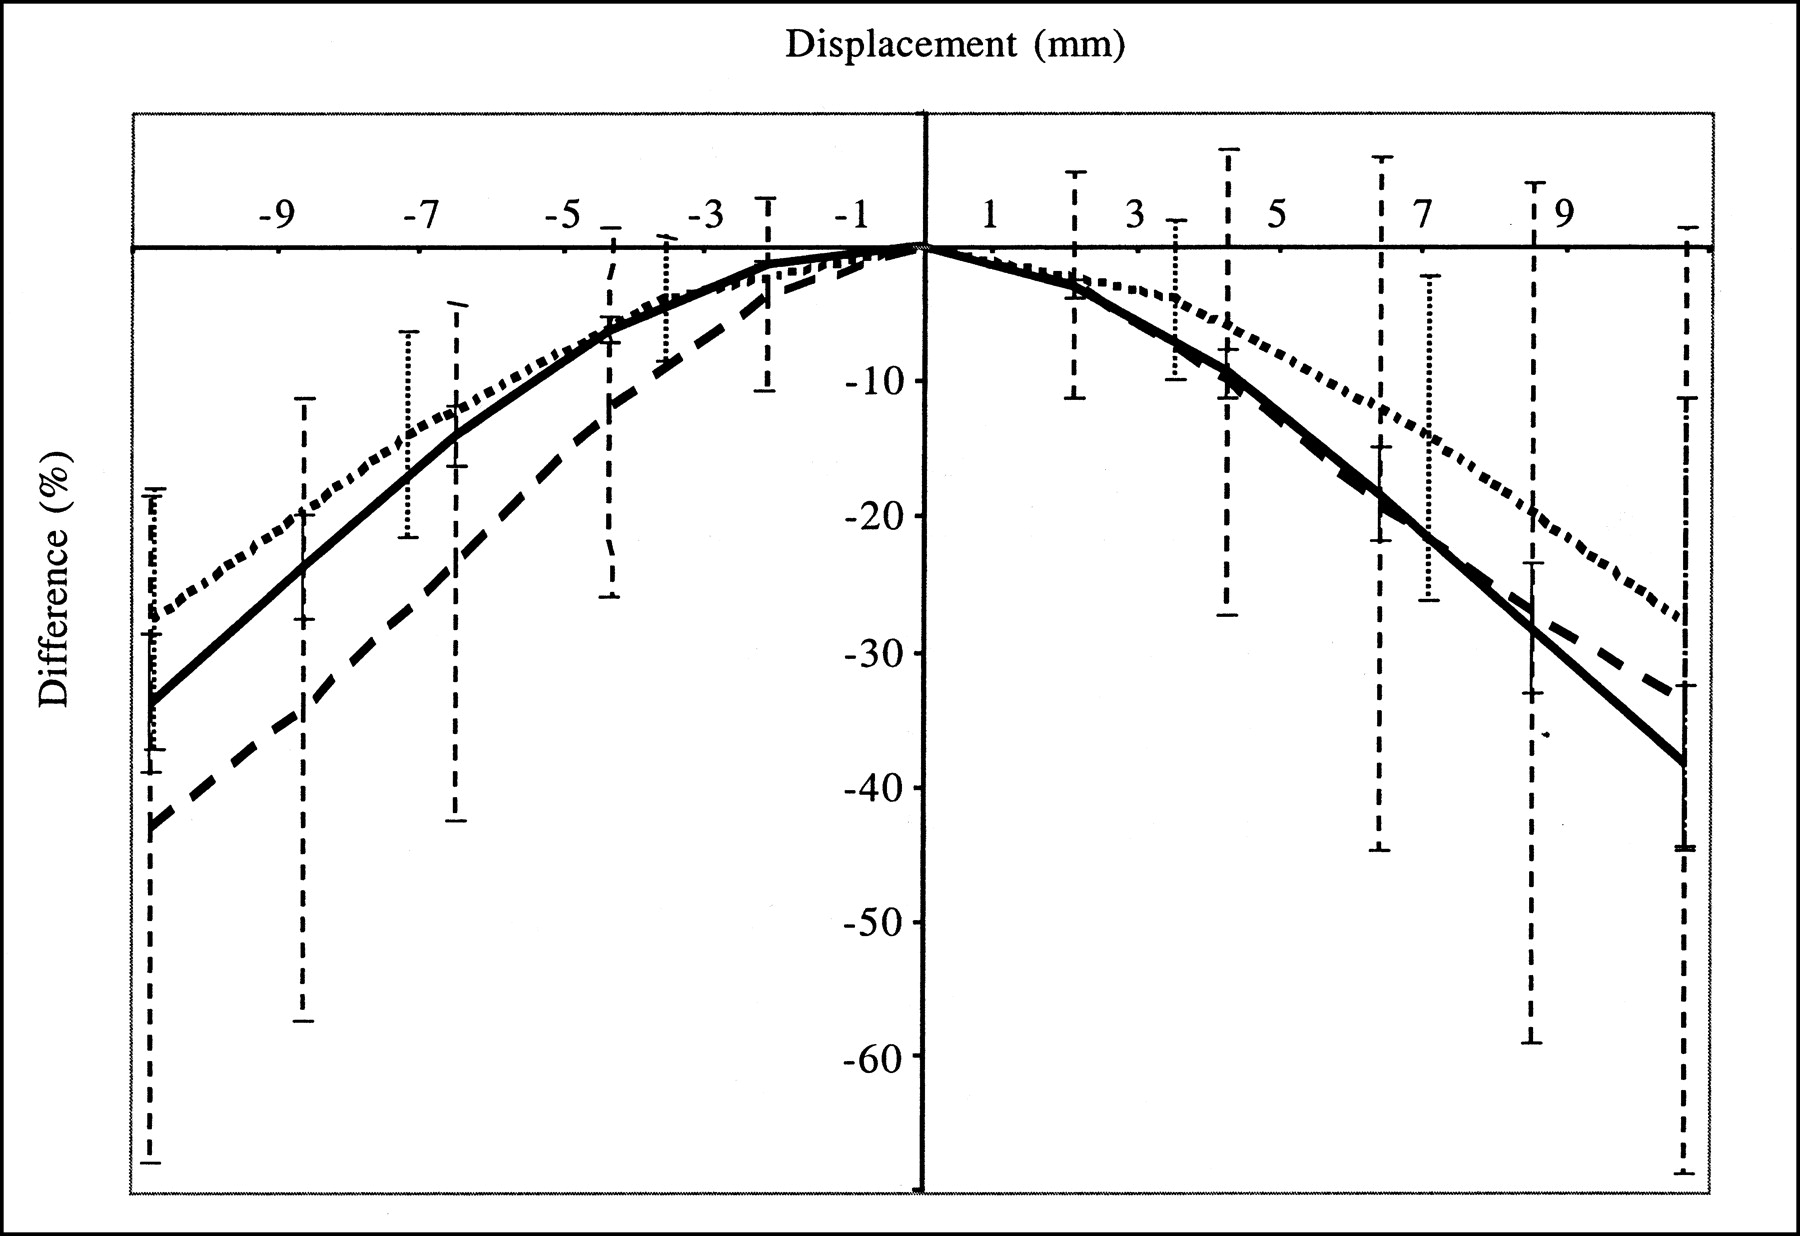
Figures 3 and 4 show how misregistration between the SPECT and anatomic volumes affected quantitation in the striata. The accuracy of striatal quantitation was affected mostly by misregistration along the x-direction; the maximum striatal activity underestimation with respect to the activity value measured without misregistration was 70% for a 1.1-cm shift in the x-direction. Moreover, misregistrations in the x-direction yielded bias values that were significantly different for the left and right striata; for a shift in the x-direction of 4.3 mm, the right putamen activity was underestimated by 26% and the left putamen activity was overestimated by 11%. These data explain the large error bars associated with the average percent differences (Fig. 3), as the averages were calculated over the 4 striata. Shifts in the y- and z-directions introduced less severe distortions and yielded maximum activity underestimations with respect to those obtained with no shift of 45% for the y-direction and 43% for the z-direction. The maximum shifts that kept the estimate of activity in any striatum accurate within 20% were 2.1 mm in the x-direction, 4.3 mm in the y-direction, and 3.6 mm in the z-direction or a rotation of 10° around the axial axis. Given that the registration accuracy was often within 1 pixel in the 3 directions, we also considered a displacement equal to the pixel size in the 3 directions (left–right direction = back–front direction = 2.1 mm, axial direction = 3.6 mm) and a rotation of 5° around the axial axis; such misregistration yielded an average bias (±1 SD) in striatal activity of −1.7% ± 14.9% (the maximum bias was −25.0% in the left putamen). The corresponding bias in BP was −5.2% ± 16.1%. Overall, even with the errors that we introduced in the spatial registration between the SPECT and anatomic data, the bias values for activity and BP estimates were always lower with PVC than without PVC, except for a translation in the x-direction equal to 1.1 cm.

Average differences (over 4 striata) in striatal activity estimates when SPECT and anatomic data were misregistered with respect to values obtained without misregistration. Error bars correspond to 1 SD. Results were obtained from simulated data processed with TEW + OSEM-A + PVC2. Displacements were simulated in the x-direction (dashed line), in the y-direction (solid line), and in the z-direction (dotted line).
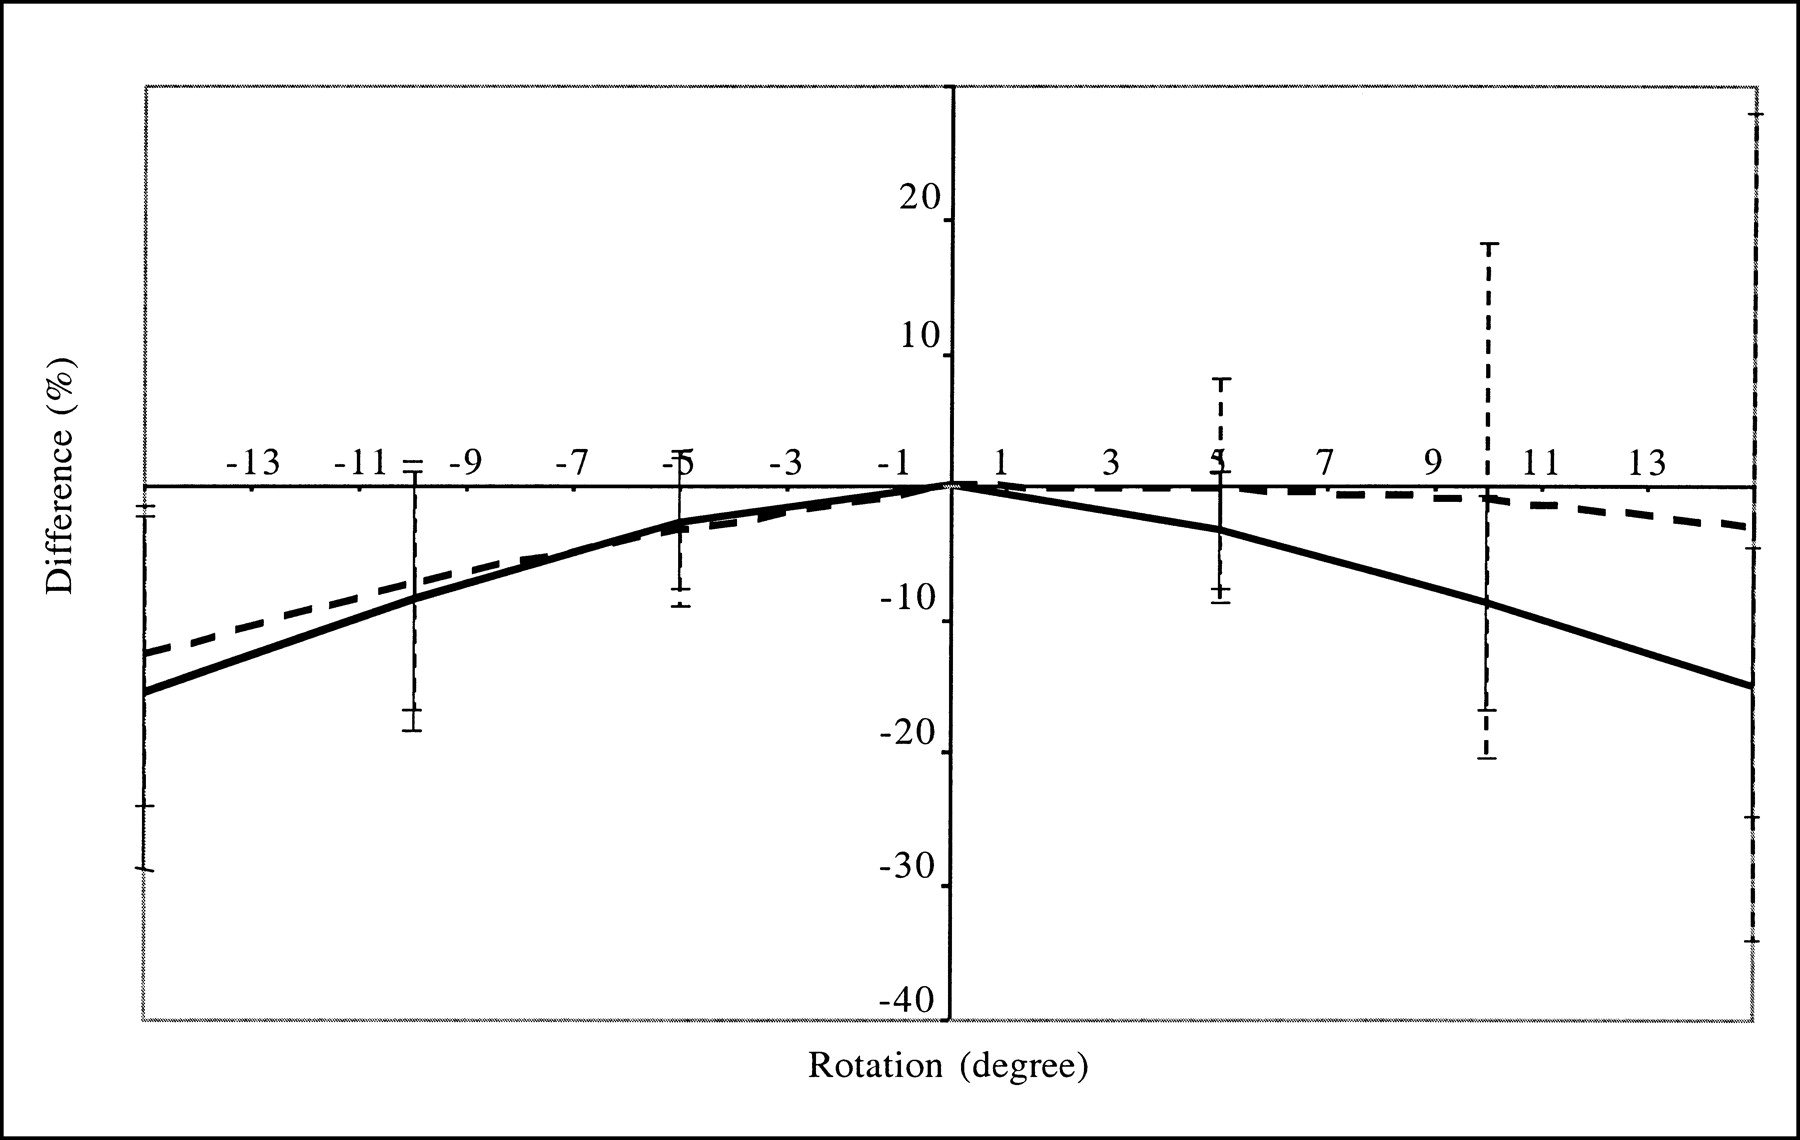
Average differences (over 4 striata) in striatal activity estimates when SPECT and anatomic data were misregistered (rotation between the two) with respect to values obtained without misregistration. Error bars correspond to 1 SD. Results were obtained from simulated data processed with TEW + OSEM-A + PVC2 and are given for caudate nuclei (solid line) and for putamen (dashed line).
Segmentation errors also affected quantitation accuracy; underestimating the striatal volume by a factor of 2.2 when estimating the weight wij involved in PVC yielded a maximum overestimation of striatal activity of 75% (mean ± SD = 70.2% ± 3.7%) with respect to the value obtained when the true striatal volume was used. Overestimating the striatal volume by a factor of 1.5 introduced a maximum striatal activity underestimation of 31% (mean ± SD = −28.3% ± 2.1%) with respect to the value obtained without segmentation errors (Fig. 5). With the segmentation errors that we introduced, the errors in striatal activity estimates averaged +84.3% ± 8.2% and −22.5% ± 1.0% for underestimation and overestimation of the striatal volumes, respectively, compared with −49.0% ± 5.5% without PVC. The errors in BP estimates averaged +88.5% ± 2.1% and −28.2% ± 2.2% for underestimation and overestimation of the striatal volumes, respectively, compared with −57.0% ± 3.8% without PVC. These results suggest that PVC improves accuracy with respect to attenuation and scatter corrections if the volumes of the segmented striata are equal to or up to 50% larger than the true volume. On the other hand, underestimating the striatal volume by a factor of more than 2 yields a poor PVC that makes the activity estimates less accurate than those obtained without PVC.
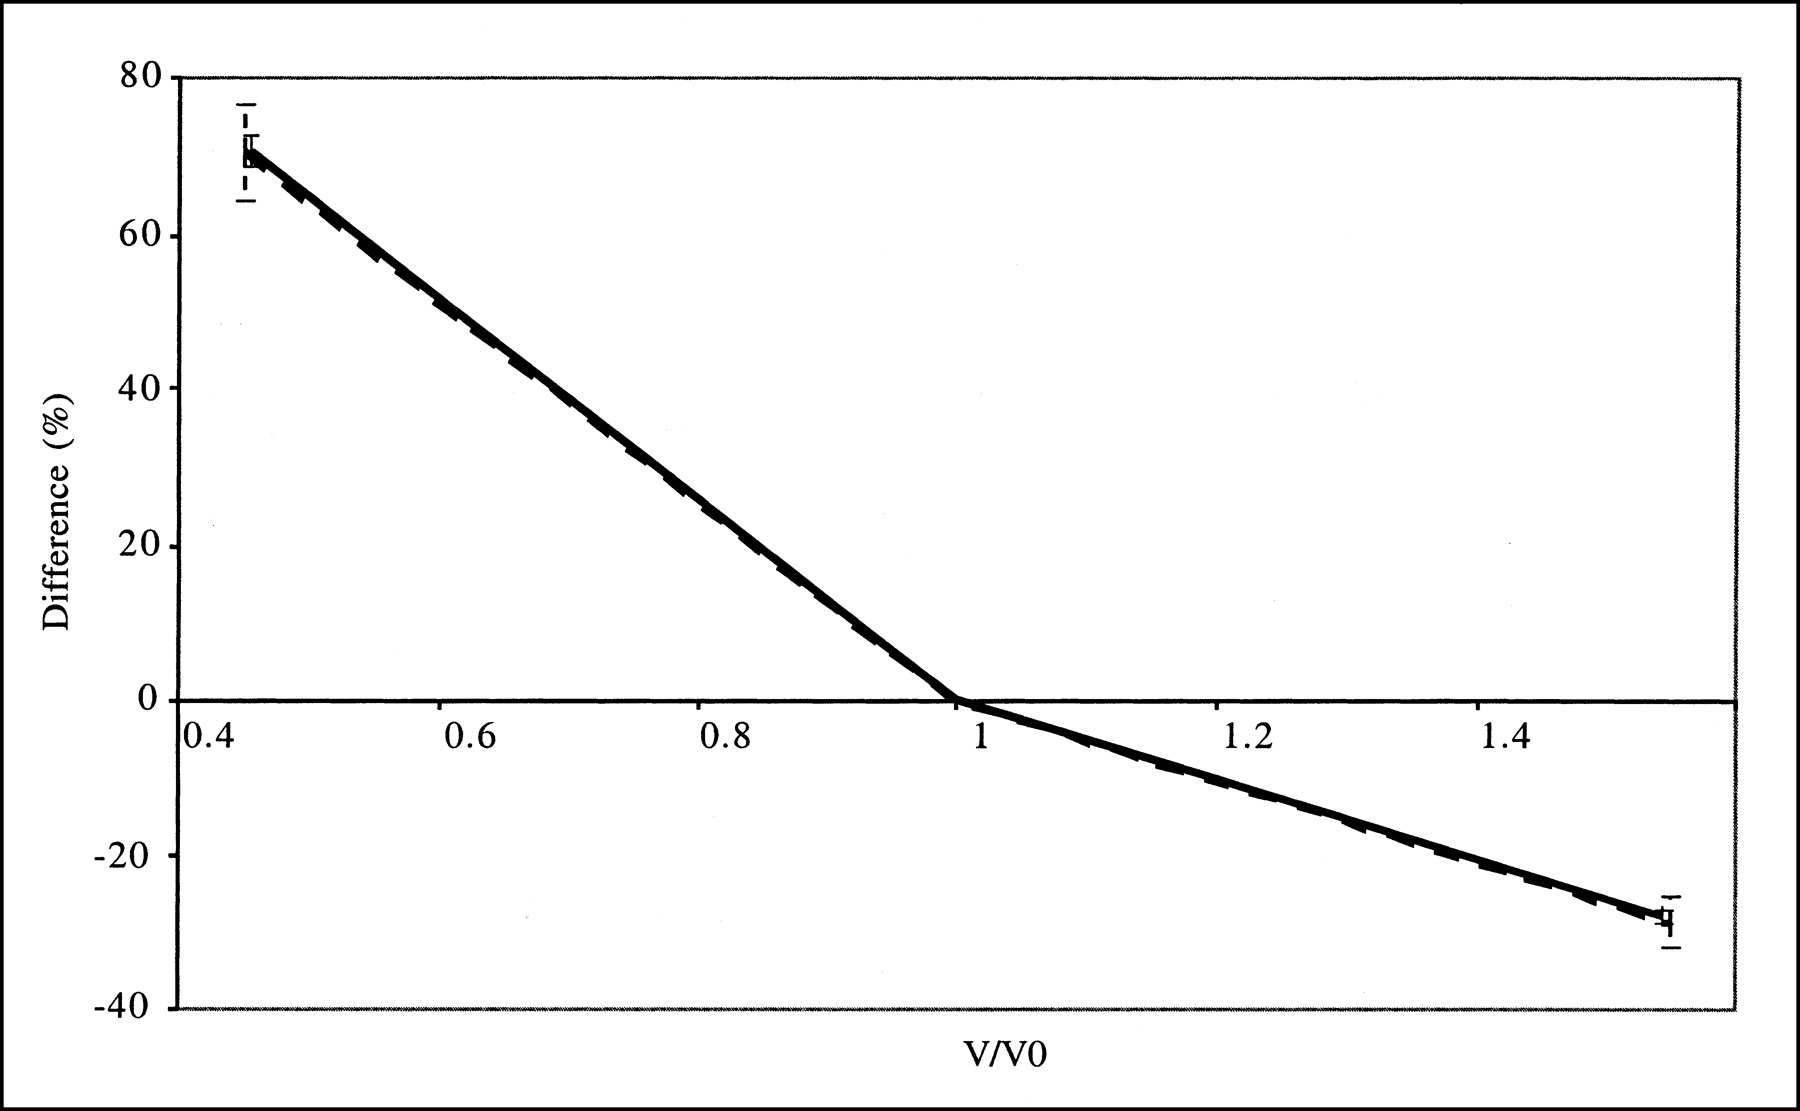
Average differences (over 4 striata) in absolute striatal activity estimates obtained with erroneous segmentation of striata with respect to values obtained with no segmentation errors. Error bars correspond to 1 SD. Results were obtained from simulated data processed with TEW + OSEM-A + PVC2 and are given for caudate nuclei (solid line) and for putamen (dashed line) as function of volume ratios between volume V of striatal compartment used for PVC and volume 0 of true striatal compartment.
Figure 6 shows the effect of a poor estimate of the FWHM parameter that is needed for PVC. A 2-mm error in FWHM estimates yielded a change in striatal activity estimates of less than 10% compared with the use of the appropriate FWHM.

Average differences (over 4 striata) in striatal activity estimates obtained with poor estimate of spatial resolution in PVC with respect to values obtained with accurate estimate. x-axis indicates FWHM used for correction (correct value was 7 mm). Error bars correspond to 1 SD. Results were obtained from simulated data processed with TEW + OSEM-A + PVC2 and are given for caudate nuclei (solid line) and for putamen (dashed line).
DISCUSSION
For 123I brain SPECT imaging of the dopaminergic system, our results suggest that both absolute quantitation (striatal activity concentration measurements) and relative quantitation (BP measurements) are severely biased when no corrections for attenuation, scatter, and PVE are applied. One of the major causes of the bias is PVE, which alone introduces a bias of greater than 45%. Furthermore, this bias depends on the size of the striata that can be affected by the disease (23) and on the spatial resolution in the reconstructed image. This variability complicates patient follow-up and prevents reliable meta-analyses of reported results regarding the density of dopamine transporters or receptors in patients.
For improvement of quantitative accuracy, attenuation correction is now widely available. With this single correction, the calibration scheme that we proposed allowed us to estimate the background activity within a 12% error (AC data in Tables 2 and 3). This result suggests that accurate estimation of nonspecific activity can be obtained by use of attenuation correction only in 123I brain SPECT. However, all striatum-related measurements remained strongly biased (errors of greater than 50%) when only attenuation was compensated for.
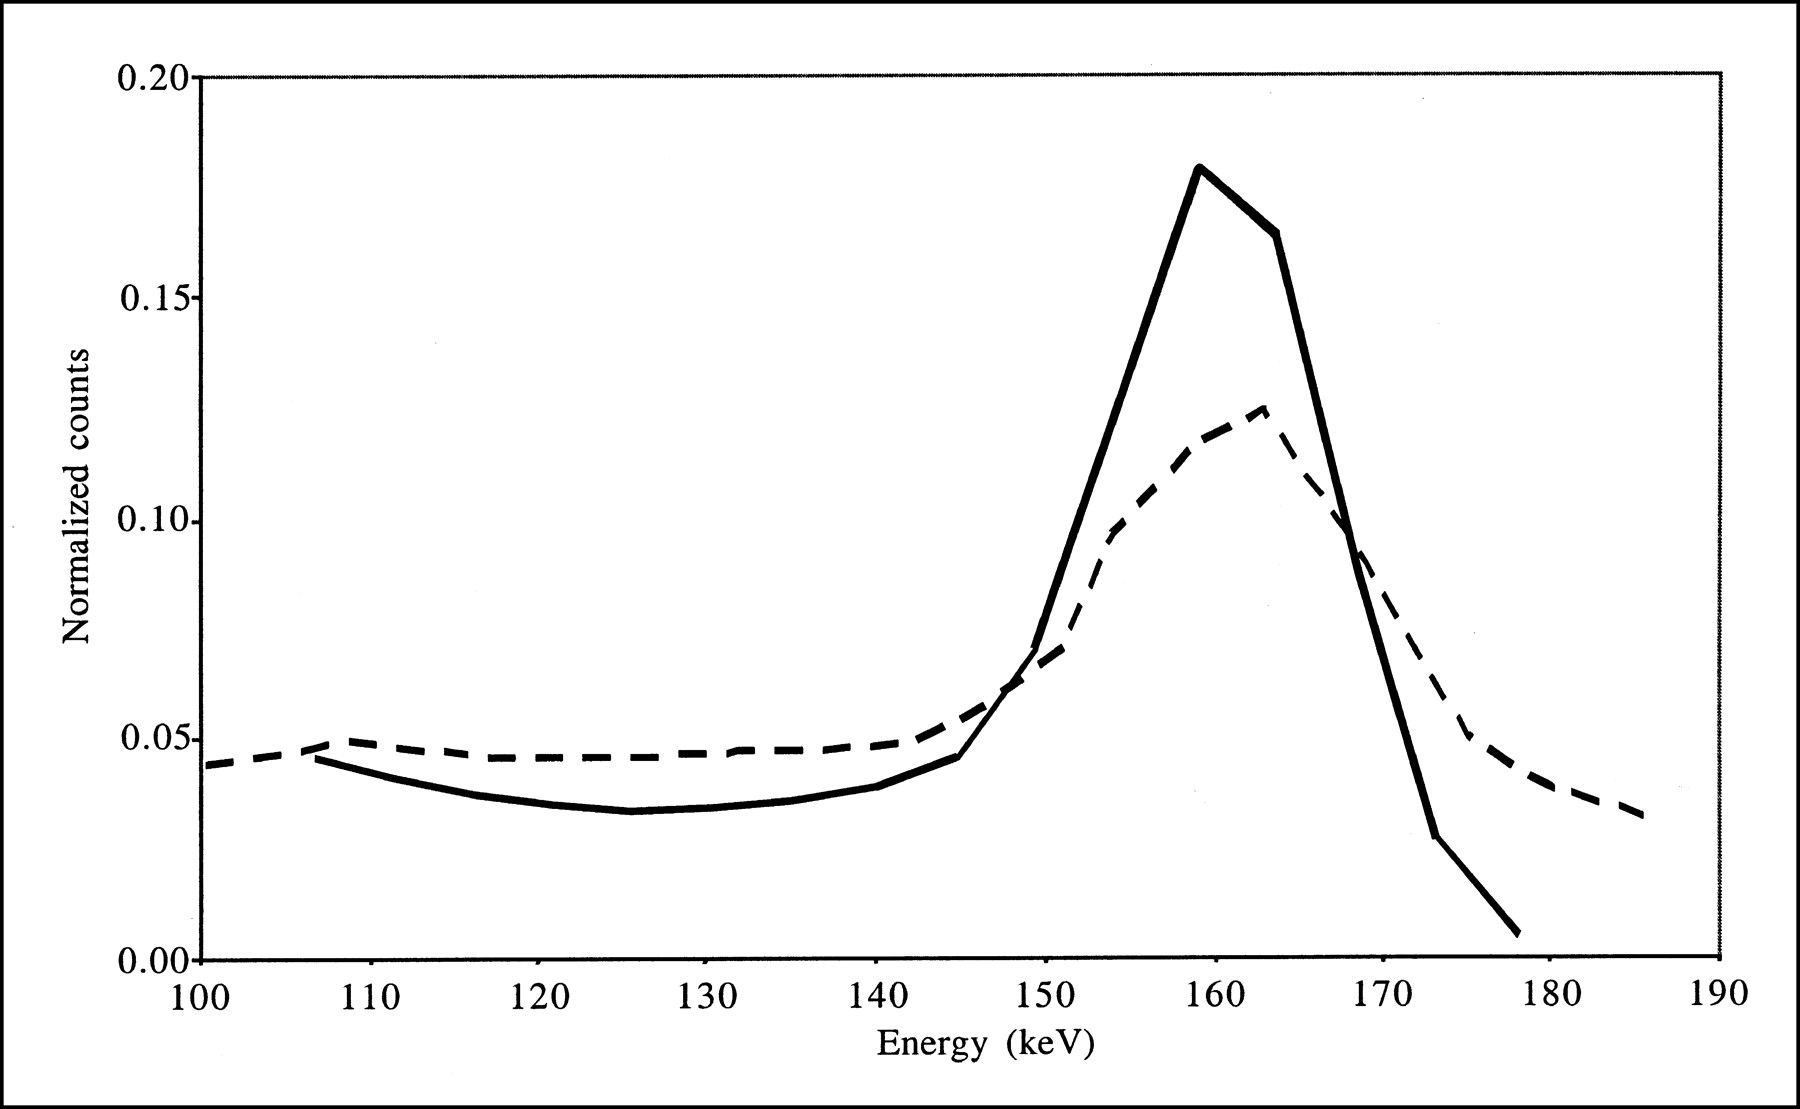
Combining scatter and attenuation corrections did not substantially change the accuracy with which background activity was estimated (compare AC and SAC data in Tables 2 and 3) because of the calibration procedure used for absolute quantitation. This procedure yielded images that included the same numbers of counts (equal to the numbers of detected counts in a wide energy range) for all processing schemes, and only the spatial distributions of these counts changed from one processing scheme to another. As the spatial distribution of scatter is low frequency, it does not much change the spatial distribution of the counts in the background, except for a scaling factor that is offset by the calibration procedure. Consistent with our results, accurate estimation of background activity with scatter and attenuation corrections combined was previously reported for 123I brain SPECT performed on baboons (13). Combining scatter and attenuation corrections slightly reduced the bias values affecting striatal measurements, but errors of larger than 45% were still observed. Lower bias values (within 20%) in BP estimates were previously reported when scatter and attenuation corrections were combined (12), but these results occurred mainly because the authors considered ROIs different from the anatomic ROIs that we considered (see below). The greater impact of scatter correction observed for the real data than for the simulated data can be explained by the larger amount of scatter in the real data, as observed by comparing the simulated and acquired energy spectra shown in Figure 7. Indeed, our simulations did not model the high-energy emission rays of 123I or the physical interactions with the collimator; the interactions of high-energy 123I photons within the collimator can introduce a significant scatter component (24,25). The different scatter contents in the simulated and acquired data also can explain the difference in bias between simulation and acquisitions when scatter correction was not applied (compare results obtained without any correction [“None”], with AC, and with AC-PVC in Tables 2 and 3). When TEW correction was applied, scatter from high-energy photons was partially corrected for, and the results obtained from real and simulated data became more similar.

Energy spectra corresponding to all detected events for simulation (solid line) and acquisitions (dashed line). Both spectra were normalized to identical numbers of counts between 100 and 175 keV.
The key correction for accurate estimates of indices involving striatal activity was PVC. The PVC that we used required segmentation—from high-resolution anatomic information—of the relevant structures of the brain that can present different activity concentrations. Accurate PVC combined with scatter and attenuation corrections led to errors of less than 10% in activity and BP estimates when the anatomic map was perfectly registered and segmented (SAC-PVC data in Tables 2 and 3). Actually, with PVC alone, BPs were underestimated by only 11% on average for the simulation and by 25% for the acquisitions (results not shown). PVC combined with scatter correction yielded average overestimations of BPs of 3% for the simulation and of 3% for the acquisitions (results not shown). These results were obtained because attenuation has no significant impact on activity ratios for structures that are attenuated similarly, such as the striata and the background. These results showed that, in order of importance of bias, the highest bias in BP estimates was introduced by PVE, the second largest source of bias was scatter, and attenuation was only the third source of bias.
The accuracy of PVC strongly depends on the precision of segmentation, of coregistration, and of the estimation of spatial resolution. Misregistration of the CT and SPECT scans and segmentation errors in the CT scans substantially reduced the accuracy of PVC. The measurements were affected mostly by shifts in the x-direction because of the geometry of the striata, which are stretched in the y-direction and thin in the x-direction (Fig. 3). Our results regarding shifts in the axial direction are similar to those previously reported (26). Registration within 1 voxel in all directions, which is usually what can be achieved in practice, yielded striatal activity estimates that were accurate within 25%; in comparison, errors of greater than 50% were obtained without any PVC. Great care should be taken to minimize gross segmentation errors, especially large underestimation of striatal volumes, as such errors could cancel out the benefit of PVC (Fig. 5). Overestimation of striatal volumes by up to 50% still yielded striatal activity and BP estimates that were more accurate than those obtained without PVC. PVC was found to be quite robust for errors in spatial resolution estimates (Fig. 6). Clinical studies are under way to determine whether the reduction in the biases affecting BP estimates helps to improve the classification of patients with various degenerative diseases, despite the increased variability of the measurements resulting from variable errors in segmentation and registration.
Two phenomena might explain the small but systematic differences in activity values between emission data resulting from sequential E scan and T scan and simultaneous E/T scans (Table 3): biases in the images resulting from the sequential E scan and T scan attributable to misregistration between the 2 scans and inaccurate removal of the transmission data from the E scan (or emission data from the T scan) in the simultaneous E/T scan. The inaccurate removal of the T scan data from the E scan data is more likely, given that the systematically higher activity estimates from the simultaneous E/T scan than from the sequential E scan and T scan were already present when the data were not corrected for attenuation (“None” data in Table 3). However, even with this potentially imperfect cross talk correction, our results suggest that the quantitative interpretation of the data remains accurate enough provided that all corrections are performed (SAC-PVC). These results are consistent with previously published results (27).
All measurements pertaining to the striata were obtained in regions corresponding to the anatomic contours of the striata. PVE can be minimized by considering smaller regions (12). However, the arbitrary criteria used to define such smaller regions strongly affect the amplitude of PVE, making measurements obtained with different criteria almost impossible to compare. In addition, measurements obtained in small regions are more prone to noise than those obtained in larger regions. Although considering anatomic regions to be ROIs enhances PVE, this consistent definition should help reduce the variability of reported results among groups, even if observer variability in the segmentation of high-resolution anatomic images cannot be completely avoided.
CONCLUSION
Using simulations and experimental measurements mimicking dopaminergic neurotransmission system 123I SPECT imaging, we demonstrated that although attenuation and scatter corrections were sufficient to accurately estimate background brain activity, striatal activity and BP values remained underestimated by about 50% when measured within anatomic ROIs. Combined with attenuation and scatter corrections, anatomically guided PVC was very effective at reducing the biases in striatal activity estimates and associated BP values, with errors of about 10%. Even with errors in registering SPECT with anatomic data on the order of 2–3 mm in all directions, PVC remained useful for substantially reducing the biases affecting striatal activity and BP estimates.
Footnotes
Received Nov. 18, 2002; revision accepted Mar. 24, 2003.
For correspondence or reprints contact: Irène Buvat, PhD, Unité 494, Institut National de la Santé et de la Recherche Médicale, Centre Hospitalier Universitaire, Pitié-Salpêtrière, 91 Boulevard de l’Hôpital, 75634 Paris Cedex 13, France.
E-mail: buvat{at}imed.jussieu.fr
REFERENCES
In this issue


Jump to section
Related Articles
Cited By...
- Continuous Repetitive Data Acquisition with 123I-FP-CIT SPECT: Effects of Rotation Speed and Rotation Time
- An Anthropomorphic Phantom Study of Brain Dopamine Transporter SPECT Images Obtained Using Different SPECT/CT Devices and Collimators
- MIRD Pamphlet No. 23: Quantitative SPECT for Patient-Specific 3-Dimensional Dosimetry in Internal Radionuclide Therapy
- Partial-Volume Effect in PET Tumor Imaging
- Is Iterative Reconstruction an Alternative to Filtered Backprojection in Routine Processing of Dopamine Transporter SPECT Studies?