


Abstract
A study of the use of 131I-labeled tositumomab, preceded by an unlabeled tositumomab predose, for therapy of 76 previously untreated non-Hodgkin’s lymphoma patients has been completed at the University of Michigan. Fifty-two of the 76 treated patients were imaged once during therapy with SPECT to assist in dosimetric estimation. In this article, the patient’s average tumor dose, estimated by a hybrid method using that SPECT, is compared with the same statistic estimated by pretherapy conjugate views. Methods: The SPECT activity-quantification procedure used 3-dimensional CT-to-SPECT image registration. Daily pretherapy conjugate-view images provided the shape of the time–activity curve for the hybrid dose estimation. Results: With the hybrid method, the mean of the patient’s average tumor dose over 8 patients using only their axillary tumors (162 cGy) was very significantly lower (P < 0.0001) than the mean over 47 patients using only their evaluated chest, abdominal, and pelvic tumors (624 cGy) for unknown reasons. Excluding axillary tumors as a best case for prediction, there still was considerable overlap in the distribution of a patient’s average tumor dose over 38 patients who went on to a complete response (CR) and that from 9 patients who went on to a partial response (PR) using either method. However, a high value of the patient’s average tumor dose was correctly associated with a CR for 15 of 16 patients (94%) with hybrid SPECT and for 9 of 12 patients (75%) with conjugate views. Also, the mean of the patient’s average tumor dose for the CR patients was larger than the mean for PR patients; the P value was 0.18 with hybrid SPECT and 0.25 with conjugate views. A multiple logistic regression analysis combining the dose, tumor burden, and level of lactate dehydrogenase as explanatory variables for response did not yield statistical significance with either method. Conclusion: Patients with evaluated tumors that receive the highest tumor radiation dose are most likely to achieve a CR. Dosimetry based on a combination of pretherapy conjugate views and intratherapy SPECT provides somewhat better correspondence between the patient’s average tumor dose and his or her degree of response compared with dosimetry from pretherapy conjugate views alone. Statistical significance for the correspondence is not reached either with the dosimetric method or with either method in combination with the tumor burden and level of lactate dehydrogenase.
Radioimmunotherapy with 131I-tositumomab, preceded by an unlabeled tositumomab predose, is showing promise in the treatment of low-grade non-Hodgkin’s lymphoma (NHL). The tositumomab monoclonal antibody was previously known as anti-B1 and the treatment by the labeled and unlabeled combination is known as 131I-tositumomab therapy. At the University of Michigan, a phase II study of 131I-tositumomab therapy of previously untreated patients with advanced-stage follicular lymphoma, the most common form of low-grade NHL, was completed and response rates were reported for 76 treated patients (1–3). Fifty-two of the 76 patients were imaged during therapy with SPECT to separate the uptake of apparently large tumors, unresolved by conjugate views during tracer evaluation, into separate uptakes for smaller, individual tumors. The tumor size and location are as specified by CT scan.
To date, clinical correlates to the degree of response in 131I-tositumomab therapy have not been easy to find. A logistic regression analysis that included patients from 6 clinical trials (phase I, II, or III) covering the full range of grades of NHL found that elevated lactate dehydrogenase (LDH), relapse after prior radiotherapy, and high tumor burden correlated with a lesser degree of response (4). Tumor radiation absorbed dose was not tested as an explanatory variable in that study.
Initial results for estimates of tumor radiation absorbed dose by a hybrid pretherapy conjugate-view intratherapy SPECT method were reported previously for 33 of the 52 patients scanned by SPECT (5). In addition, correlation of the absorbed dose for each individual tumor with the degree of response was reported for 20 of these 33 patients (6). However, because most of these 20 patients had >1 tumor and each tumor was related to a response, the statistical test of the significance of the relation between tumor radiation dose and response relied on the correctness of a complicated correction for interdependence in the software.
The correlation of tumor volume reduction 12 wk after therapy with estimated radiation dose was also performed for partial response (PR) patients and previously published (7). A negative slope was found in the plot of volume reduction of composite tumor versus dose estimate by pretherapy conjugate views, which is counterintuitive. In contrast, the experimental points with dose estimates from the hybrid method were well fit by sigmoid shapes, with volume reduction increasing with dose, as expected. The P value representing the significance of the relationship relative to no dose–response relationship approached statistical significance for all individual tumors (P = 0.06) and reached statistical significance for the subset of individual tumors that had small pretherapy volume (P = 0.03) (7).
In this article, we compare activity estimates from the hybrid method with those from the conjugate-view method, report dosimetric results from the hybrid method for 19 additional patients, and expand our examination of the results with both methods. Importantly, we analyze the same tumor CT volumes by both methods, even though the volumes are grouped into fewer, larger (composite) tumors by the conjugate-view method. In the statistical analysis, we use the patient’s average tumor radiation dose to provide more robust testing of statistical significance of the dose–response relationship. In addition, because dependence of tumor activity on time is an important dosimetric consideration, we intercompare SPECT time–activity curves during evaluation for 6 individual tumors of 1 patient and compare their sum with the curve for the corresponding composite tumor measured by conjugate views.
MATERIALS AND METHODS
Patients
Nineteen additional previously untreated patients had their axilla, chest, abdomen, or pelvis imaged by SPECT after the therapy administration of unlabeled plus 131I-tositumomab and have been analyzed by hybrid-SPECT tumor dosimetry. Thus, a total of 52 patients are potentially available for investigation of the correspondence between radiation dose and response. A few had SPECT scans in 2 regions of the trunk. However, in all cases, we were not able to perform a complete SPECT survey of all identified tumors. Of the 52 patients, half were women and half were men. The median age was 45.5 y at the time of therapy, with the youngest 23 y and the oldest 67 y.
Baseline CT, Administered Activity, and Informed Consent
Patients underwent a baseline CT scan, usually about 1 wk before the start of any nuclear medicine procedures and usually after receiving oral and intravenous contrast. They underwent pretherapy conjugate-view imaging, after a predose of tositumomab followed by a tracer dose of 131I-tositumomab antibody. The tracer evaluation and the therapy were as described (5). Patients gave their separate written informed consent for all SPECT imaging that was not part of the normal 131I-tositumomab protocol. This imaging received separate University of Michigan Internal Review Board approval.
Hybrid-SPECT Dosimetry
Except as described below, the procedure for the imaging and the methods for estimation of tumor radiation dose with conjugate views and with the hybrid method were as described (5,6). The hybrid procedure assumed that the shape of the time–activity curve for each individual tumor during therapy was the same as that for the associated composite tumor during evaluation. Our previous measurements of time–activity curves during therapy for 9 individual tumors in a patient showed 8 of the 9 curves to be similar, so the measurement of individual shapes did not seem essential (5). Moreover, in another patient, the shape of the pretherapy conjugate-view curve for the composite tumor was very similar to that for the intratherapy SPECT curve for the sum of 4 individual tumors associated with that composite tumor (5). Therefore, we chose to continue using the pretherapy conjugate-view curve shape to relieve us of the necessity of acquiring and analyzing a set of SPECT measurements after therapy.
The hybrid-SPECT procedure uses a total activity recovery coefficient, defined as the activity measured divided by the true activity. The coefficient is determined as a function of volume from a phantom study with spheres of various volumes (8). The total-activity recovery-coefficient correction factor, defined as the inverse of the coefficient, multiplies the initial estimate of tumor activity. Previously (5,6,9), when a tumor had a large volume, a value of 1 was used for the correction factor. In this study, the value read off the curve fitted to the phantom data is used regardless of the tumor volume. Monte Carlo simulation has indicated the new procedure to be correct (Y. Dewaraja, unpublished data, September 1999). Also, the new procedure yielded better agreement for an experimental liver activity measurement in an anthropomorphic phantom: With the factor fixed at 1, the activity estimate was 59.5% high, whereas, with the fitted value, the estimate was correct within 5%. The fitted curve for the correction factor for head 3 of the Prism 3000XP camera (Marconi Medical Systems, Cleveland, OH) (8) is shown in Figure 1. The dose estimates for all large individual tumors in the patients who had been evaluated previously were revised to accommodate the new correction.
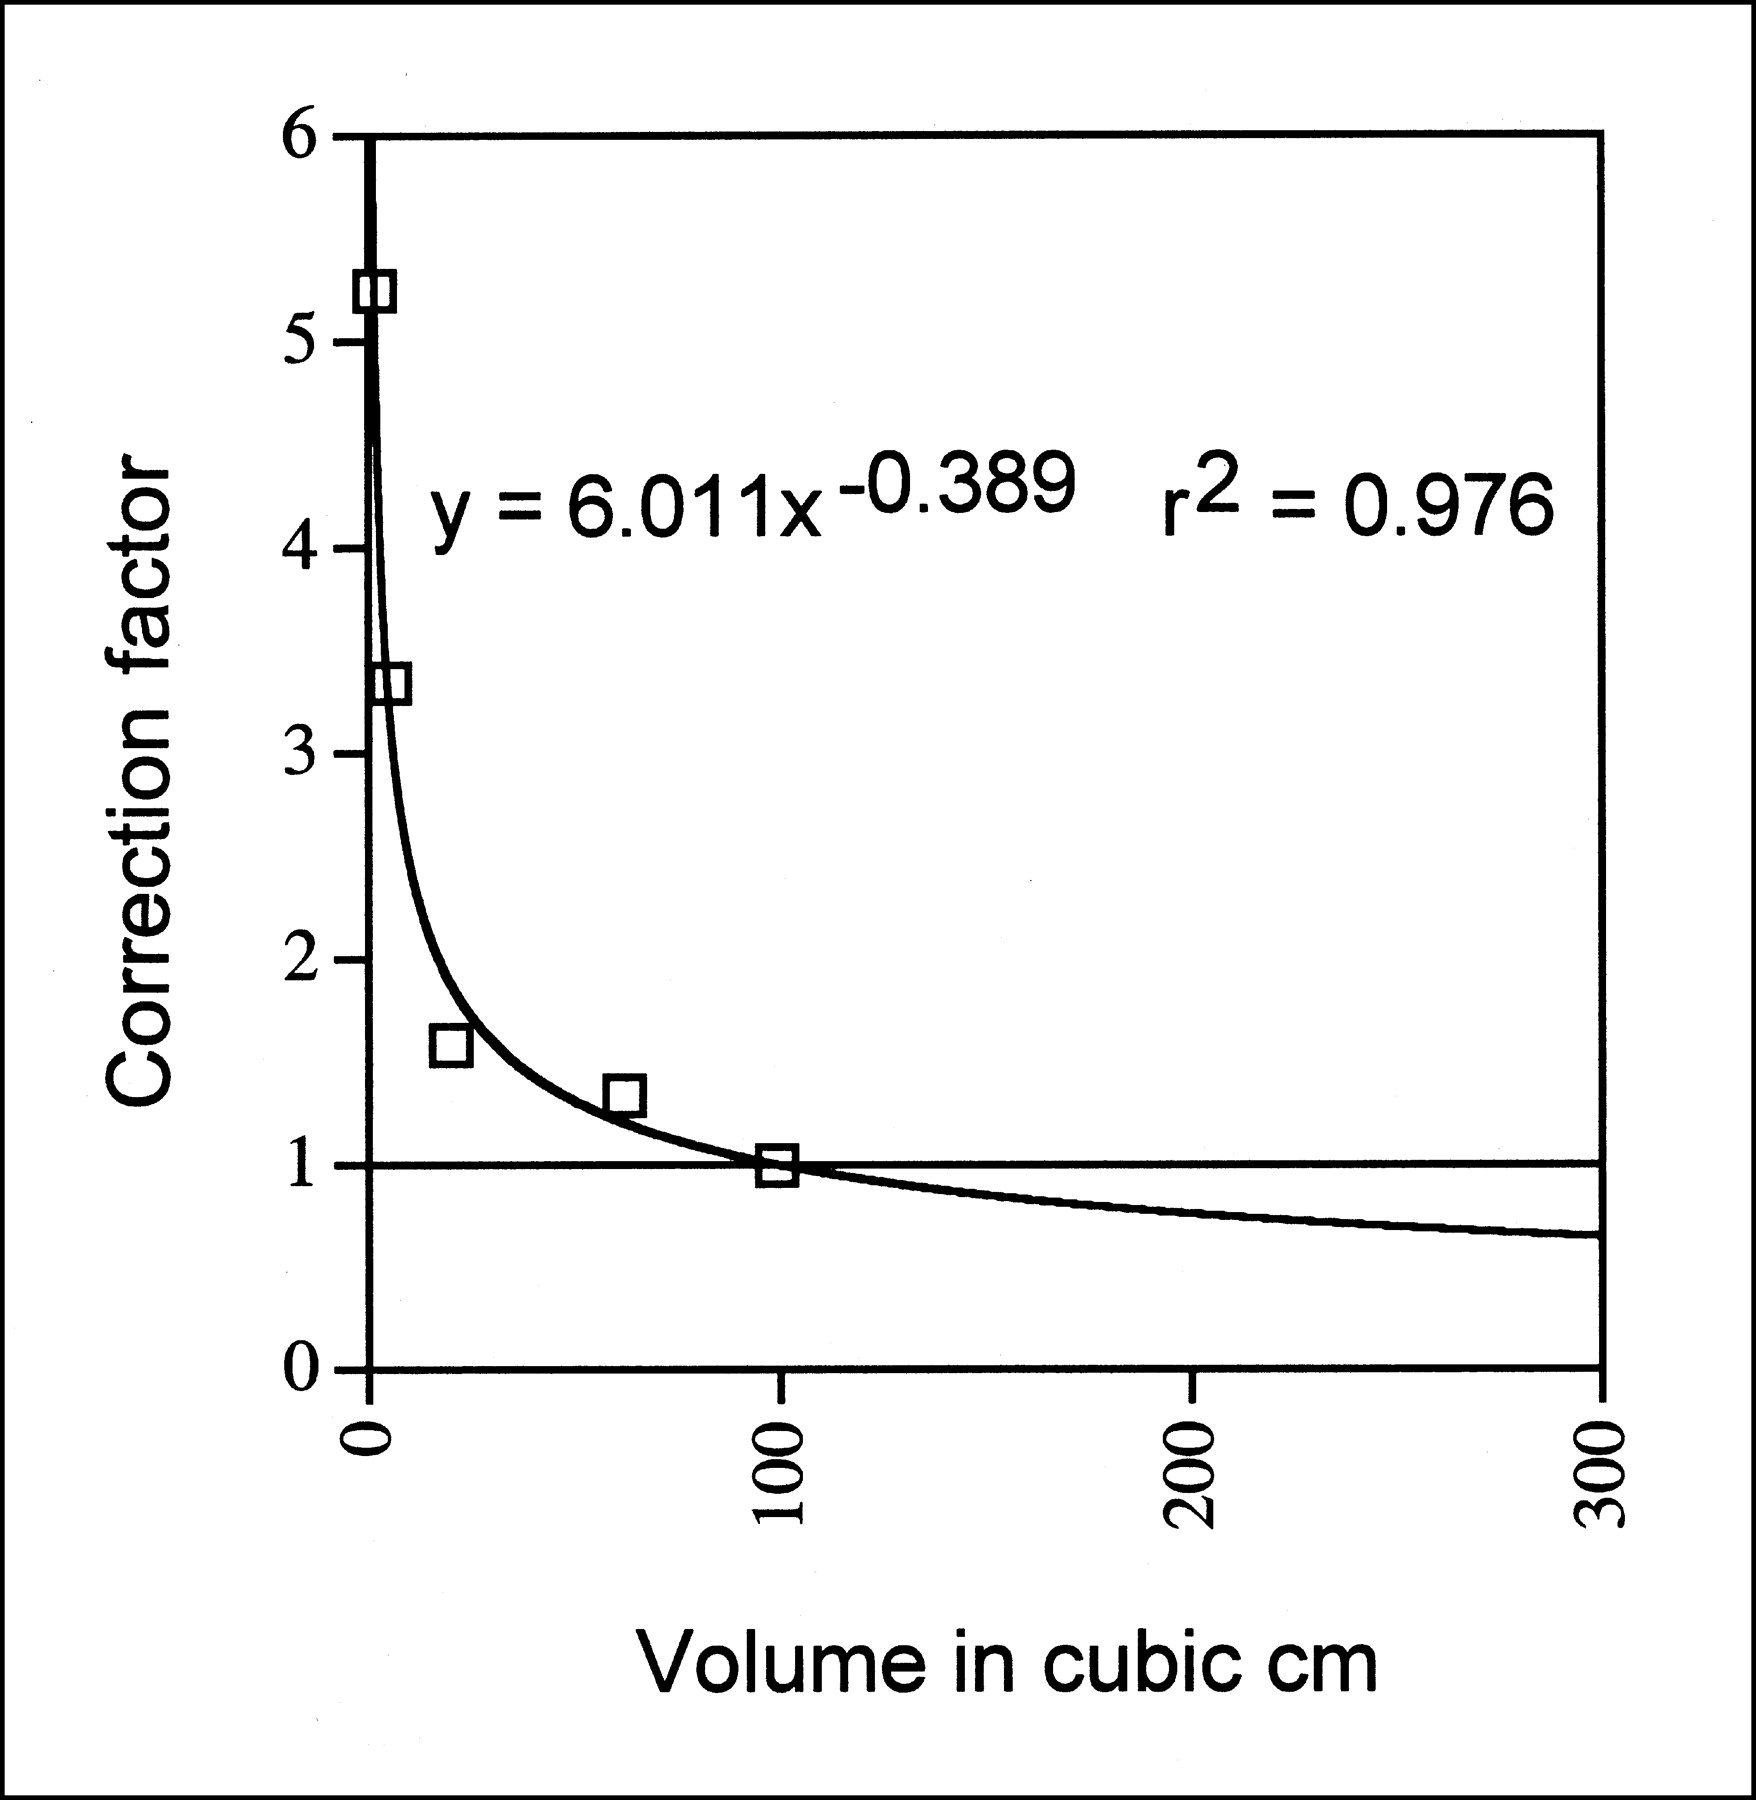
Plot of total-activity recovery-coefficient correction factor vs. volume. Data points are from measurements of 100-cm3 sphere in elliptic phantom. Power-law fit, equation, and r2 value are also given. Horizontal line at correction of 1 shows how old procedure of truncating to 1 for tumor volumes of >100 cm3 differs from new procedure of using value from power-law fit for all volumes.
In 1 substep of the hybrid method, the individual tumor therapy activity estimated from pretherapy conjugate views was compared to that measured by intratherapy SPECT. The comparison yielded the ratio, R, that served as the correction factor that was used in calculating the hybrid dose estimate for the individual tumor from that for the composite tumor (6). That ratio was defined as:
 where ASPECT was the activity of an individual tumor measured by SPECT at a given time after therapy infusion, and ACV was the conjugate-view estimate of the activity of that tumor at that time. The value for ACV was calculated from (a) the ratio of the volume of the composite tumor over that of the individual tumor, (b) the fit to the measured composite-tumor conjugate-view time–activity data taken during evaluation, and (c) the ratio of the activity administered for therapy over that administered for evaluation. In this article, we report the average value of the ratio, R.
Patient Response
For each patient, a posttherapy CT scan assessed the response to therapy at 7, 13, and 26 wk after tracer dose and every 3 mo thereafter, until disease progression. A complete response (CR) was complete disappearance of all measurable and evaluable disease for at least 4 wk, and a PR was ≥50% reduction in the sum of the products of the longest perpendicular diameters of measurable lesions for at least 4 wk, with no new lesions.
Pretherapy SPECT Time Series
Patient 64 was scanned with SPECT 6 times after the tositumomab tracer infusion that was administered for evaluation purposes. Normal conjugate-view scans were obtained either immediately before or immediately after the SPECT scans. The time period covered was 163 h. The time series provided an opportunity to compare the measured SPECT time–activity curve for the sum of 6 individual tumors to the measured conjugate-view time–activity curve for the composite tumor and also to compare the SPECT time–activity curves for the individual tumors among themselves. Unlike in the generation of the dose estimates, scatter correction was not used to generate the values for the time–activity plots. This was because the individual tumor dose estimates during evaluation were quite noisy and that noise was worse with scatter compensation, making the plots harder to interpret.
Data Analysis
Before calculating statistical significance, the dose values for PR patients and for CR patients with both conjugate-view dose estimation and with hybrid-SPECT dose estimation were checked to see if they were normally distributed. They were not, and so all of the dose data was transformed by taking the logarithm to the base 10. This change shifted the dose values toward a normal distribution and then significance was calculated. A 2-sample Student t test available within the application Excel (Microsoft, Redmond, WA) or from the Statistical Analysis System ([SAS] SAS, Cary, NC) was used to compare the dose means from different populations. Significance for the difference between the mean value for the patient’s average dose when including only axillary tumors compared with that when including only chest, abdominal, and pelvic tumors was calculated by SAS with a 2-tailed test because there was no reason to expect a difference. No declaration of variance equality or inequality was required by the software.
Significance for the difference between the mean value for the patient’s average dose over evaluated tumors for CR patients versus that for PR patients was calculated by Excel with a 1-tailed test because it was expected that the mean value for CR patients would be greater than that for PR patients. Equal variance was assumed for the 2 types of responders with conjugate views because the measured variances differed by a factor of <2. Unequal variance was assumed with the hybrid method because the measured values differed by a factor of >2.
Total tumor burden and elevated LDH level were 2-valued variables that were associated with degree of response over a large number of patients from multiple trials with tositumomab (4). A multiple logistic regression analysis was performed for the 47 patients above to see if combining radiation dose with those 2 variables produced a correlation with response (10). SAS was used.
In addition, a pseudopredictive analysis was performed for the patient’s average tumor dose and response. It served 2 purposes. The first was to characterize the amount of dose overlap between PR and CR patients—that is, if there were no overlap, the predictive values would be 100%. The second was to provide a set of pseudopredictive values for previously untreated patients. A justification is given in Koral et al. (6). A similar analysis was performed for each of the two 2-valued variables mentioned above for comparison to the results with dose.
To perform the pseudopredictive analysis, we defined the positive predictive value (PPV) to be the fraction of all patients who achieved a CR who were predicted to do so by a high average tumor dose, low tumor burden, or low LDH level. Also, we defined the negative predictive value (NPV) to be the fraction of all patients who achieved a PR who were predicted to do so by a low average tumor dose, high tumor burden, or high LDH level. Finally, we defined the accuracy (A) to be the fraction of all patients who achieved the response predicted. Also, for prediction by dose, we set the dividing line between a high and low dose to be the average value for the mean of the dose for CR patients and the mean of the dose for PR patients, as is standard.
We also made the following auxiliary definitions. We defined TP to be the number of patients predicted to achieve a CR who did; FP to be the number of patients predicted to achieve a CR who did not; TN to be the number of patients predicted to achieve a PR who did; and FN to be the number of patients predicted to achieve a PR who did not. Then, PPV, NPV, and A were evaluated as follows:


 Note that the first 2 definitions are different from those used in a previous publication (6), where they were inadvertently misdefined.
RESULTS
The average of all values of the SPECT-to-conjugate-view activity ratio, R, for chest, abdominal, and pelvic tumors was 0.69. This fraction propagates into the dose results as will be pointed out below.
To confirm an earlier finding that axillary tumors had low dose values with the hybrid method (5), the mean value over 8 patients for the patient’s average tumor dose using only axillary tumors was compared with the mean value over 47 patients using only chest, abdominal, and pelvic tumors. The mean for axillary tumors (162 cGy) was less than one fourth the mean for nonaxillary tumors (624 cGy). Variance about the mean was 774 cGy2 for the axillary tumors and 183,612 cGy2 for the nonaxillary tumors. The difference in the 2 means was highly significant statistically (P < 0.0001).
Because dose estimates for axillary tumors were uniformly low compared with other tumors, and because all patients with an analyzed axillary tumor had a CR, the axillary tumors were eliminated from the analysis of radiation dose versus response to have the best chance for obtaining a statistically significant difference between CRs and PRs based on radiation dose. If the axillary tumors had been included, they would have decreased the patient’s average tumor dose for 3 CRs, added 5 new CRs with low values for patient’s average tumor dose, and so the separation of all CRs versus all PRs would have been less.
The axillary tumors were not included as follows: The patients for whom we had evaluated only 1 or more axillary tumors by the hybrid method were excluded. The number available for the response analysis thus dropped from 52 to 47. Also, for the 3 patients for whom we had evaluated both 1 or more axillary tumors and 1 or more abdominal or pelvic tumors, the patient’s average tumor dose was computed from only his or her abdominal or pelvic tumors.
For the 47 patients, total tumor burden and LDH level are listed in columns 2 and 3 of Table 1. Each patient’s average tumor dose, as evaluated by the hybrid method, is shown in column 5. The number of individual tumors that were averaged is shown in column 4. The dose values range from a minimum of 125 cGy to a maximum of 25.4 Gy. The average dose estimate for each patient using pretherapy conjugate views also was calculated excluding his or her axillary tumors and is presented in column 7, with the number of composite tumors that were averaged shown in column 6. The dose values range from a minimum of 222 cGy to a maximum of 76.6 Gy. The patient’s response to therapy is listed in column 8.
Predictor Variables and Response for Each Patient
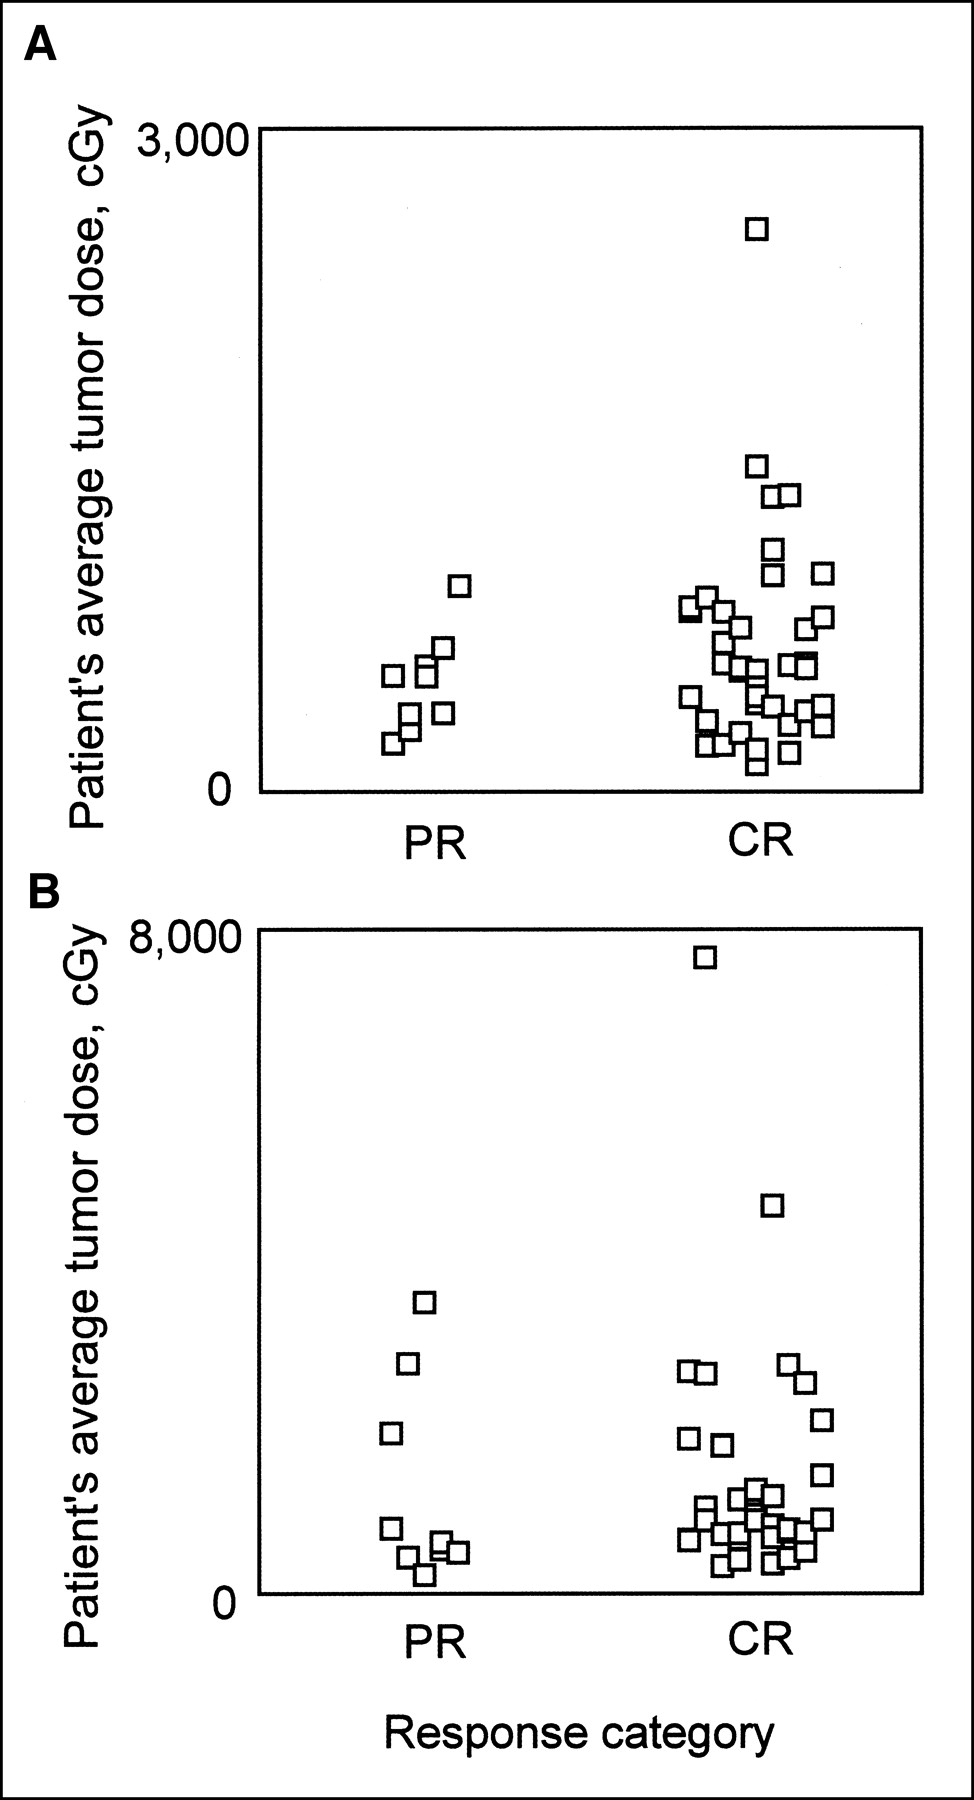
The values for each patient’s average tumor dose, as evaluated by the hybrid-SPECT method, are plotted in Figure 2A, separated by whether the individual patient went on to a PR or a CR. Figure 2 shows that a large value for a patient’s average tumor dose corresponds to a CR. In particular, 15 of 16 patients (94%) who had an average tumor dose of >651 cGy achieved a CR. On the other hand, a small value for a patient’s average tumor dose does not distinguish between a PR and a CR. (A value of 651 cGy was chosen as a good value to produce separation of response by high dose for a reasonable number of patients.)

Average radiation dose for each patient’s tumors plotted as function of patient response. (A) Dose calculated by hybrid-SPECT dosimetry. High dose corresponds to CR, but low dose is not predictive. (B) Dose calculated by conjugate-view dosimetry. Results are similar to those in A, but there is slightly more overlap.
When using conjugate views, the plot shown in Figure 2B is similar but the separation is less. Also, a high value for a patient’s average tumor dose is associated with a CR for only 9 of 12 patients (75%). Moreover, the number of patients defined as having a large dose is greater with the hybrid method (16/47 ([34%]) than with conjugate views (12/47 [26%]).
The calculated negative and positive pseudopredictive values and accuracy for pretherapy conjugate views and for hybrid SPECT, as well as for LDH and for tumor burden, are compared in Table 2. All 3 values were greater with the hybrid method than with the conjugate-view method. For accuracy alone, in order, from the poorest to the best, were conjugate-view dose, hybrid-SPECT dose, tumor burden, and LDH.
Pseudopredictive Value of Specified Predictor Variable
Summary statistics for the patient’s average tumor radiation dose by both estimation methods are given in Table 3. For the 38 CR patients, the mean is shown in column 2; for the 9 PR patients, it is shown in column 4. Reading across Table 3, it is seen that the mean of the average patient radiation dose values is greater for CR patients than for PR patients for both the conjugate view and the hybrid-SPECT method. The P value was 0.18 with the hybrid-SPECT method and 0.25 with the conjugate-view method.
Mean Tumor Radiation Dose for CRs vs. PRs with Conjugate Views or Hybrid SPECT
Reading down Table 3 in columns 2 and 4, it is seen that for PR patients, the mean with the hybrid-SPECT method is equal to 0.39 times the mean with the conjugate-view method, whereas for CR patients, the fraction is 0.48. These values reflect the R ratio of 0.69 that was given earlier. The reason the activity fraction and the dose fraction need not be the same is covered in the Discussion. Note that these dose fractions do not imply that the hybrid-SPECT dose is always lower than that of the conjugate-view dose. The data in Table 1 show that the dose estimate is less with hybrid SPECT than that with conjugate views for 35 patients but is greater for 12 patients.
The 3 variables in the multiple logistic regression model did not predict the degree of response in a statistically significant manner with either dose-estimation method. The P value was 0.51 with the hybrid-SPECT method and 0.58 with the conjugate-view method.
For patient 64, the plot of the percentage injected dose versus time after infusion for the sum over 6 individual tumors from pretherapy SPECT and for pretherapy conjugate views for the corresponding composite tumor each had about the same area under the curve. This result is the same as the published result for patient 43 (5).
The shapes of the time–activity curve for the 6 individual tumors of patient 64 were similar. This result is also the same as the published result for 8 of 9 tumors of patient 43 (5). Looking at the fine differences between the curves for individual tumors for patient 64, 2 of the tumors showed at least some rise at 19 h compared with 0 h. The other 4 were characterized by constant or decreasing values at 19 h compared with 0 h. The shape for 1 of the 4 tumors was close to that for a decaying exponential. The 2 tumors that had an activity rise at 19 h had slightly higher values at the last time point (163 h) than the values for the other 4 tumors.
DISCUSSION
The average value for R involves the same number of individual tumors evaluated by both methods. Because R equals 0.69, the hybrid method is yielding lower activity estimates than the conjugate-view method and we can interpret that result as follows. The conjugate-view estimate is too high because the hand-drawn regions of interest encompass extraneous projected activity that is not really in the tumor volume, and the SPECT estimate is too low at least partially because of errors in the SPECT–CT registration. The relative magnitude of both of these errors is difficult to access. With the hybrid-SPECT method, recent results show true tumor activity could be larger by 6.65%, on average, and by as much as 26.7% (11).
The difference in radiation dose estimated by the hybrid method between axillary and other tumors is not caused by a consistent error in technique as far as our Monte Carlo investigations indicate. Therefore, we conjecture that it is due to lower blood flow to the axillary tumors or to some other host factor.
We infer that early prediction of response may be possible for a subset of all patients with evaluated chest, abdominal, or pelvic tumors (in this sample, it would be for 16 of a total of 47 patients, or 34%)—that is, if the mean radiation dose is large, it could be predicted with confidence that the patient will have a CR. If the dose is smaller, then a prediction cannot, at present, be made (in this sample, 8 had a PR but even more, 23, achieved a CR).
Both dose methods yielded a higher mean tumor radiation dose, on average, for a patient who went on to a CR compared with a patient who went on to a PR. This result is in agreement with the trend for a correspondence between higher radiation dose and better response of refractory patients that was observed when the larger doses in myeloablative therapy (12) are combined with the smaller doses in nonmyeloablative 131I-tositumomab therapy (13). In both studies, the dose-estimation method was based on pretherapy conjugate views. The patients had a CR, PR, minor response, or disease progression. No statistical test was applied to the combined data (K.F. Koral and R.L. Wahl, unpublished data, June 1995).
Patients with a low average tumor dose proceeded to either a PR or a CR. The difference in response for these patients may be attributable to a difference in the effect of the unlabeled antibody, even though the same amount was infused for all patients. However, in comparable patients, there is as yet no experimental evidence for such a difference in unlabeled antibody effect with equal predose.
A different possibility is that the accuracy of our method for dose estimation is not high enough or that the sampling of tumors in the chest, abdomen, and pelvis was somehow insufficient for our purpose. In the hybrid method, the conversion factor to produce the activity estimate from total reconstructed counts varies with the ratio of the background to the tumor activity concentration. The estimate for this ratio in patients varies widely between different tumors and is cause for concern that some of the individual dose values may be inaccurate. Use of a super-high-resolution reconstruction algorithm in the future could possibly eliminate this problem by making the counts-to-activity conversion factor independent of the level of background activity. The sampling problem could be reduced by the use of a SPECT camera with a large field of view.
Another possibility is that the follicular class of NHL combines patients whose disease is diverse. This has been shown to be the case in the diffuse large B-cell class of NHL. In that class, gene expression profiling has identified 2 subgroups with significantly different overall survival (14). If such profiling could have separated our patients into subgroups, the dose values might have been more predictive.
The lack of higher P values is in contrast to recent results with radiopharmaceutical therapy of neuroblastoma with 131I-methyliodobenzylguanidine (MIBG). In that disease-therapy system, with 16 PRs, 3 mixed responses, 14 cases of stable disease, and 9 cases of progressive disease, tumor self-absorbed radiation dose was a significant predictor of degree of response (P < 0.01) (15). Intratherapy conjugate views were used and a single tumor was selected for each patient on the basis of MIBG uptake.
The lack of a bigger difference between the hybrid method and conjugate views in predicting response is in contrast to the large difference in the results for the 2 methods in the study of volume-reduction versus dose (7) that was cited previously. The reason may be that conglomeration of the dose and the volume reduction of several individual tumors into a composite tumor, as was done in the conjugate-view part of that study, may be very suboptimal in predicting the volume reduction from dose. This, in turn, would result because the dose and the volume from 2 or more tumors, which are perhaps unlike, are first both combined and then the ratio is effectively taken to get the dose for the composite tumor, leading to a value that is perhaps not representative of the true dose for any of the constituent tumors. Similarly, the volumes before and after therapy are first both combined and then the ratio is taken to get the volume reduction for the composite tumor. This procedure could lead to calculated values of volume reduction that are unrealistic. Because both variables can have large errors, an incorrect correspondence is not surprising.
It appears that taking into account the shape differences among the time–activity curves for individual tumors would affect the cumulated activity for the individual tumors to only a small extent (on the order of 10%). Therefore, from the results we have on only 2 patients, there is no evidence that measuring such shape differences for individual tumors would greatly affect the observed degree of separation for patient average radiation dose between CRs and PRs.
CONCLUSION
Our data suggest that for previously untreated patients with follicular lymphoma who receive 131I-tositumomab therapy, those with evaluated tumors that receive the highest radiation dose are most likely to achieve a CR. For those with tumors that receive a lower radiation dose, the degree of response cannot, at present, be predicted. Dosimetry based on a combination of pretherapy conjugate views and intratherapy SPECT provides somewhat better correspondence between the patient’s average tumor dose and his or her degree of response compared with dosimetry from pretherapy conjugate views alone. Statistical significance for the correspondence is not reached with either dosimetric method or with either method in combination with tumor burden and level of LDH.
Acknowledgments
We gratefully acknowledge the assistance of Chuck Meyer in providing the MIAMI FUSE registration program and that of Jeff Fessler in making the SAGE reconstruction program available. The technical assistance of Carla Barrett, Paul Kison, Nancy McCullough, Andrew Paberzs, Sharon Lin, Fahim Razzaque, Sheila Shah, and Virginia Rogers is also appreciated. This work was supported by grants R01 CA87955, CA38790, CA42768, and CA56794, awarded by the National Cancer Institute, U.S. Department of Health and Human Services; by grant M01 RR042, awarded by the National Center for Research Resources, National Institutes of Health, U.S. Department of Health and Human Services; and by a grant from Corixa Corporation. The contents are solely the responsibility of the authors and do not necessarily represent the official views of the National Cancer Institute or Corixa Corporation.
Footnotes
Received Apr. 19, 2002; revision accepted Sep. 25, 2002.
For correspondence or reprints contact: Kenneth F. Koral, PhD, Division of Nuclear Medicine, University of Michigan, B1G412 UH, Ann Arbor, MI 48109-0028.
E-mail: kenkoral{at}umich.edu
In this issue


Jump to section
Related Articles
Cited By...
- Dosimetry in Clinical Radiopharmaceutical Therapy of Cancer: Practicality Versus Perfection in Current Practice
- Tumor-Absorbed Dose for Non-Hodgkin Lymphoma Patients Treated with the Anti-CD37 Antibody Radionuclide Conjugate 177Lu-Lilotomab Satetraxetan
- Tumor-Absorbed Dose Predicts Progression-Free Survival Following 131I-Tositumomab Radioimmunotherapy
- MIRD Pamphlet No. 23: Quantitative SPECT for Patient-Specific 3-Dimensional Dosimetry in Internal Radionuclide Therapy
- 131I-Tositumomab Radioimmunotherapy: Initial Tumor Dose-Response Results Using 3-Dimensional Dosimetry Including Radiobiologic Modeling
- Comparison of Medium- and High-Energy Collimators for 131I-Tositumomab Dosimetry
- Collimator Selection, Acquisition Speed, and Visual Assessment of 131I-Tositumomab Biodistribution in a Phantom Model
- Accurate Dosimetry in 131I Radionuclide Therapy Using Patient-Specific, 3-Dimensional Methods for SPECT Reconstruction and Absorbed Dose Calculation
- Radioimmunotherapy of Non-Hodgkin's Lymphoma Revisited
- Tositumomab and 131I Therapy in Non-Hodgkin's Lymphoma
- Patient-Specific Dosimetry for 131I Thyroid Cancer Therapy Using 124I PET and 3-Dimensional-Internal Dosimetry (3D-ID) Software
- Bias Reduction in Correlation of Radiation-Absorbed Dose with Response
- Radioimmunotherapy of Non-Hodgkin's Lymphoma
- Radioimmunotherapy of Non-Hodgkin's Lymphoma with 90Y-DOTA Humanized Anti-CD22 IgG (90Y-Epratuzumab): Do Tumor Targeting and Dosimetry Predict Therapeutic Response?
- Correlation of Tumor Radiation-Absorbed Dose with Response Is Easier to Find in Previously Untreated Patients