


Abstract
To evaluate myocardial blood flow (MBF) and cardiac function with a single dose of 13NH3, electrocardiographically (ECG) gated PET acquisition was performed after a dynamic PET scan was obtained. Gated blood-pool (GBP) imaging with C15O PET was also performed to compare the left ventricular ejection fraction (LVEF) obtained using the 2 methods. Methods: Six healthy volunteers and 34 patients with cardiovascular disease were studied. Each subject underwent dynamic PET scanning after a slow intravenous injection of approximately 740 MBq 13NH3, followed by ECG gated PET scanning. MBF images were calculated by the Patlak plot method. Before obtaining the 13NH3 scan, the GBP image was obtained with a bolus inhalation of C15O. Twenty patients also underwent left ventriculography (LVG) to compare the value of the LVEF obtained using this technique with that determined using the gated PET method. Results: The mean regional value of MBF calculated for healthy volunteers in the resting condition was 0.61 ± 0.10 mL/min/g. The LVEF obtained using GBP PET (EFCO) was consistent with that obtained using LVG. The LVEF calculated from gated 13NH3 scans (EFNH3) correlated well with EFCO, although EFNH3 slightly underestimated the LVEF (EFNH3 = 0.97 · EFCO − 2.94; r = 0.87). EFNH3 was significantly different from EFCO in patients with a perfusion defect in the cardiac wall (EFNH3 = 39% ± 11% vs. EFCO = 45% ± 11%; n = 19; P < 0.001), whereas no significant difference was found between them in subjects with no defect (EFNH3 = 58% ± 13% vs. EFCO = 61% ± 10%; n = 21). Conclusion: Gated PET acquisition accompanied by obtaining a dynamic PET scan with a single dose of 13NH3 is a promising method for the simultaneous clinical evaluation of MBF and cardiac function. However, in patients with a defect in the cardiac wall, EFNH3 showed a tendency to underestimate the EF compared with EFCO.
Cardiac function, left ventricular (LV) volume, and myocardial blood flow (MBF) are important factors for evaluating the prognosis of patients with cardiovascular disease (1–4). Recently, assessment of cardiac function has been reported to be important for prediction of the prognosis in patients with early-phase myocardial infarction (5,6). Simultaneous measurements of the ejection fraction (EF) and MBF with a single dose of tracer would be ideal for studies of patients with cardiovascular disease because such measurements could quantitatively evaluate global (EF) and regional (wall motion) cardiac function in addition to perfusion. The EF can be assessed noninvasively using nuclear cardiology with planar radionuclide angiography or with electrocardiographically (ECG) gated tomography (7,8); however, the relatively long half-life of 99mTc-labeled tracers prevents simultaneous assessment of perfusion and cardiac function when using tracers for blood-pool imaging. Recently, the technique of ECG gated SPECT with a tracer for perfusion imaging has been established and applied to measure the LVEF in the scanning of perfusion images (9–11). 13NH3, commonly used for measurement of quantitative MBF in PET studies (12–17), is therefore expected to be an appropriate tracer for making the 2 measurements with a single dose of tracer. MBF can be calculated from the initial several minutes of dynamic acquisition, and the LVEF can be obtained from the subsequent ECG gated PET acquisition. Because the half-life of 13NH3 is 10 min, repeated measurement of both parameters with or without stress would be possible after an interval of ≥60 min (13).
To evaluate our new protocol for the measurement of MBF, LV volume, and LVEF with a single injection of 13NH3, dynamic and ECG gated PET acquisition was performed in healthy volunteers and patients with cardiovascular disease. Gated blood-pool (GBP) imaging with C15O was also applied to all subjects to compare the LVEF with that obtained from the 13NH3 PET. The patients who underwent coronary angiography also underwent left ventriculography (LVG) to compare the LVEF obtained using this technique with that obtained by the gated PET method.
MATERIALS AND METHODS
Subjects
Six healthy volunteers (5 men, 1 woman; age, 28–53 y; mean age, 38.2 ± 10.4 y) were recruited for the PET study as control subjects. Thirty-four patients (22 men, 12 women; age, 39–80 y; mean age, 68.8 ± 8.1 y) with cardiovascular disease were studied with 13NH3 PET to evaluate myocardial perfusion and function. Fourteen of the patients were diagnosed with angina pectoris, and the rest of them had an old myocardial infarction (OMI). Twenty of the patients also underwent coronary angiography and LVG to assess coronary circulation and cardiac function on a different day from that of the PET study. All patients were classified into 2 groups: those with or without a perfusion defect on the resting perfusion PET image. The Ethical Committee of the Shiga Medical Center approved the study. Written informed consent was obtained from each subject before the study.
PET Procedures
All subjects underwent PET scanning using a whole-body tomography scanner (ADVANCE; General Electric Medical Systems, Milwaukee, WI), which permits simultaneous acquisition of 35 image slices with an interslice spacing of 4.25 mm (18). Performance tests showed the intrinsic resolution of the scanner to be 4.6–5.7 mm in the transaxial direction and 4.0–5.3 mm in the axial direction. A transmission scan was obtained using 68Ge/68Ga for attenuation correction in each subject before administration of the tracer. PET images were blurred to 6.0-mm full width at half maximum in the transaxial direction using a Hanning filter for the reconstruction of data.
The subjects lay on the scanner bed in a supine position and their arms were raised and laid above their head. The scanning range was determined using echocardiography by identifying the position of the heart. Electrodes for the ECG gated PET were attached to the subject’s body. Each subject inhaled C15O as a single dose of 1,200 MBq to perform a GBP study before obtaining the 13NH3 scan. The GBP scanning was started after the arrival of the peak count of C15O in the cardiac cavity and continued for 5 min with 8 frames per cycle. After an interval of 15 min, approximately 740 MBq 13NH3 were administered into the right antecubital vein over 40 s with a constant flow rate using a liquid tracer injector (M-110; Sumitomo Heavy Industries, Ltd., Tokyo, Japan). A 5-min dynamic PET scan was started at the time of the tracer administration with frame durations of 5 s × 12, 10 s × 6, 20 s × 3, and 30 s × 4, followed by a 10-min-gated scan in the same mode as the GBP scans (8 frames per cycle). The decay of radioactivity in the dynamic PET data was corrected to the starting point of each scan.
Calculation of MBF and EF
The MBF images were calculated using the Patlak plot method (15,16,19). The last 4 frames of dynamic PET data (i.e., frame time of 3–5 min from the start of the scan) were summed and used to draw regions of interest (ROIs). The ROIs were drawn in the cavity and in the myocardial wall of the LV to obtain time-activity curves for the arterial blood and myocardial tissue; these values were used as the arterial input function and the time-activity curve for the global tissue (15). In the graphic plotting, all frames of dynamic data were used to determine appropriate time frames for applying them to the pixel-by-pixel calculation. The time frames of 30 s to 2.5 min were generally used to obtain the influx rate constants (K*) and MBF in the dynamic scans with 13NH3 to avoid effects of metabolites of 13NH3 (15,17). When the slope of the graphic plotting did not show excellent linearity during the above time frames, the appropriate time frames were selected so that the slope could be used for image calculation. After the time frames for MBF calculation were determined, the K* values were calculated pixel by pixel as the slopes of the graphic plotting for each pixel value (20). The table-lookup method was then applied to convert K* values into MBF values using the following equation (12,16):
 A constant recovery coefficient of 0.75 was used for calculation of K* in the graphic plotting method (16). The transaxial MBF images thus obtained were reoriented into LV short-axis planes to obtain regional MBF values. Multiple circular ROIs (diameter, 6 mm) were drawn in the LV short-axis planes of the MBF images, and 40 regional MBF values were obtained for each subject.
The LVEF was calculated from the gated 13NH3 PET data acquired for 10 min. A program named Perfusion and Function Assessment by Myocardial SPECT (pFAST, version 2; Sapporo Medical University, Sapporo, Japan), which is operated on Windows 98 for personal computers, was used for the calculation of the LVEF from the gated PET data (10). The program provides LV end-systolic and end-diastolic volumes (ESV and EDV) and the LVEF. The ESV, EDV, and LVEF were also calculated from the gated C15O PET data. Using the GBP images, the LV volume in each frame was obtained from summation of the voxel volume inside of the LV determined in each slice. A threshold to define the LV volume from GBP images was determined using fusion images of gated 13NH3 PET and GBP on healthy volunteers. The threshold for each subject was determined in a percentage of the peak radioactivity judged by visual evaluation to fit in the outer boundary of the blood-pool image meeting the inside of the ventricular wall of the perfusion image. To apply the threshold for GBP images to patients’ data, a mean threshold value was obtained from 6 volunteers. The ESV and EDV were determined to be the smallest and largest volumes of LV, respectively, in the 8 frames of the GBP images.
Statistical Analysis
Differences between the values of the LVEF obtained using the different methods in the 20 patients who underwent LVG were compared statistically using repeated-measures ANOVA. If a difference was observed among the 3 methods, a post hoc comparison was done using a protected least-significant difference method (Fisher’s PLSD). Differences between the LVEFs and LV volumes (ESV and EDV) obtained from gated 13NH3 PET (pFAST) and GBP PET images were also compared in all subjects or in the 3 subgroups of subjects using a paired t test. Differences between the LVEFs obtained from LVG and GBP and those between GBP and pFAST were assessed according to the Bland-Altman plot method (21). The Student t test was used to determine whether the resulting difference from zero was significant. P < 0.05 was considered to indicate a statistically significant difference.
RESULTS
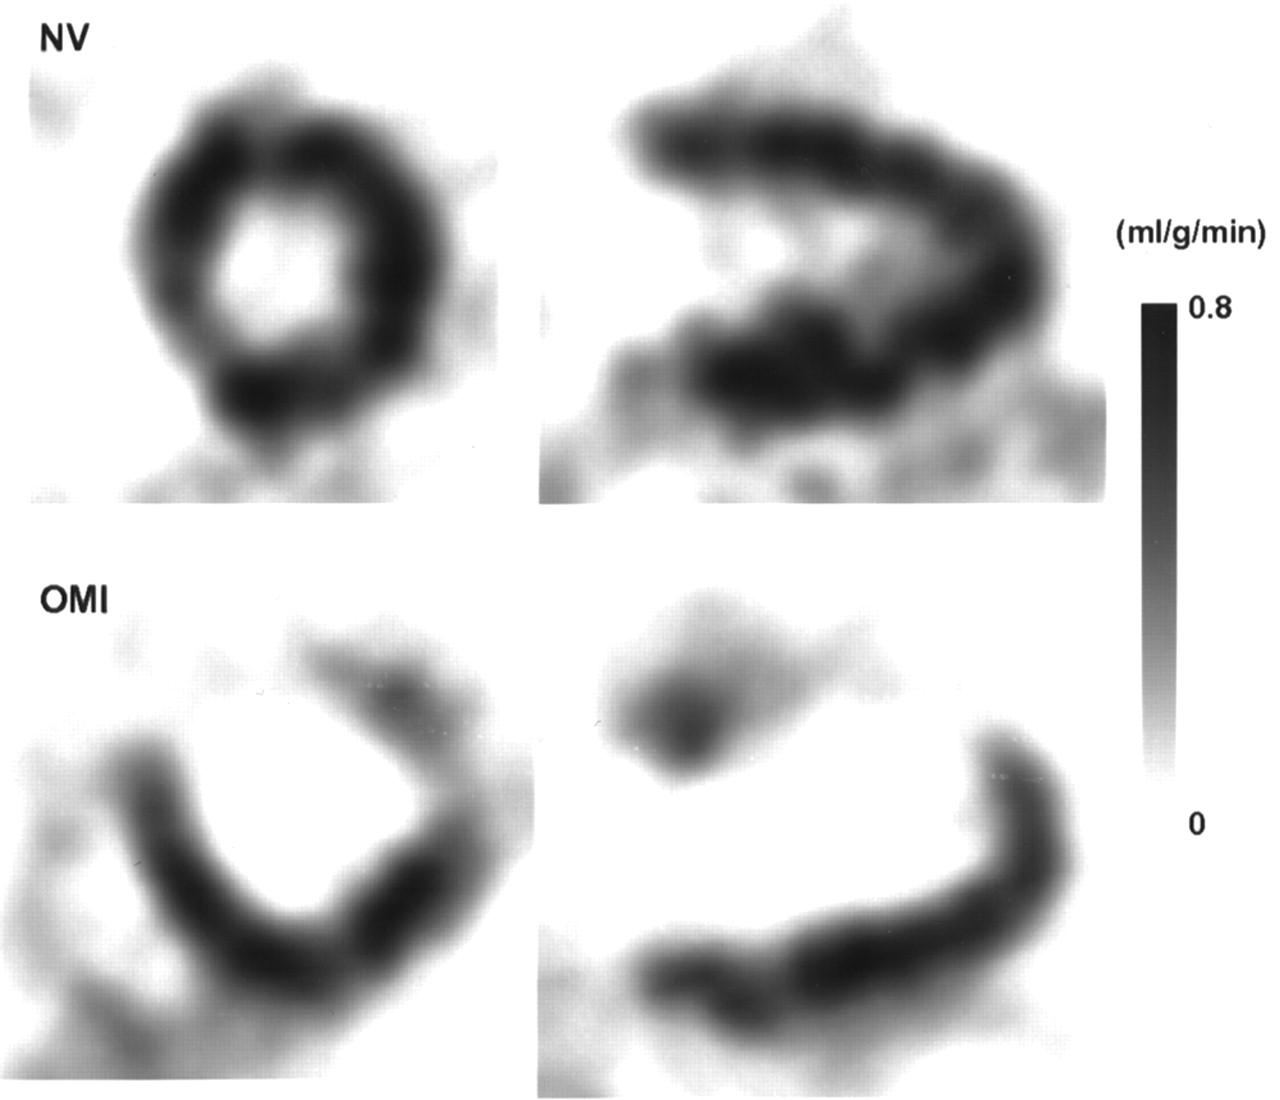
A stable speed of tracer infusion by means of an automatic injector for liquid tracers provided a constant influx rate and excellent linearity in the graphic plotting (Fig. 1). Pixel-by-pixel image calculation of MBF based on the Patlak plot method yielded quantitative regional values in healthy volunteers and in patients with cardiovascular disease (Fig. 2). MBF calculated for healthy volunteers showed a mean value of 0.61 ± 0.10 mL/min/g, with a range of regional flow values of 0.48–1.03 mL/min/g, which is considered to be within the normal range under the resting condition. Regional values of MBF in patients showed good accordance with the severity of their disease. Nineteen of 20 patients with an OMI had a perfusion defect on the resting MBF image; the other 15 patients, including 1 patient with a minor OMI, showed no perfusion defect.
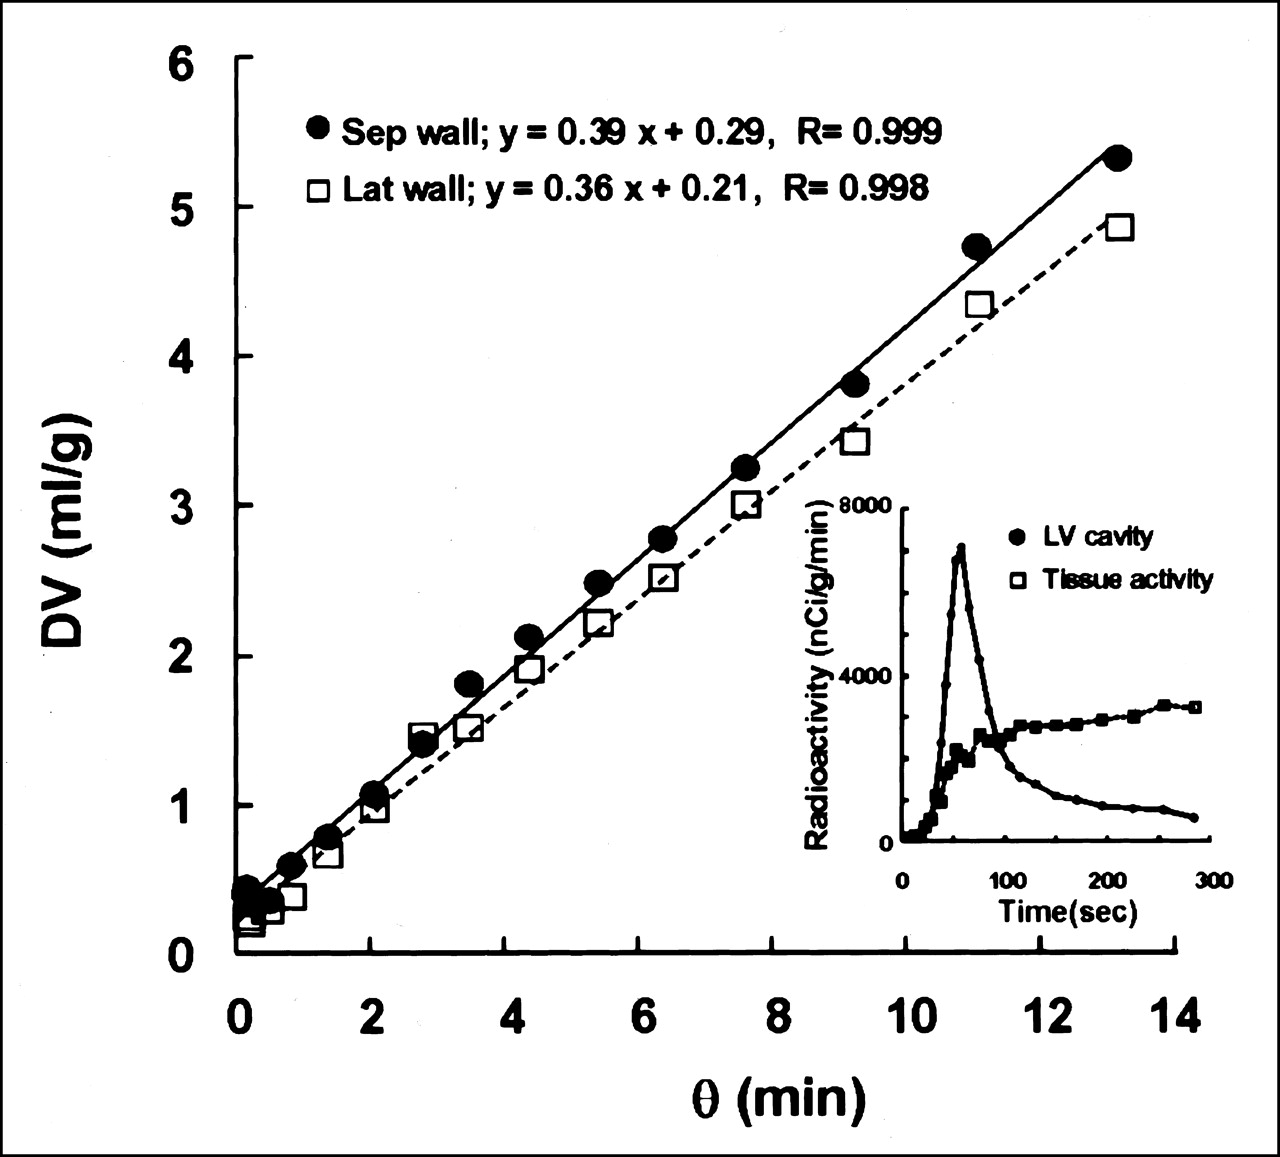
Graphic plotting method (Patlak plot) was applied for calculation of MBF. Representative Patlak plot shows excellent linear regression for total frame time of 5 min. Insert shows time-activity curves for LV cavity and myocardial tissue obtained from same dynamic 13NH3 PET data. θ = normalized time; DV = volume of distribution; Sep = septal; Lat = lateral.

Representative images of MBF of healthy volunteer (NV) and of patient with OMI (with defect) in anterior wall. Images of MBF were calculated pixel by pixel on basis of graphic plotting method. Slopes of linear fit using time frames of 30–150 s in plots (Fig. 1) were converted into MBF values. Images were resliced into LV short-axis and long-axis planes.
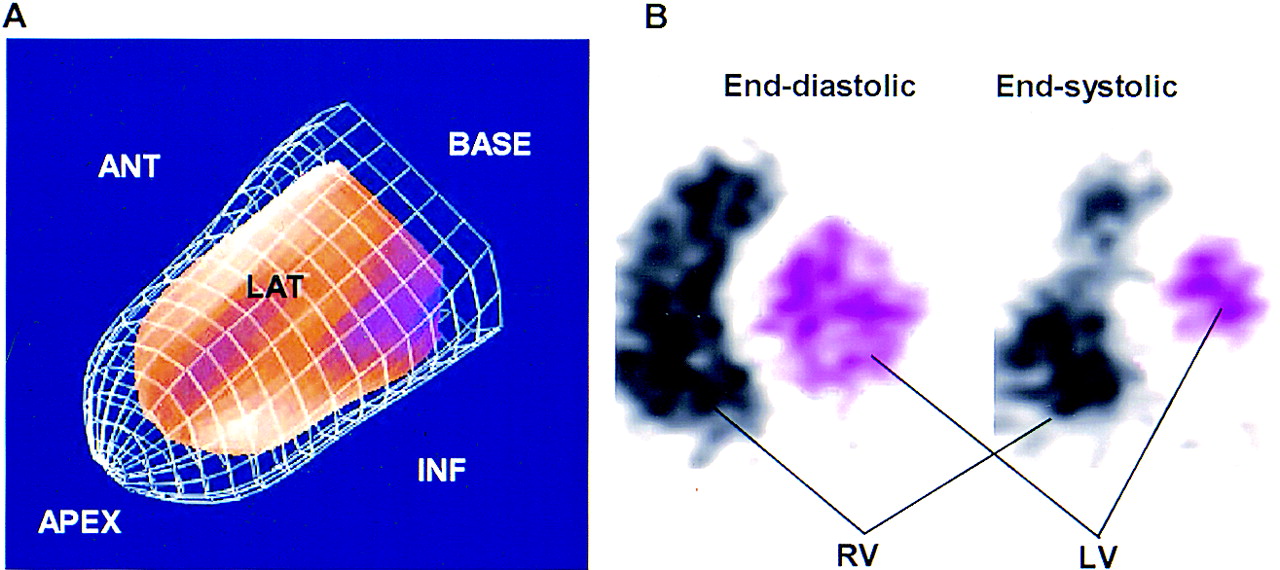
Myocardial wall motion images generated from gated 13NH3 PET and pFAST clearly reflected the movements of the cardiac wall in a 3-dimensional (3D) mode, and the LVEF (EFNH3) of each subject could be calculated from the ESV and EDV of the LV (Fig. 3A). The LVEF was also calculated from the GBP image (EFCO) by determining the voxels inside the LV (Fig. 3B). A threshold of 25% of the peak radioactivity in the LV blood pool, which was obtained from the mean of 6 healthy volunteers, was used to distinguish voxels in the LV from those in the myocardial wall. The ESV and EDV of the LV were obtained from the corresponding frames of the GBP image. A good linear correlation was found between the LVEFs obtained by the 2 methods of LVG and GBP PET in 20 patients (Fig. 4A: r = 0.94; P < 0.0001). The mean difference of the 2 LVEFs in the Bland- Altman plot was −1.62% ± 5.36% (Fig. 4B), which was not significantly different from 0%. The mean values for the EFNH3, EFCO, and LVEF obtained from LVG (EFLVG) in the 20 patients are shown in Table 1. The LVEFs obtained from GBP PET and LVG were very similar, and no significant difference was observed between the 2 methods in either patient group. However, gated perfusion PET with pFAST underestimated the LVEF, especially in patients with a perfusion defect. The EFNH3 in the group with a defect was significantly lower than the EFCO or EFLVG, although no significant difference was found among the 3 methods for patients without any defect.

Images of gated 13NH3 PET in 3D mode of pFAST (A) and of GBP PET in 2D mode (B). Ratio of volumes in end-systolic phase (red part) and end-diastolic phase (meshed frame) provides LVEF. In GBP imaging, right and left ventricles (RV and LV) are clearly separated by septal myocardial wall. Bitmap images (pink transparent areas) were generated on each short-axis slice in end-diastolic and end-systolic phases of GBP PET. ANT = anterior; LAT = lateral; INF = inferior.

(A) Correlation of LVEF obtained from LVG and GBP PET (C15O) in 20 patients who underwent both studies. LVG and GBP PET show excellent linear correlation regardless of whether defect was (□) or was not (•) on perfusion image. Dashed line is line of identity. (B) Bland-Altman plot shows no significant degree of systematic measurement bias between 2 methods. Lines indicate mean and mean ± 2 SD.
Comparison Between LVEF Obtained Using LVG and Gated PET
The LV volumes (ESV and EDV) obtained from pFAST were overestimated compared with those obtained from GBP PET in all subject groups (Table 2). However, the EFNH3 and EFCO were consistent with each other in healthy volunteers. The 2 LVEFs obtained from gated PET scans were well correlated linearly when all subjects’ data were plotted (Fig. 5), although a slight underestimation was observed in the LVEF of pFAST (EFNH3 = 0.97 · EFCO − 2.94; r = 0.87; P < 0.0001). The Bland-Altman plot showed a mean difference of −4.58% ± 7.49%, which was significantly biased from 0% (P < 0.001). Subjects without a perfusion defect in the cardiac wall (6 healthy volunteers and 15 patients) showed a good linear correlation, and the LVEF difference between the 2 methods was not significant (EFNH3 = 58% ± 12% vs. EFCO = 61% ± 10%). However, patients with a perfusion defect showed underestimation of the LVEF when it was calculated with pFAST compared with that obtained from GBP images, and the difference was significant (EFNH3 = 39% ± 11% vs. EFCO = 45% ± 11%; P < 0.001; paired t test). The Bland-Altman plot between EFNH3 and EFCO also showed no systematic bias from 0% in subjects with no perfusion defect, although patients with a perfusion defect showed a significant bias from 0% (Fig. 5B).
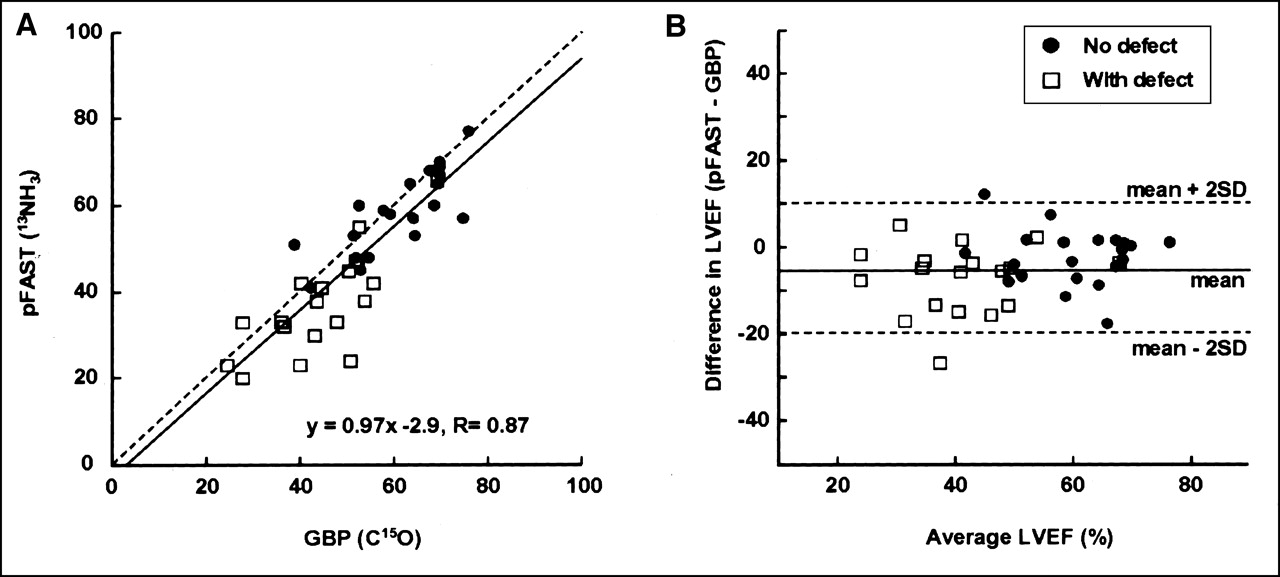
(A) Correlation of LVEF obtained from GBP PET (C15O) and pFAST (13NH3 PET) in all subjects (n = 40). LVEF values from GBP and pFAST correlate well, although there was slight underestimation of LVEF with pFAST, and stronger tendency for underestimation was observed in patients with defect (□) compared with patients without defect (•). Dashed line is line of identity. (B) Bland-Altman plot also shows underestimation of LVEF by pFAST compared with GBP by −4.58% ± 7.49%. Lines indicate mean and mean ± 2 SD.
LVEF, ESV, and EDV Obtained Using Different Methods
DISCUSSION
The new procedure evaluated in this study, using a single dose of 13NH3 and PET, can be used to determine simultaneously myocardial perfusion and LV function in 15 min. MBF and cardiac function are considered to be important for evaluating the prognosis of patients with coronary artery disease (CAD) (2–4,22). The relatively short half-life of 13NH3 would enable quantitative, repetitive measurement of the 2 parameters with a 1-h interval with or without stress (13,15); therefore, this is a promising procedure for patients with CAD in variable phases. The advantage of 13NH3 PET for perfusion measurement is that an additional scan is not required to correct for blood-pool radioactivity, which is needed on H215O PET scans (17). Furthermore, the longer half-life of 13NH3 than that of H215O enables one to obtain additional functional images with gated PET. Simultaneous evaluation of multiple parameters would provide a great benefit for patients (23), and this method using PET can measure quantitatively MBF and myocardial function.
MBF calculated pixel by pixel for healthy volunteers showed a normal flow range in the resting condition as determined by 13NH3 PET and the graphic plotting method (13,16,24). The regional values of MBF in patients were in good accordance with the severity of their disease. Pixel-by-pixel image generation based on the graphic plotting method seems appropriate for quantitative MBF evaluation, because perfusion images depicted as quantitative values are useful for clinical assessment and can be used easily to compare regional values with normal MBF (3,16). To maintain a constant rate of tracer infusion, the automated tracer injector is ideal for obtaining a precise influx rate and accurate graphic plotting.
The EFNH3 was well correlated with the EFCO in healthy volunteers and patients without a defect in the cardiac wall. In addition, the EFLVG and the EFCO showed an excellent correlation in 20 patients who underwent both studies. Thus, the consistency between the EFNH3 and the EFCO indicates that gated 13NH3 PET can measure LVEF in good accordance with LVG. The method for determining the blood volume inside the LV with GBP PET was a manual method using a threshold of 25% of maximal radioactivity. This method may have provided more accurate values of the ESV and EDV than automated methods (8). 13NH3 PET and pFAST overestimated the ESV and EDV in all subject groups compared with GBP PET. The algorithm of pFAST estimated the LV volumes using the midpoint of tracer accumulation in the myocardial tissue and mathematic calculation (10). This algorithm for calculation of the endocardial surface may tend to overestimate the LV volume. Nakajima et al. (11) reported the accuracy of the LVEF and EDV measured by gated myocardial perfusion SPECT and 4 different software programs in comparison with the values measured using GBP in 30 patients. Their results using pFAST were consistent with those of our study—that is, overestimation of ventricular volume and no significant difference of the LVEF compared with the GBP images. The ratio of the true volume and the volume estimated using pFAST is almost the same in the end-systolic and end-diastolic phases, which should lead to a consistent value for the LVEF compared with that obtained by GBP imaging. pFAST was used in this study because it was the only software applicable to our PET system and file format. Three of the 4 software programs compared in the study of Nakajima et al. showed 5%–10% mean differences of the LVEF compared with the GBP results, and pFAST showed the smallest difference in the Bland-Altman plot (11). The mean difference (EFNH3 − EFCO) of −4.58% ± 7.49% in this study was smaller than the differences obtained using the other 3 software programs (11), suggesting that pFAST is an appropriate program for measuring the LVEF. As Nakajima et al. reported, pFAST provides an LVEF that corresponds to that obtained using GBP PET or LVG in subjects without a perfusion defect, although it tends to overestimate the LV volume.
The EFNH3 underestimated cardiac function in patients with a perfusion defect, which is also consistent with the report of Nakajima et al. (11). The difference between the EFNH3 and the EFCO in those patients was significant, although subjects without a defect showed no significant difference between the 2 LVEFs. To evaluate cardiac function and LV volume in patients with CAD, the differences among the methods would be crucial. Sharir et al. (4) defined a threshold of LVEF < 45%, ESV 70 mL, and EDV 120 mL as related to a high mortality rate. Several other studies have also shown the importance of the LV volume. White et al. (25) reported that the ESV is the primary predictor of survival after myocardial infarction and has greater predictive value than the LVEF or the EDV. Borow et al. (2) concluded that preoperative ESV could identify patients at high risk for perioperative cardiac death. Overestimation of the LV volume and underestimation of the LVEF with pFAST may require a correction for measurement of accurate values. However, if the same tendency is generally observed among subjects, the estimated values of parameters might be sufficient for clinical use. Our findings suggest that the equation EFNH3 = 0.97 · EFCO −2.94 can estimate the LVEF (EFCO) from the EFNH3 more accurately when using pFAST (Fig. 4). However, when using different software programs for calculation of the LVEF and the LV volume, appropriate corrections should be applied for each program with different algorithms and properties (11).
Another option for precisely evaluating the LV volume with PET is to obtain an additional GBP scan with C15O before obtaining the 13NH3 PET scan. GBP PET is more reliable for measuring the LV volume and the LVEF than gated perfusion images, especially in patients with a perfusion defect (Table 2). The image can be depicted in the 3D mode, which is an advantage of GBP PET compared with LVG. Three-dimensional GBP images that can be observed from multiple angles are very useful for clinical evaluation of cardiac function and wall motion. The only disadvantage of this 3D GBP tomography is its limited spatial and temporal resolution compared with that of LVG (22). GBP tomography can provide additional information about right ventricular (RV) function. Determination of RV function is reported to be important for assessing the timing of surgery in mitral valve regurgitation (26). GBP PET would be ideal for evaluating patients in whom precise measurement of the LV and RV volumes is needed.
CONCLUSION
Gated PET acquisition accompanied by dynamic PET scanning with a single dose of 13NH3 is a promising method for clinical studies to evaluate simultaneously MBF and cardiac function. However, in patients with a perfusion defect in the myocardial wall, the EFNH3 showed a significant underestimation compared with the EFCO obtained from GBP imaging. Additional GBP PET studies will provide more accurate information about cardiac function and the LV volume, especially in patients with a perfusion defect.
Acknowledgments
The authors thank Hidekazu Matsugi, Kiyomi Kato, and other staff of the PET Unit (Research Institute, Shiga Medical Center) for technical assistance. The authors also appreciate the doctors in the Department of Cardiology and Yoshiharu Iwadate, Shigeru Tanaka, and Tadashi Miyagawa in the Department of Radiology (Shiga Medical Center) for clinical assistance.
Footnotes
Received Nov. 20, 2001; revision accepted Apr. 19, 2002.
For correspondence or reprints contact: Hidehiko Okazawa, MD, PhD, PET Unit, Research Institute, Shiga Medical Center, 5-4-30 Moriyama, Moriyama-shi, Shiga, 524-8524, Japan.
E-mail: okazawa{at}shigamed.moriyama.shiga.jp
REFERENCES
In this issue


Jump to section
Related Articles
Cited By...
- Absolute Quantification of Myocardial Blood Flow with 13N-Ammonia and 3-Dimensional PET
- Gated Cardiac 13N-NH3 PET for Assessment of Left Ventricular Volumes, Mass, and Ejection Fraction: Comparison with Electrocardiography-Gated 18F-FDG PET
- Validation of QGS and 4D-MSPECT for Quantification of Left Ventricular Volumes and Ejection Fraction from Gated 18F-FDG PET: Comparison with Cardiac MRI