


Abstract
PET and 11C-raclopride have been used to assess dopamine activity in vivo using a paradigm that involved d-amphetamine (AMPH)-induced endogenous dopamine release that led to reductions (relative to baseline) in the 11C-raclopride-specific binding parameter (binding potential). A common assumption in bolus injection PET studies of this type is that cerebral blood flow (CBF) does not vary during the scan. The goal of this work was to examine the effect of AMPH administration on sequential PET measures of CBF. Methods: Eight dynamic H215O PET scans were acquired with arterial blood sampling in 6 baboons: 4 scans before AMPH (over 60 min) and 4 scans after AMPH (over 60 min) (0.6 mg/kg AMPH). Magnetic resonance images (coregistered to PET) were used to define regions of interest that included cortex, striatum (including subregions), and cerebellum. Data were analyzed using a 1-tissue compartment model. CBF was assessed through K1 (mL/mL/min). Results: Temporal patterns of the CBF alterations were similar across regions for each baboon. For 5 of 6 baboons, a general pattern of an initial increase in K1 was observed after AMPH that gradually declined toward baseline, after minimizing anesthesia-induced variability in the in vivo measures. Although these alterations after AMPH were statistically significant in particular subcortical regions and cerebellum, such changes would not likely influence measures of 11C-raclopride binding potential to a significant extent. Conclusion: These data support previous PET studies for which constant blood flow was assumed during the bolus PET 11C-raclopride/AMPH experiment across striatal subregions, while underscoring the importance of considering effects of anesthesia when interpreting in vivo imaging parameters.
The dopaminergic system is involved in modulating cognitive processes and behavioral reinforcement (1,2), and dysfunction of this system appears to play major roles in neuropsychiatric and neurodegenerative diseases, including schizophrenia (3) and Parkinson’s disease (4). Techniques using PET and SPECT have been developed to assess dopaminergic function in the living human. The common experimental paradigm is to infer dopamine activity level through reductions in the binding potential of dopamine receptor antagonists, such as 11C-raclopride or 123I-IBZM ((S)-(−)-N-[(1-ethyl-2-pyrrolidinyl)methyl]-2-hydroxy-3- 123I-iodo-6-methoxy-benzamide), that result after administration of d-amphetamine (AMPH) or agents that induce endogenous dopamine release (5). These in vivo experiments were a natural extension of early studies performed on rats, which showed that subcutaneous AMPH administration (0.5–5 mg/kg) increased extracellular dopamine concentrations up to 20- to 40-fold in the striatum within 20–40 min after AMPH (6,7).
Neuroimaging studies of dopamine activity conducted in humans and animals have yielded reductions in radiotracer binding after AMPH (≤1 mg/kg) that exceeded the test-retest reliability of the binding parameters (∼10%). These investigations were conducted after the administration of radiotracer by bolus injection (nonequilibrium studies) or by bolus injection + constant infusion ([B/I] equilibrium studies) of the radiotracer, as reviewed recently (5). The B/I method requires that constant radioactivity levels be established, whereas the bolus method does not (8). These types of studies focused primarily on the striatal or basal ganglia regions of the brain (caudate and putamen) as well as the cerebellum.
Improvements in the spatial resolution of PET scanners and in the ability to perform robust image registration between functional PET and anatomic MRI data (9) have allowed neuroimaging researchers to examine dopamine activity in subregions of the striatum. Recently, Drevets et al. (10) reported that AMPH-induced dopamine release was greater in the anteroventral striatum than in the dorsal caudate, in baboons, using the bolus PET 11C-raclopride/AMPH paradigm (AMPH, 0.3–1.0 mg/kg). This work included simulation studies that served to validate the methodology used to assess dopamine activity in small adjacent regions of the caudate and putamen (10,11). This methodology was subsequently extended to humans to show a preferential sensitivity of the ventral striatum to AMPH-induced dopamine release and a positive correlation between the magnitude of ventral striatal dopamine release and the hedonic response to AMPH (12).
Validation studies of the bolus and B/I methodology have provided important contributions to this area of research (5,8,13,14). A comparison of bolus and B/I PET 11C-raclopride/AMPH studies in monkeys (0.4 mg/kg AMPH) yielded good agreement between baseline 11C-raclopride distribution volume (DV) values determined by the 2 methods; after AMPH, reductions in binding of 22%–42% for bolus studies and 19% ± 16% for B/I studies were observed (8).
One concern for bolus studies has been the extent to which alterations in cerebral blood flow (CBF) during the PET scan could impact the in vivo assessment of dopamine activity. Logan et al. (14) performed PET studies and computer simulations to examine the effects of CBF changes on 11C-raclopride-specific binding measures (e.g., DV and DV ratio [DVratio]). Elevation and reduction of the partial pressure of CO2 (Pco2) level (30%–40%) led to contrary changes in the 11C-raclopride DVratio (as large as 14%) in anesthetized baboons (14). Using models that explicitly incorporated CBF, computer simulations revealed no variation in DV if CBF was constant over the study, but DV variations were found with large fluctuations in flow. It was noted (14) that the simulations were performed under the assumption that CBF changes did not alter dopamine levels, although transient CBF reductions have increased extracellular dopamine in in vivo microdialysis rat studies (15).
The goal of this work was to use the bolus injection PET methodology and H215O as the radiotracer to quantify the effect of AMPH on CBF in nonhuman primates. In this study, sequential PET studies were performed on baboons at baseline (4 scans over 60 min) and after AMPH administration (4 scans over 60 min). CBF was measured in multiple brain regions, including striatal subregions (e.g., dorsal caudate, ventral putamen, anteroventral striatum).
MATERIALS AND METHODS
Baboons
Six baboons (B1–B6; Papio anubis) were studied (3 male, 3 female; weight, 16–31 kg; mean age, 9 ± 3 y) (Table 1). The animal studies were performed under the approval of the local Institutional Animal Care and Use Committee.
Levels of Ketamine and Isoflurane Anesthesia Before and After AMPH Administration
Anesthesia
Before the PET study, ketamine (10–15 mg/kg) and atropine (1 mg) were administered intramuscularly to the baboons to anesthetize the animals and to control the heart rate. Pancuronium bromide (0.01–0.06 mg/kg/h) was administered intravenously, as needed (on the basis of muscle twitch responses to electrical stimulation), to keep the animals immobilized during the study. Baboons were maintained on isoflurane anesthesia (Table 1) and medical air USP, while expired CO2, mean arterial blood pressure (MAP), and heart rate were monitored. As a result of the decreasing effectiveness of ketamine during the period before AMPH administration, the isoflurane dose was increased to maintain a MAP between 90 and 100 mm Hg during the period before AMPH. The isoflurane dose was constant during the H215O studies after AMPH. The end-tidal Pco2 value was monitored continuously, and the partial pressure was maintained at 35–40 mm Hg throughout the experimental time period (before and after AMPH). The body temperature of the baboons was regulated and monitored using a heating blanket (Gaymar, Orchard Park, NY) and temperature regulator (Yellow Springs Instruments, Yellow Springs, OH).
MRI
For each baboon, MRI was performed on a 1.5-T scanner (Signa; GE Medical Systems, Milwaukee, WI) using a standard head coil. After obtaining a brief scout, T1-weighted sagittal image, a volumetric spoiled gradient recalled (SPGR) sequence was acquired in the coronal plane (echo time [TE], 5; repetition time [TR], 24; flip angle, 40°; section thickness, 1.5 mm; number of excitations [NEX], 2; field of view [FOV], 12 cm; image matrix, 256 × 224 pixels). For baboon B5, an SPGR was not available and T1-weighted MR image (TE, 18; TR, 400; section thickness, 3 mm/0-mm intersection gap; NEX, 1; FOV, 15 cm; image matrix, 256 × 256 pixels) data were obtained. MR data were transferred to the PET Facility over the electronic network.
PET
PET data were acquired on an ECAT HR+ scanner (Siemens/CTI, Knoxville, TN) in 3-dimensional (3D) imaging mode (63 parallel planes): axial FOV, 15.2 cm; in-plane resolution, 4.1 mm full width at half maximum; slice thickness, 2.4 mm. A model-based correction was applied to account for a 35% 3D scatter fraction (16), and the scanner gantry was equipped with a Neuro-insert (CTI PET Systems, Knoxville, TN) to reduce the contribution of scattered photon events (17). Images were reconstructed with a Hanning filter (cutoff, Nyquist), resulting in a final reconstructed image resolution of 7.1 mm (transverse) and 6.7 mm (axial) (10).
The head of the anesthetized baboon was immobilized and secured within a head-holder apparatus that was attached to the scanner table. For each H215O study, 444 MBq (12 mCi) were injected in 5–7 mL of saline as a rapid bolus using an automated injector system with the simultaneous initiation of arterial blood sampling and a 4-min dynamic PET scan (23 frames: 10 × 3 s, 3 × 10 s, 4 × 15 s, and 6 × 20 s). The arterial blood data (input function) were collected over 4.2 min using a Siemens Liquid Activity Monitoring System (Masterflex peristalsis pump) that withdraws blood at a rate of 6 mL/min and detects radioactive events with dual 50 × 25 mm Bi4Ge3O12 scintillation crystals (efficiency, 14%). At the conclusion of each arterial blood collection, the peristalsis pump was reversed and the blood was pumped back into the animal.
Eight sequential H215O PET scans were obtained as shown in Figure 1. The scans were acquired at ∼20-min intervals with the exception of baboon B1, for which scans were acquired 15 min apart. The first 4 H215O scans (injections 1–4) were obtained before AMPH administration (0 and every 20 min over 60 min). Approximately 15 min after the fourth injection, AMPH (0.6 mg/kg) was administered over 2 min (18). Five minutes after the start of the AMPH injection, the first H215O study (after AMPH) was performed, and additional H215O scans were acquired at 20-min intervals. Four H215O scans were obtained after AMPH (injections 5–8).
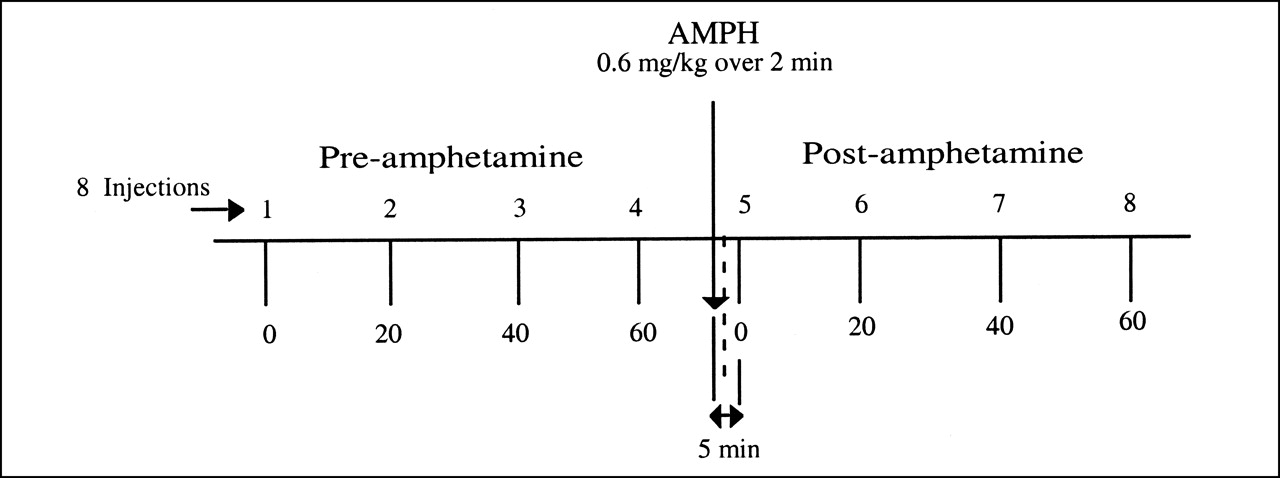
Experimental paradigm. Schematic diagram of experimental sequence depicting 8 H215O PET studies that were conducted for each baboon. Scans were obtained before and after AMPH administration to sequentially assess CBF. Four baseline H215O studies were performed approximately every 20 min over 60-min period. AMPH then was administered over 2 min (0.6 mg/kg). H215O studies after AMPH began 5 min after start of AMPH injection (4 studies over 60-min period).
The dose of isoflurane anesthesia varied across the PET studies before AMPH depending on the mass of the baboon and the time of ketamine injection, although isoflurane concentrations were constant during a given PET scan interval and across all sequential PET studies after AMPH (Table 1). A relative measure of the MAP (rMAP) was calculated to examine alterations in the MAP across the sequential H215O PET studies. The rMAP values were computed as the ratio of the individual MAP values to the first MAP measurement of the 8-injection session.
Data Analysis
MR data were coregistered to the PET data using an automated algorithm for image alignment and reslicing (9,19). The 23 frames of each PET image were summed over the 4-min period to yield 8 summed PET images. After centering of the first H215O PET image before AMPH, the remaining summed images (injections 2–8) were aligned to the first centered image. The MR image data were coregistered with the first, summed and centered, H215O PET image before AMPH and resliced to yield MR images in the same spatial orientation as the summed PET scans.
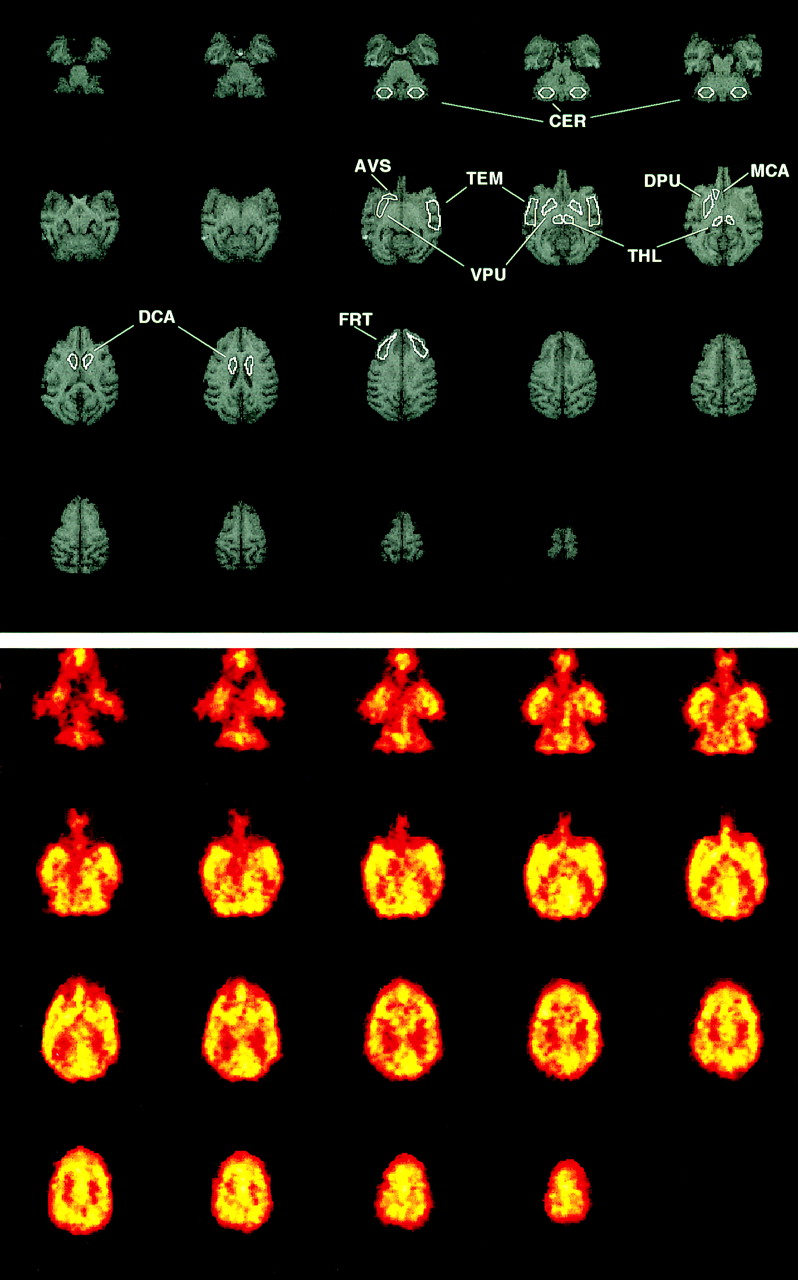
Regions of interest (ROIs) were then drawn on the coregistered MR images (Fig. 2) and applied to the dynamic PET image data to generate time-activity data for the frontal ([FRT] dorsal lateral prefrontal cortex) and temporal (TEM) cortices, thalamus (THL), striatum (STR), and cerebellum (CER). The striatal ROI was an average of caudate (CAU) and putamen (PUT), for which the following subregions were also studied: dorsal caudate (DCA), middle caudate (MCA), dorsal putamen (DPU), ventral putamen (VPU). Also included in the striatal average was the anteroventral striatum (AVS) (10). The ROIs were created using Imagetool software (CTI PET Systems). The PET time-activity data were created using an internally developed interactive data language (Research Systems, Inc., Boulder, CO) routine and correspond to left and right region averages. The PET data were converted to units of kBq/mL (μCi/mL) using a phantom-based calibration factor.

MRI and H215O PET images of baboon brain. (Top) Examples of MRI data and ROIs generated from dorsal (last row) to ventral (first row) aspect of brain: FRT, caudate (DCA, MCA, and DPU), THL, TEM, putamen (DPU, VPU), AVS, and CER. (Bottom) Baseline (before AMPH) PET image data (summed over 4-min scan interval) coregistered to MRI data shown above. ROIs determined on MR images were used to generate regional time-activity curves from dynamic H215O PET data.
The H215O data were analyzed using a 1-tissue compartment model that was based on the methods described by Kety (20):
 Eq. 1 where Ctissue and Ca represent the concentrations of H215O in brain and arterial blood, respectively. The model parameters correspond to the clearance of water from blood to brain (K1, mL/mL/min) and brain efflux (k2, min-1). Arterial input function timing delays (Δt) were accounted for on a regional basis (21). Therefore, 3 parameters were estimated for each time-activity curve (K1, k2, Δt) using an iterative least-squares curve-fitting technique (22,23) and Marquardt minimization (24). No correction was made for input function dispersion or for Pco2 (which was not expected to vary between studies before and after AMPH). A global K1 value also was determined, for each injection, on the basis of a weighted average of FRT, TEM, STR, CER, and THL K1 values (weighted by number of pixels in each ROI).
In this work, K1 was assumed to be equivalent to blood flow and the extraction of H215O was assumed to be unity. In addition, the impact of anesthesia and AMPH on vascular permeability was assumed to be negligible. Therefore, alterations in the H215O K1 value were interpreted as alterations in blood flow.
Test-retest variability in K1 was determined from the H215O PET studies acquired after injections 3 and 4 before AMPH administration. The data from injections 1 and 2 were not included in this determination to minimize the influence of ketamine and variations in isoflurane level as well as any residual influences of atropine. The third injection of H215O was administered an average of 116 ± 29 min after ketamine administration (Table 1). A test-retest percentage difference (T − R [%]) value was calculated between the K1 values of injections 3 and 4 (relative to injection 3):
 Eq. 2
Eq. 2
The magnitude of the test-retest variability was assessed as the average of the absolute T − R (%) values.
The impact of AMPH on CBF was assessed by examining the percentage difference between each K1 value for injections 5–8 relative to the average K1 value for injections 3 and 4. The variation in K1 across a given condition (before or after AMPH) was assessed through the coefficient of variation ([CV (%)] = [SD/mean] ×100).
The statistical significance of the K1 alterations was tested using the Wilcoxon signed rank test (α = 0.05; exact inference) (25). A nonparametric test was used (rather than ANOVA) because the central limit theorem was deemed inapplicable as a result of the small sample size and violation of the assumption of normality. The Wilcoxon test was used for 2 comparisons. First, the AMPH-induced alterations in K1 were assessed by comparing the average of the K1 values (injections 3 and 4) before AMPH administration with the average of the early K1 values (injections 5 and 6) after AMPH. Second, alterations in K1 during the period (1 h) after AMPH administration were tested by comparing the average of the early K1 values (injections 5 and 6) after AMPH with the average of the late K1 values (injections 7 and 8) after AMPH. No correction for multiple comparisons was performed.
In view of the small sample, the statistical power of the Wilcoxon test (n, 5/6 baboons; α = 0.05; 2-sided alternative) was explored for K1 alterations of 30% (assuming normality). Comparison of K1 values before and after AMPH yielded a power of <0.2 in the THL and of ∼0.5 in the cortex, CAU, and AVS, with greater power for the PUT (0.6–0.7) and CER (0.9). The data after AMPH were less variable (compared with data before AMPH), and K1 alterations (early vs. late) after AMPH yielded a power of 0.3–0.7 in the cortex and THL and 0.8 in the CAU, AVS, PUT, and CER.
RESULTS
Figure 2 shows examples of MR and PET image data that were acquired in the same baboon. The top set of images shows examples of the ROIs generated from the dorsal to the ventral aspect of the brain. The bottom set of images shows examples of the baseline H215O PET image data that were coregistered to the MR data. The PET images were summed over the 4-min scan interval. Figure 3 shows examples of the arterial blood input function data (Figs. 3A and 3B) and striatal PET time-activity curves (Figs. 3C and 3D) measured after each injection of H215O (4 before and 4 after AMPH administration) in baboon B2. Also shown in Figure 3 are the striatal curves and the corresponding 1-tissue compartment model curve fits that described the H215O data well. The average SEs in K1 (across regions) ranged from 3% to 6% with CVs of 20%–40%. In general, the SEs associated with all parameter estimates were <15%.

Sequential H215O input functions and striatal PET data (in kBq/mL [μCi/mL]). Graphs show examples of sequential arterial input functions (A and B) and striatal H215O PET data (C and D) measured at baseline (A, injections 1–4) and after AMPH (B, injections 5–8). Compartmental model fits (solid lines) are displayed with striatal data.
Table 2 lists the average baseline H215O K1 values that were measured after injection 3 in the 6 baboons. These average cortical values are consistent with those reported by Schumann et al. (26) for MAPs between 90 and 100 mm Hg, although greater interbaboon variability was observed in this study. Despite variability in the absolute values, the test-retest measure of intrababoon variability in K1 was modest across regions (Table 2). The largest variation was evident for the THL (16% ± 12%) and the smallest was observed for the summed CAU region (6% ± 4%). These variations may have been attributable to measurement variability, differences in ketamine and anesthesia effects at the time of H215O injections 3 and 4, and other nonspecific factors (Table 1).
Average Baseline H215O K1 Value and Regional Test-Retest (T − R [%]) Variability in Baboon
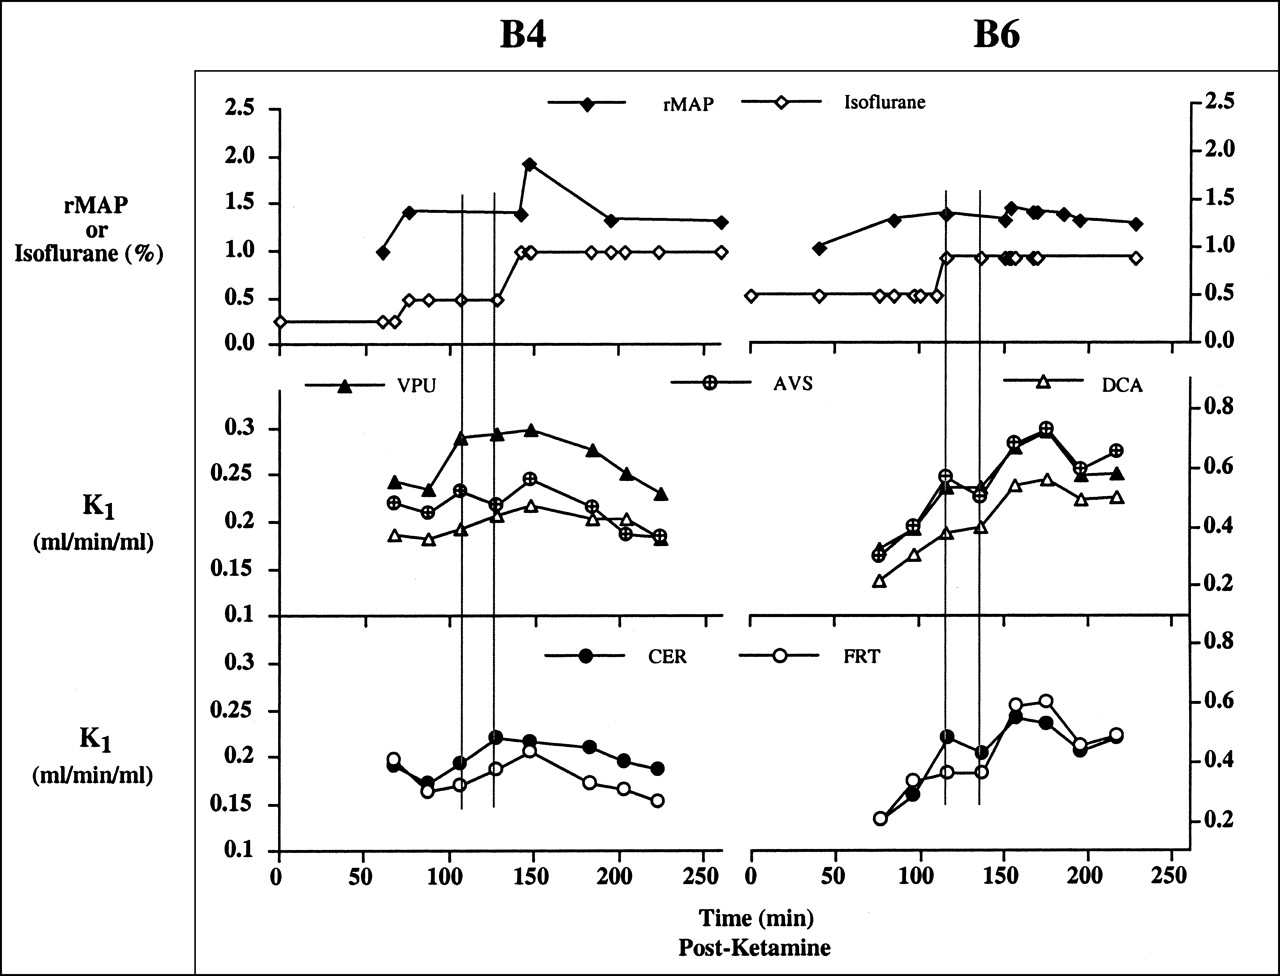
Figure 4 shows examples of sequential measures of rMAP and isoflurane levels (Fig. 4, top), as well as absolute H215O K1 values (Figs. 4, middle and bottom) that were measured in 2 baboons at various times throughout the 8-injection time period. The time scale for the graphs corresponds to the time after ketamine injection (Table 1). The baboon data appeared to show a general initial increase in K1 after AMPH administration that was followed by a decrease at later times. This is exemplified in Figure 4 by the data shown for baboon B4 (left graphs) and baboon B6 (right graphs). The individual changes in K1 after AMPH are listed for all baboons in Table 3. (Alterations in the K1 values after AMPH were determined relative to the average K1 value for injections 3 and 4.)

Graphs show examples of baboon B4 (left), for which CBF alterations were small compared with those of baboon B6 (right), with larger changes. Two vertical lines on graphs denote test-retest PET scans (injections 3 and 4) before AMPH administration. After AMPH, H215O K1 value increased to eventually decline at later times, a pattern evident for 5 of 6 baboons.
Individual and Mean (n = 5) Changes (%) in H215O K1 Values in Baboon After AMPH Administration*
Baboon B4 exhibited rMAP measures that reflected changes in isoflurane level and a modest initial response to AMPH (Fig. 4). With respect to time, the greatest increases in the K1 values after AMPH administration for baboon B4 generally occurred for injection 5 (∼7 min after AMPH), whereas the greatest decreases were observed for injection 8 (∼60 min after AMPH). The largest increase for baboon B4 was in the frontal cortex (15%), whereas changes in other regions were similar or well within the average test-retest variability. Variation across the 4 K1 values before AMPH for baboon B4 was small and this was thought to partly reflect the similar isoflurane doses during the period before AMPH (Table 1). Moderate variation noted for baboon B4, across regions, in the 4 K1 values after AMPH was greatest in the AVS (CV = 14%) and smallest in the CER (CV = 6%) (Fig. 4; Table 3).
Baboon B6 exhibited less variation in the rMAP value, a greater range and magnitude of K1 values, and a greater initial sensitivity to AMPH (relative to baboon B4). With respect to time, most regions of baboon B6 showed the greatest increase after injection 6 (∼27 min after AMPH injection). For baboon B6, all regions showed an increase in K1 after AMPH that was greatest in the THL (80%) and smallest in the CER (20%). Variation across the 4 K1 values before AMPH for baboon B6 was large and greatest for the CER (36%), and this was partly attributed to variations in the isoflurane doses before AMPH (Table 1). On the other hand, the magnitude of the variation in the K1 values after AMPH was similar to that observed for baboon B4, and this was greatest for the frontal cortex (CV = 13%).
For each baboon, a general temporal pattern of the K1 values was observed across regions. Five of 6 baboons (B1, B2, B4–B6) exhibited a general pattern of increased K1 after AMPH administration and an eventual decline in K1 at later times after AMPH injection (Table 3). However, baboon B3 exhibited a different temporal pattern of great initial increases in K1 that remained elevated throughout the period after AMPH (Table 3). The complete analysis of the data for baboon B3 was not possible as a result of missing data for injection 6 because of technical problems in the collection of the input function data. Therefore, the average changes in the K1 values after AMPH in Table 3 and the statistical results in Table 4 reflect data from only 5 baboons (B1, B2, B4–B6).
Wilcoxon P: H215O K1 Changes in Baboon (n = 5) After AMPH Administration*
The general temporal pattern, for the 5 baboons, of an increase in K1 after AMPH administration and an eventual decline at later times was associated with reductions after AMPH in input function height and delay (Δt). Comparisons of the input function height (average of injections 3 and 4) before AMPH with the average heights for injections 5 and 6 and injections 7 and 8 showed lower input function heights of 5%–6% after AMPH (across 5 baboons). The average differences in the input function curve areas, after AMPH, were only ∼1%. The input function delay values before AMPH (Δt = 0.20 ± 0.02 min) were generally greater than those after AMPH administration (Δt = 0.18 ± 0.04 min) but were similar overall (averages across regions and baboons; n = 5).
For the 5 baboons, the average increase in CBF, after injection 5, ranged from ∼26% in the THL to ∼10% in the PUT. After injection 6, the average increase ranged from ∼43% in the THL to ∼13% in the TEM. Examination of average K1 values by the Wilcoxon signed rank test did not detect significant differences using a 2-sided test, whereas significance was detected in some regions using a 1-sided test. Application of the 1-sided test was based on the observation of uniformity in the temporal response across the 5 baboons (initial K1 increase and subsequent decline after AMPH); the 1-sided test also provided greater statistical power.
For the initial alteration in K1 after AMPH administration (Table 4), significance was detected for the CAU, AVS, THL, and CER (P = 0.03) but not for cortical areas and the PUT (P < 0.05). With respect to alterations in K1 during the period after AMPH, significance was detected for the PUT, AVS, and CER (P = 0.03) but not for the cortical regions, CAU, and THL (P < 0.05). As described above, no correction was made for multiple comparisons.
Comparisons of the global K1 values before and after AMPH administration for the 5 baboons yielded significant differences (P = 0.03) for K1 before AMPH versus early K1 after AMPH but not for early K1 after AMPH versus late K1 after AMPH (P = 0.06). The global data indicated significance for the AMPH-induced increase in K1 but did not strongly support alterations in K1 over the time period after AMPH (Wilcoxon test, 1-sided).
DISCUSSION
The primary goal of this work was to examine temporal and regional variations in CBF that arise after the administration of AMPH in baboons and to assess whether significant variations in blood flow occur during a 1-h period after AMPH. The results of this study showed a general increase in CBF (∼15%–20% in striatal areas) after AMPH administration that gradually declined toward baseline values over 1 h for 5 of 6 baboons. The temporal pattern of change was consistent across regions, and these alterations reached statistical significance in particular subcortical regions and the CER.
An important aspect of these studies involved the assessment of physiologic response to AMPH in animals under the concomitant influence of atropine, ketamine, and isoflurane. The extent to which these agents altered CBF or interacted with the dopaminergic system during this study is unclear, although the acute effects of these agents were minimized by analyzing data that were acquired an average of ∼2 h after ketamine (and atropine) administration and by limiting the test-retest analyses to data for injections 3 and 4 when isoflurane levels were more constant (Table 1).
As recently summarized by Drevets et al. (10), atropine and ketamine may have dopamine-releasing properties (27,28). These agents and isoflurane indirectly and directly influence regional CBF (29–31). In our study, a large variation (36%) was noted across the cerebellar K1 values before AMPH administration for baboon B6. For this animal, the K1 values for injections 1 and 2 were increasing and appeared to plateau by injections 3 and 4. This variation was thought to partially reflect the influence of isoflurane, for which the dose was ∼2-fold less for injections 1 and 2 relative to that for injections 3 and 4 (Table 1; Fig. 4). Similarly, the large K1 values after AMPH for baboon B3 could have been associated with ketamine dose because this animal had the shortest time interval after ketamine administration before injection 3 (73 min). This work could have been improved by performing studies on more baboons to reduce variability in the outcome measures. The number of available baboons was small, and each was studied only once in an effort to acquire an independent sample.
Previous human and animal studies have yielded evidence of decreased and increased CBF after AMPH administration (0.25–5 mg/kg) (32–36), although the techniques vary greatly across these studies. One strength of our study was the fully dynamic quantitative PET approach that was applied on a sequential basis in the living baboon.
As recently reviewed, an advantage of applying a B/I paradigm to study the effect of AMPH on 11C-raclopride binding is that this equilibrium method is not affected by variations in CBF, whereas bolus analyses could potentially be influenced by such fluctuations (5,14). It has been noted that artifactual reductions in 11C-raclopride binding after AMPH administration may result, in bolus analyses, from time-varying CBF profiles that correspond to an initial decrease followed by an increase in CBF (5).
In this work, the Wilcoxon test indicated statistically significant initial increases and variations in flow (eventual decline toward baseline) after AMPH administration, for the subset of 5 baboons, in particular brain regions (Table 4). The extent to which such variations in CBF could affect measures of 11C-raclopride binding was appraised on the basis of the studies of Logan et al. (14) that assessed the impact of time-varying blood flow on bolus injection 11C-raclopride binding measures.
Previously, Logan et al. (14) found that hyperventilation led to reduced values of 11C-raclopride K1 and DV but negligible change in DVratio (in human). Logan et al. also performed computer simulations that included a model for which the relationship between blood flow (F [mL/g/min]) and K1 (mL/g/min) was expressed as:
 Eq. 3
Eq. 3
In Equation 3, the extraction of the radioligand (Eo) depends on its permeability for the capillary wall (P [cm/min]) and the surface area of the capillary (S [cm2/g]), where PS1 is from plasma to tissue (mL/g/min). In the simulations (based on human parameters), flow was varied linearly over 0.2–0.8 mL/g/min while generating 11C-raclopride (PS1, 0.13 mL/g/min) and 11C-cocaine (PS1, 0.45 mL/g/min) PET data. Essentially no change was found in the 11C-raclopride DV whether flow linearly increased or decreased, whereas a larger PS value led to a 5% increase in the 11C-cocaine DV if flow was decreased during the simulation (−8% if flow increased).
The range of flow values examined by Logan et al. (14) corresponded to H215O K1 values of 0.2–0.6 mL/mL/min (Eq. 3; H215O PS1 for baboon, 1.04 mL/g/min (37), allowing 1 g/mL tissue density) and were similar to those observed in our study. The largest individual early increases in the H215O K1 values (subset of 5 baboons) were approximately 95% and 45% in the THL and the STR, respectively. For a given baboon, the largest CV over the K1 values after AMPH administration was ∼20%. Overall, the findings suggest that the direction and magnitude of the CBF fluctuations observed in this study would have led to modest changes in the 11C-raclopride binding potential (DVratio − 1), even if AMPH administration had led to large increases in the PS value (38).
CONCLUSION
The results of this study on anesthetized baboons showed increased CBF after AMPH administration with an eventual decline at later times. The CBF alterations, in particular subcortical areas and the CER, were of statistical significance but were not likely to lead to artifactual reductions in 11C-raclopride binding potential measures after AMPH. This work supports previous studies for which constant blood flow was assumed during the bolus PET 11C-raclopride/AMPH (8,10,12) experiment in the examination of dopamine activity in striatal and substriatal areas. This study further underscores the significant role that anesthesia effects can play during these in vivo imaging studies.
Acknowledgments
The authors are very grateful to Angela Graves for her efforts in data preparation and processing and to the staff of the University of Pittsburgh Medical Center PET Facility for their assistance in conducting the MRI and PET studies. This work was supported by the Whitaker Foundation.
Footnotes
Received Sep. 21, 2001; revision accepted Apr. 19, 2002.
For correspondence or reprints contact: Julie C. Price, PhD, PET Facility, Department of Radiology, 200 Lothrop St., Room B938, Pittsburgh, PA 15213.
E-mail: price{at}pet.upmc.edu
REFERENCES
In this issue


Jump to section
Related Articles
Cited By...
- Relative 11C-PiB Delivery as a Proxy of Relative CBF: Quantitative Evaluation Using Single-Session 15O-Water and 11C-PiB PET
- Brain Imaging Findings Predict Blood Pressure Response to Pharmacological Treatment
- Cerebrovascular Support for Cognitive Processing in Hypertensive Patients Is Altered by Blood Pressure Treatment
- Reduced cerebral blood flow response and compensation among patients with untreated hypertension
- Mapping Dopamine Function in Primates Using Pharmacologic Magnetic Resonance Imaging