


Abstract
The role of quantitative 18F-FDG PET studies for the differentiation of benign and malignant bone lesions is still an open question. Methods: Our evaluation included 83 patients with 37 histologically proven malignancies and 46 benign lesions. Thirty-five of the 46 benign lesions were histologically confirmed. The 18F-FDG studies were accomplished as a dynamic series for 60 min. Evaluation of the 18F-FDG kinetics was performed using the following parameters: standardized uptake value (SUV), global influx (Ki), computation of the transport constants K1–k4 with consideration of the distribution volume (VB) according to a 2-tissue-compartment model, fractal dimension based on the box-counting procedure (parameter for the inhomogeneity of the tumors). Results: The mean SUV, the vascular fraction VB, K1, and k3 were higher in malignant tumors compared with benign lesions (t test; P < 0.05). Although the 18F-FDG SUV was helpful to differentiate benign and malignant tumors, there was some overlap, which limited the diagnostic accuracy. On the basis of the discriminant analysis, the SUV alone showed a sensitivity of only 54.05%, a specificity of 91.30%, and a diagnostic accuracy of 74.70%. The fractal dimension was superior and showed a sensitivity of 71.88%, a specificity of 81.58%, and an accuracy of 77.14%. The combination of SUV, fractal dimension, VB, K1–k4, and Ki revealed the best results with a sensitivity of 75.86%, a specificity of 97.22%, and an accuracy of 87.69%. Bayesian analysis showed true-positive results at the level of 0.8 for a low prevalence of disease (0.235) if the full kinetic data were used in the evaluation. Conclusion: 18F-FDG PET has a high specificity for the exclusion of a malignant bone tumor. Evaluation of the full 18F-FDG kinetics and the application of discriminant analysis are required and can be used prospectively to classify a bone lesion as malignant or benign.
Bone tumors are a heterogeneous group of tumors that all arise from bone tissue, which consists of cartilaginous, osteoid, and fibrous tissue and bone marrow elements. Each tissue can give rise to benign or malignant spindle cell tumors. The differentiation of benign and malignant intraosseous lesions can often be accomplished by means of conventional radiography, CT, and MRI. All of these morphologic methods are very important, particularly for the assessment of tumor location, form, size, and infiltration of the adjacent tissue. However, the radiographic appearance of many lesions is indeterminate, and final diagnosis may only be achieved using biopsy and histopathologic evaluation. PET with 18F-FDG has found increasing use in oncology because it allows functional imaging of viable tumor tissue (1). The use of 18F-FDG PET for the detection and monitoring of therapy in patients with musculoskeletal lesions has been reported (2–4). According to these studies, 18F-FDG PET can visualize bone tumors, indicate the grade of malignancy, and detect local recurrence. However, the impact of 18F-FDG PET on the diagnosis of bone lesions is still open because of the limited data. Another aspect is the impact of the prevalence of disease on the accuracy of the PET results, which was not evaluated in any of these studies and may explain the divergence of the data in the literature with respect to diagnostic accuracy. Furthermore, to our knowledge, no data are available about the improvement of the diagnostic accuracy provided by PET with respect to different levels of the prevalence of disease.
The purpose of this study was to assess whether dynamic quantitative 18F-FDG PET studies with noninvasive measurement of the input function, a dedicated data evaluation using the classical 2-tissue-compartment model, and a noncompartment approach can help to improve the differential diagnosis of malignant and benign bone lesions. In particular, we tried to identify those pharmacokinetic parameters of 18F-FDG that may be helpful for an accurate differentiation of malignant and benign bone lesions. Furthermore, we compared the semiquantitative analysis based on a single static measurement with the analysis of the full kinetic 18F-FDG data. In general, a diagnostic procedure should provide a high posterior probability of true-positive results at a low level of prior probability of disease. Because of the dependency of sensitivity and specificity on the prevalence of disease, we applied the Bayesian statistics to the data to assess the gain in information provided by PET.
MATERIALS AND METHODS
Patients
The evaluation included 83 patients with intraosseous lesions that were suggestive of malignancy. All patients were referred for PET with radiologic evidence of an intraosseous lesion without a major soft-tissue component and considered suggestive or indeterminate for malignancy. Preliminary diagnosis was based on clinical symptoms and radiologic examinations, including conventional radiography, CT, or MRI. All patients who were referred for PET had an inconclusive diagnosis of a bone tumor, and PET was performed to support the further diagnostic and therapeutic approach. The final diagnosis included the histologic data obtained from surgical specimens in 72 cases. Eleven benign lesions were confirmed by clinical follow-up for at least 6 mo after the 18F-FDG study. Most masses were located in the extremities (n = 64) but were also in the pelvic area (n = 11), in the thoracic region (n = 4), and in the abdomen (n = 4). Final diagnosis revealed 37 malignant bone tumors (23 primary, 9 recurrences, 5 metastases) and 46 benign lesions. Among the histologically confirmed malignant tumor masses were 9 osteosarcomas, 8 Ewing’s sarcomas, 8 giant cell tumors, 1 intraosseous hemangiosarcoma, 2 plasmocytomas, 5 bone metastases, 2 neuroectodermal tumors, 1 non-Hodgkin’s lymphoma of the bone, and 1 perspiration gland carcinoma of the feet. Giant cell tumors, originally termed benign, are now considered low-grade sarcomas. They have a high rate of local recurrence and malignant transformation. Therefore, we classified these tumors as malignant. Histologically confirmed benign lesions comprised 8 scars, 5 osteomyelitis, 4 enchondromas, 4 bone cysts, 2 fibromas, 2 ganglions, 2 osteitis, 1 bone necrosis, 1 bone hematoma, 1 eosinophilic granuloma, 1 osteochondroma, 1 tendopathy, 1 bone edema, 1 Paget’s disease, and 1 bone hemangioma. All patients with suspected local recurrence had a documented history of tumor surgery. The study was performed following the guidelines of the institutional review board.
Data Acquisition
Dynamic PET studies were performed after intravenous application of 300–370 MBq 18F-FDG for 60 min (10 frames of 1 min, 5 frames of 2 min, and 8 frames of 5 min). 18F-FDG was prepared according to the method of Toorongian et al. (5). All patients fasted for at least 4 h before PET. The blood glucose level was measured immediately before 18F-FDG application and was within the normal range in all patients.
A dedicated PET system (ECAT EXACT HR+; Siemens, Erlangen, Germany) based on the block detector technology with a craniocaudal field of view of 15.3 cm, operated in septa-extended mode (2-dimensional mode), was used for patient studies. The system allows the simultaneous acquisition of 63 transversal slices with a theoretic slice thickness of 2.4 mm. The system consists of 4 rings, and each of the rings has 72 bismuth germanate detector blocks. A single block detector is divided into an 8 × 8 matrix. The crystal size of a single detector element is 4.39 × 4.05 × 30 mm. Transmission scans for a total of 10 min were obtained with 3 rotating germanium pin sources before the first radionuclide application for the attenuation correction of the acquired emission tomographic images.
The PET data were transferred by file transfer protocol to a subnet server. A web—interface was used to start and distribute the reconstruction tasks on several computer systems, where the reconstruction programs were running in a semiparallel mode (6,7). All PET images were attenuation corrected and reconstructed using an iterative reconstruction algorithm (weighted least-square method, ordered subsets, 4 subsets, 6 iterations, 256 × 256 image matrix) running on Pentium platforms (Pentium III [600 MHz, double processor, 512-MB random access memory]) and Windows NT (Version 4.0 SP6; Microsoft, Redmond, WA).
Data Analysis
Evaluation of the dynamic PET data was performed using the software package PMod, provided by cooperation with the University of Zürich (Zürich, Switzerland) (8,9). Time—activity curves were created using volumes of interest (VOIs). A VOI consists of several regions of interest (ROIs) over the target area. Irregular ROIs were drawn manually. To compensate for possible patient motion during the acquisition time, the original ROIs were visually repositioned but not redrawn. In general, a detailed quantitative evaluation of tracer kinetics requires the use of compartment modeling. Patlak analysis and a 2-tissue-compartment model are standard methodologies for the quantification of dynamic 18F-FDG studies (10,11). For the basic analysis, we used the semiquantitative approach based on the calculation of a distribution value, for which the term “standardized uptake value” (SUV) was introduced by Strauss and Conti (1): SUV = tissue concentration (MBq/g)/(injected dose [MBq]/body weight [g]). The 55- to 60-min uptake value served for quantification of the 18F-FDG SUV data.
One problem in patient studies is the accurate measurement of the input function, which theoretically requires arterial blood sampling. However, the input function can be retrieved from the image data with good accuracy (12). We performed compartment analysis to gain more information about the tracer distribution. For the input function the mean value of the VOI data obtained from an arterial vessel was used. A vessel VOI consisted of at least 10 ROIs on sequential PET images. The input data were then fitted using a 3-exponential function to reduce noise. In patients with an abdominal or a thoracic lesion, the descending aorta was used for this purpose because the spillover from other organs is low and the descending aorta extends from the upper chest to the lower abdomen. The input function is generally a problem, particularly if the lesions are located in the extremities, where the vessel diameter is relatively small. For lesions located in the extremities (e.g., legs), we used a VOI consisting of at least 10 ROIs over the femoral artery or another arterial vessel, which was well delineated in the field of view. Eight of 37 tumors and 10 of 46 benign lesions were excluded from the final evaluation because of problems with the input function. Low counting rates and a relatively low increase of the 18F-FDG uptake in the vessel VOI in the early phase (up to 3 min after injection) were some of the problems. The recovery coefficient is 0.85 for a diameter of 8 mm and for the system described above. Partial-volume correction was used for small vessels (diameter < 8 mm) on the basis of phantom measurements of the recovery function. The diameter of the vessels was assessed by contrast-enhanced CT or MR images that were available for the PET study. The 18F-FDG influx (Ki) was calculated using the transport rates from the 2-tissue-compartment model according to the following formula: Ki = ([K1 × k3]/[k2 + k3]). The metabolic rate of glucose according to Patlak and Blasberg (10) was not calculated because of the high variation of λ. The transport constant K1 and the rate constants k2, k3, and k4 were calculated using a 2-tissue-compartment model based on a method implemented in the PMod software taking into account the vascular fraction (VB) within a VOI. Details of the applied compartment models are described elsewhere (9).
In addition to the compartment analysis, we used a noncompartment model based on the fractal dimension (13). As shown by other investigators, the fractal dimension is a parameter for the heterogeneity. It was recently shown that the fractal dimension is an appropriate procedure to describe the heterogeneity of blood flow in animal models (14). A Java-based module was implemented in the PMod software to calculate the fractal dimension for the time–activity data (15). The program is based on the box-counting method (13). The values of the fractal dimension vary from 0 to 2 and are a parameter for a deterministic or more chaotic distribution of the tracer activity. For this purpose, no input function is needed.
Statistical evaluation of the data was performed using the Statistica software package (Version 6.0; StatSoft Co., Hamburg, Germany) on a personal computer (Pentium III [600 MHz, double processor, 512-MB random access memory]) running with Windows NT (Version 4.0 SP6). Descriptive statistics and box—whiskers plots were used for the analysis of the data. The Student t test was applied to all evaluated parameters (SUV, VB, K1, k2, k3, k4, Ki, fractal dimension) to find out which parameters are significant for the differentiation of malignant and benign lesions. Differences were considered significant for P < 0.05. Discriminant analysis (DA) was used to determine the diagnostic accuracy of an 18F-FDG study using all evaluated parameters (SUV, VB, K1, k2, k3, k4, Ki, fractal dimension) with regard to the final histologic diagnosis. The Bayesian theorem was applied to the results to evaluate the information provided by PET with respect to different levels of the prevalence of disease (16). Details about the discriminant function and the Bayesian analysis are described in the Appendix.
RESULTS
Malignant bone tumors showed an enhanced 18F-FDG uptake (Fig. 1). However, visual evaluation generally was not sufficient for the diagnosis of a malignant tumor. An enhanced 18F-FDG uptake was suggestive of malignancy but could not exclude benign processes. Enhanced 18F-FDG uptake was noted not only in inflammatory lesions such as osteomyelitis and osteitis but also in an eosinophilic granuloma and a fibrous dysplasia, which showed high 18F-FDG uptake (Fig. 2), and, therefore, could not be differentiated from a malignant tumor. In contrast, 2 grade I osteosarcomas, a grade I Ewing’s sarcoma, and a neuroectodermal tumor did not show an enhanced 18F-FDG uptake (<1.1 SUV).

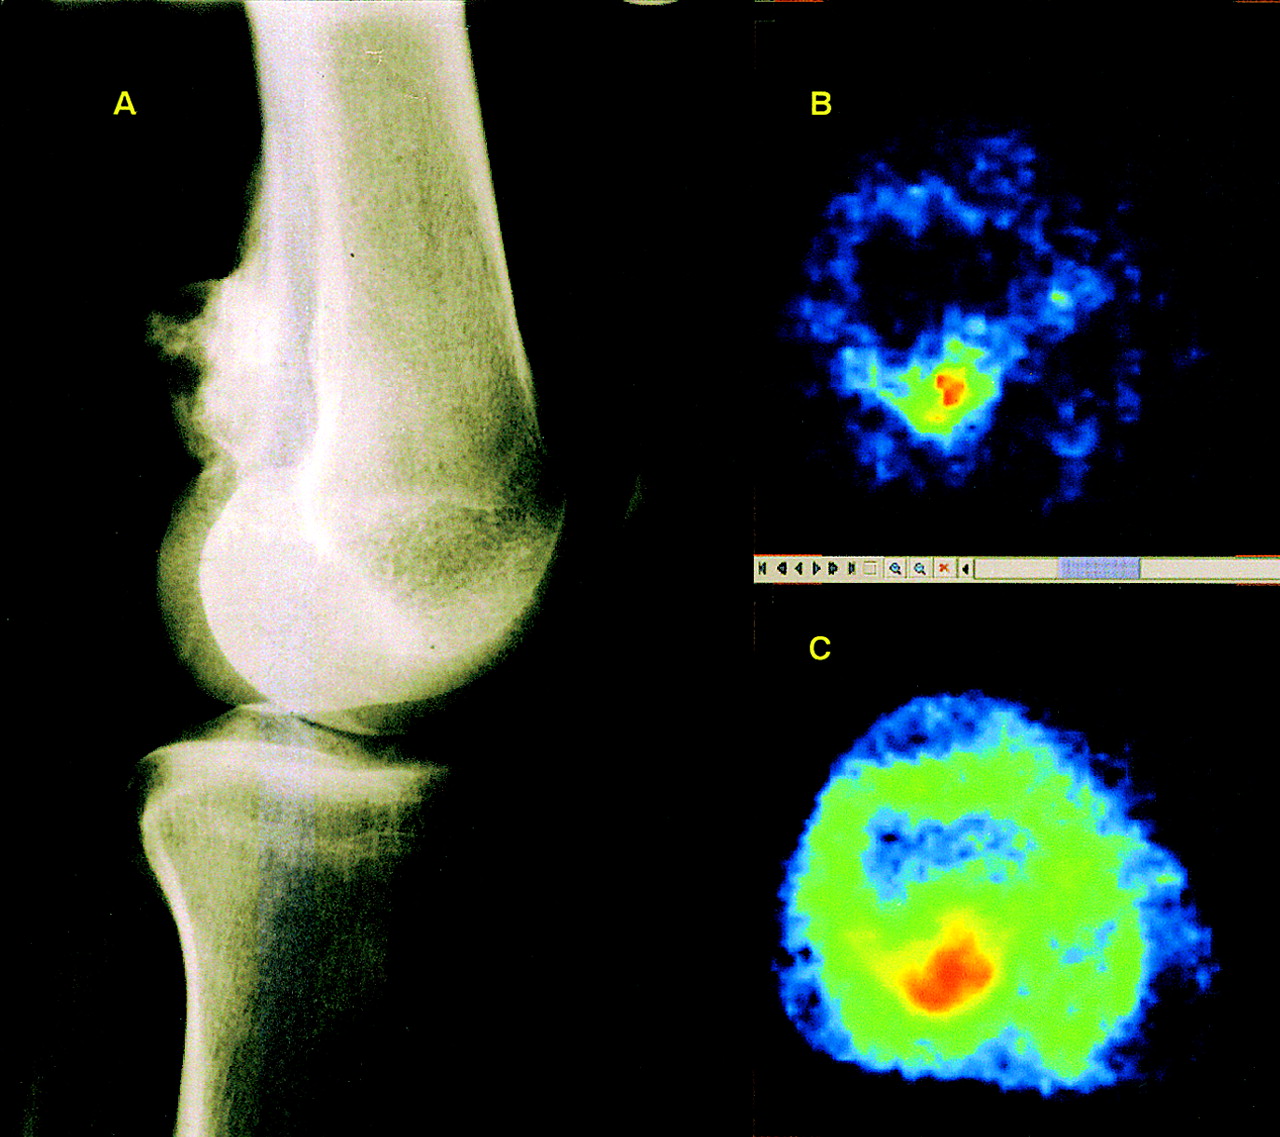
(A) Conventional radiographic image of left knee (lateral view) shows irregular osteoblastic mass dorsal of femur. (B) Transversal PET image (SUV image) of distal femur shows enhanced 18F-FDG uptake confined to femoral part of mass. (C) Parametric image of fractal dimension of image in B. Increased fractal dimension (red area) is indicative of chaotic 18F-FDG metabolism. Note that area of chaotic metabolism is larger than 18F-FDG uptake region on SUV image (B). Histologic examination revealed osteosarcoma.
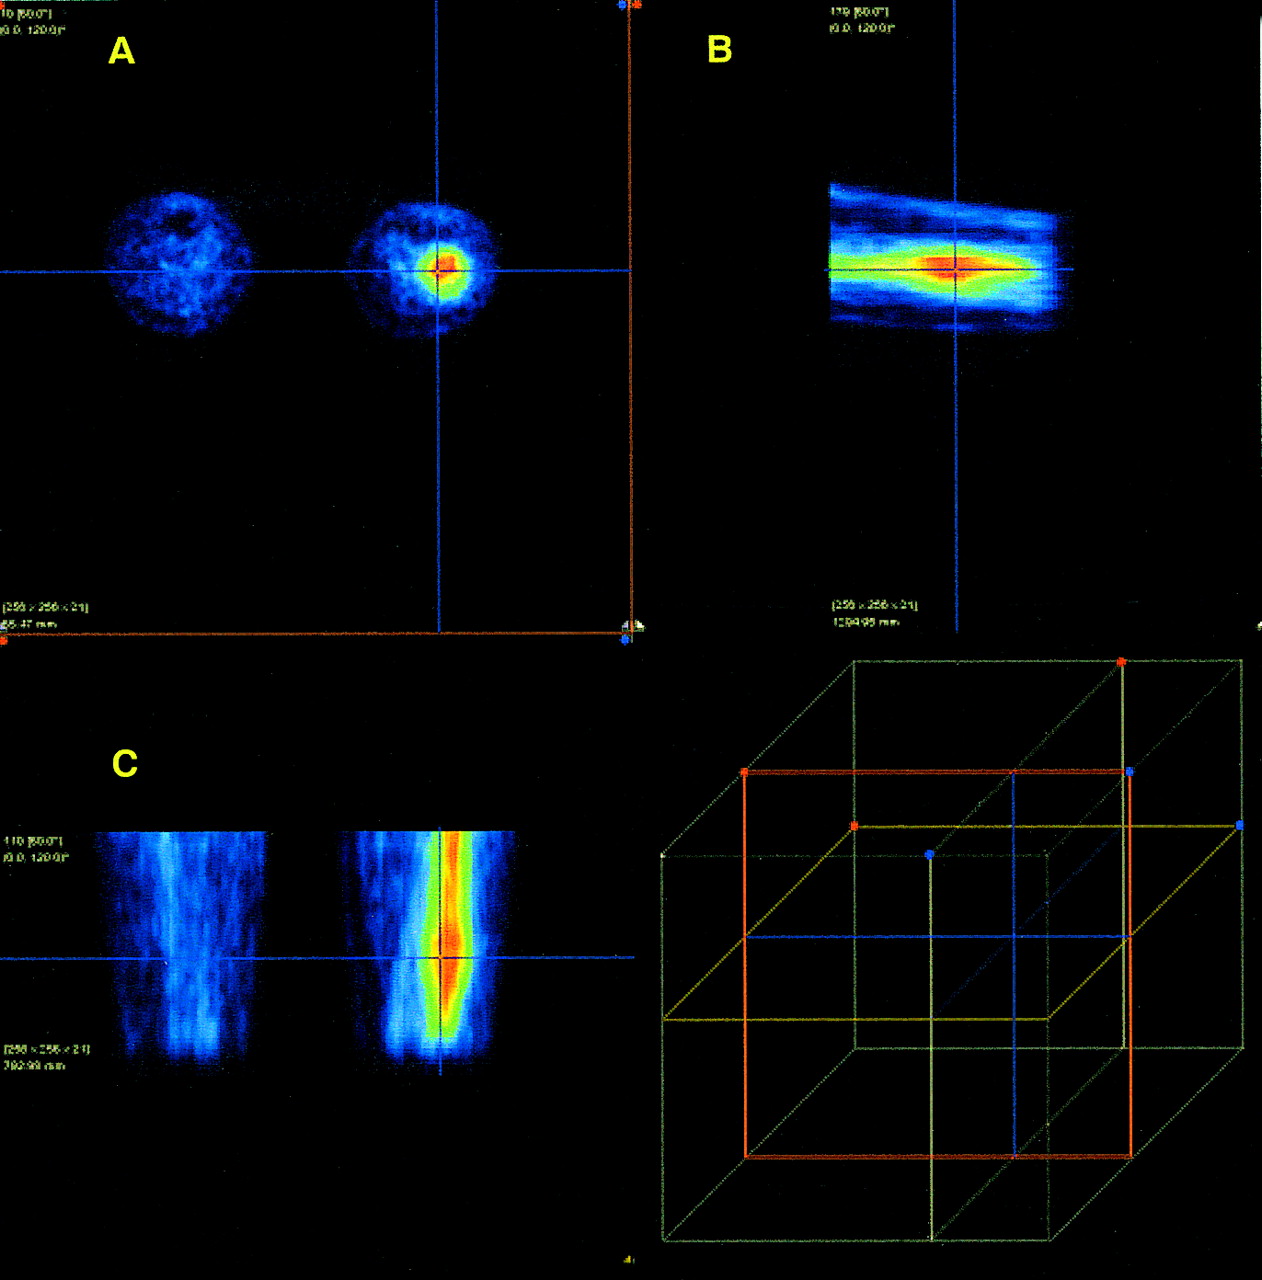
Transversal (A), sagittal (B), and coronal (C) images of patient with histologically confirmed fibrous dysplasia of distal part of left femur 1 h after 18F-FDG injection show high 18F-FDG uptake in suspicious lesion. Cross cursor is positioned over suspicious lesion according to clinical examination. PET images are visualized with PMod software package. Cube indicates relative position of cursor in volume of view.
The mean 18F-FDG uptake 60 min after injection was 3.7 SUV (range, 0.4–12.3 SUV) for the malignant bone tumors compared with 1.1 SUV (range, 0.4–3.5 SUV) in benign lesions (Tables 1 and 2). The descriptive statistics of all evaluated parameters—including the SUVs, transport constant K1 and rate constants (k2–k4), as well as the VB and the fractal dimension of the 18F-FDG kinetics in malignant and benign lesions—are presented in Tables 1 and 2. The data show increased mean values for all parameters in tumors except k2 and k4. The t test revealed a significant difference of the mean values for SUV, VB, global influx, and the fractal dimension when malignant and benign lesions are compared (P < 0.05).
Descriptive Statistics for All Malignant Tumors
Descriptive Statistics for Benign Lesions
The SUV and the fractal dimension for malignant and benign lesions are shown in Figure 3. Although the median value for the SUV (Fig. 3) appears to be higher for malignant lesions, the overlap of the extreme values for both categories is large. Fractal dimension is a robust parameter with a relatively low variability. Although the median value of the fractal dimension (Fig. 3) for malignant tumors is higher than that in benign lesions, there is still a broad overlap. Comparable results were observed for the median value of other kinetic parameters such as K1 and k3.
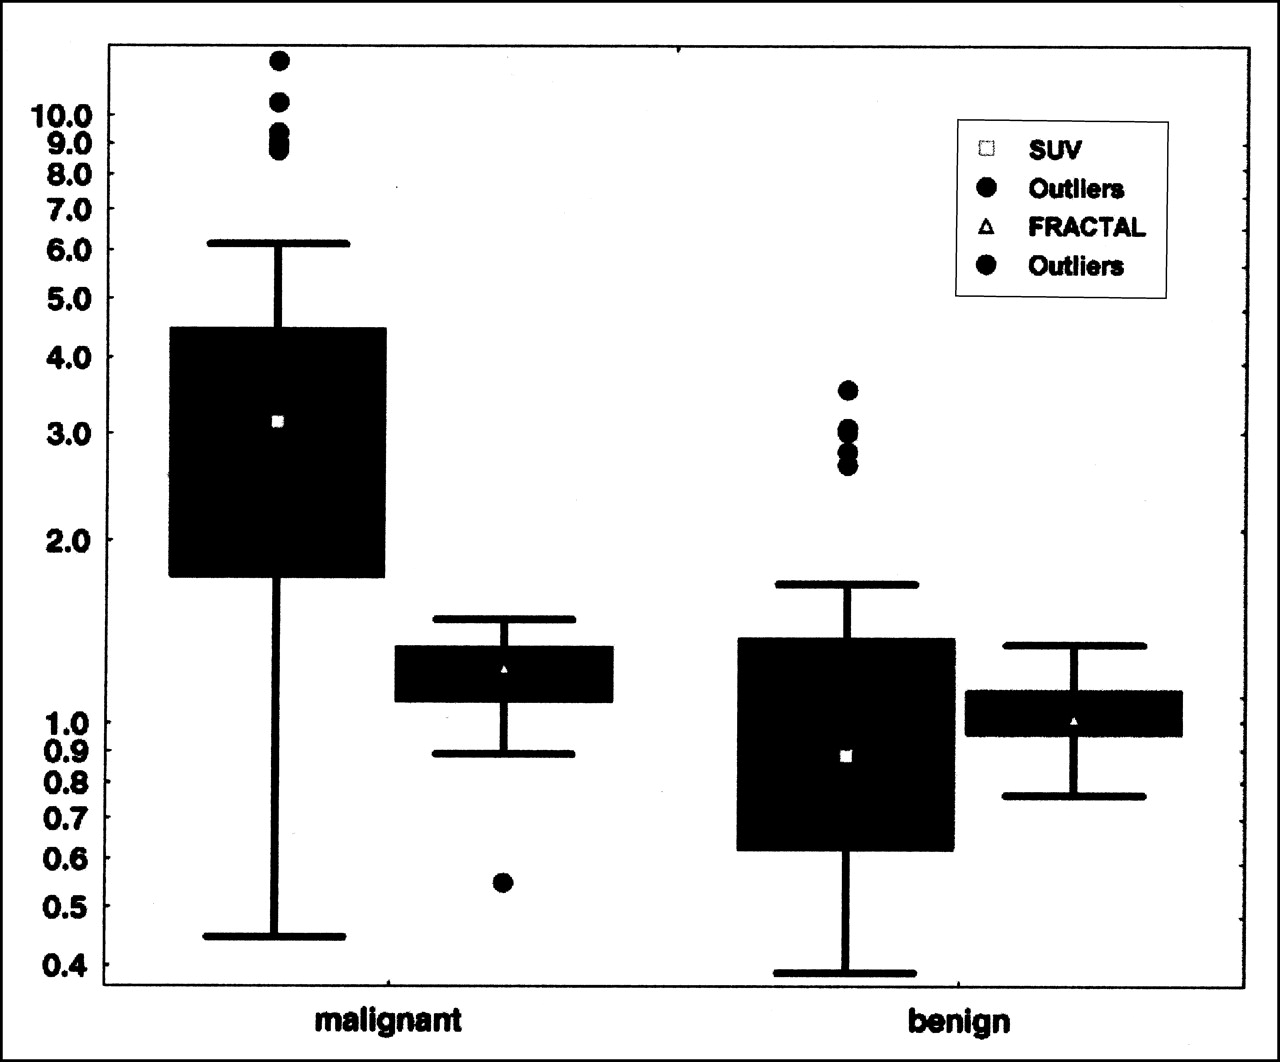
Box—whiskers plots of average 18F-FDG uptake (SUV) at 55–60 min and average of fractal dimension for all malignant (n=37) and all benign (n=46) lesions.
Although the data show that 1 parameter alone is not accurate enough to differentiate malignant and benign lesions, we used the DA to predict the 2 different categories (Table 3). The 18F-FDG kinetic parameters (SUV, K1, k2, k3, k4, VB, Ki, fractal dimension) served as input variables. The use of only the 55- to 60-min 18F-FDG SUV as an input variable for the DA provided a correct diagnosis of 20 of 37 tumors and 42 of 46 benign lesions. The sensitivity for the SUV was 54.05%, the specificity was 91.30%, and the accuracy was 74.70%. The fractal dimension was superior as a single parameter with regard to true-positive results (correct differentiation of 23/32 tumors) but misclassified 7 of 38 benign lesions. The sensitivity for the fractal dimension was 71.88%, the specificity was 81.58%, and the accuracy was 77.14%. The combination of both parameters improved the sensitivity in comparison with the use of SUV alone. However, the combination of all kinetic parameters of 18F-FDG and the use of a nonlinear equation for the discriminant function showed the best results with a sensitivity of 75.86%, a specificity of 97.22%, and an accuracy of 87.69% (Table 3). The regression coefficients used for the nonlinear equation of the discriminant function are presented in the Appendix.
Sensitivity, Specificity, and Accuracy for All Lesions Using 4 Different Combinations of Evaluation Parameters as Input Variables for DA
The gain in information was analyzed using the Bayesian theorem. In particular, the posterior probability of true- positive and false-negative results was calculated for different levels of prevalence of disease (prior probability). The comparison included 4 different quantification parameters: first, the 55- to 60-min SUV; second, the fractal dimension of the time—activity data; third, the combination of SUV and fractal dimension; and fourth, the combination of all kinetic parameters (SUV, VB, K1–k4, Ki, fractal dimension). Figure 4A shows a posterior probability true-positive value of 0.8 at the following levels of prior probability: 0.39 for SUV, 0.505 for fractal dimension, 0.42 for SUV and fractal dimension, and 0.235 for all kinetic parameters. The diagram shows that the SUV provides an acceptable posterior probability of true-positive results but the highest posterior probability of false-negative results compared with the other parameters. In contrast, the fractal dimension was superior regarding the posterior probability of false-negative results. In conclusion, the data show that true-positive results at the level of 0.8 can be achieved for a low prevalence of disease (0.235) if the full kinetic data are used for the evaluation. Furthermore, at a 0.235 level of prior probability of disease, the probability of false-negative results is lowest for the full kinetic analysis (Fig. 4A). The overall gain in information (difference between the absolute values of posterior probability of true-positive and posterior probability of false-negative) is shown in Figure 4B. It is clearly shown that the full kinetic analysis is superior to all other evaluation parameters, and the full kinetic analysis provides a maximum of information even at a low level of prior probability.
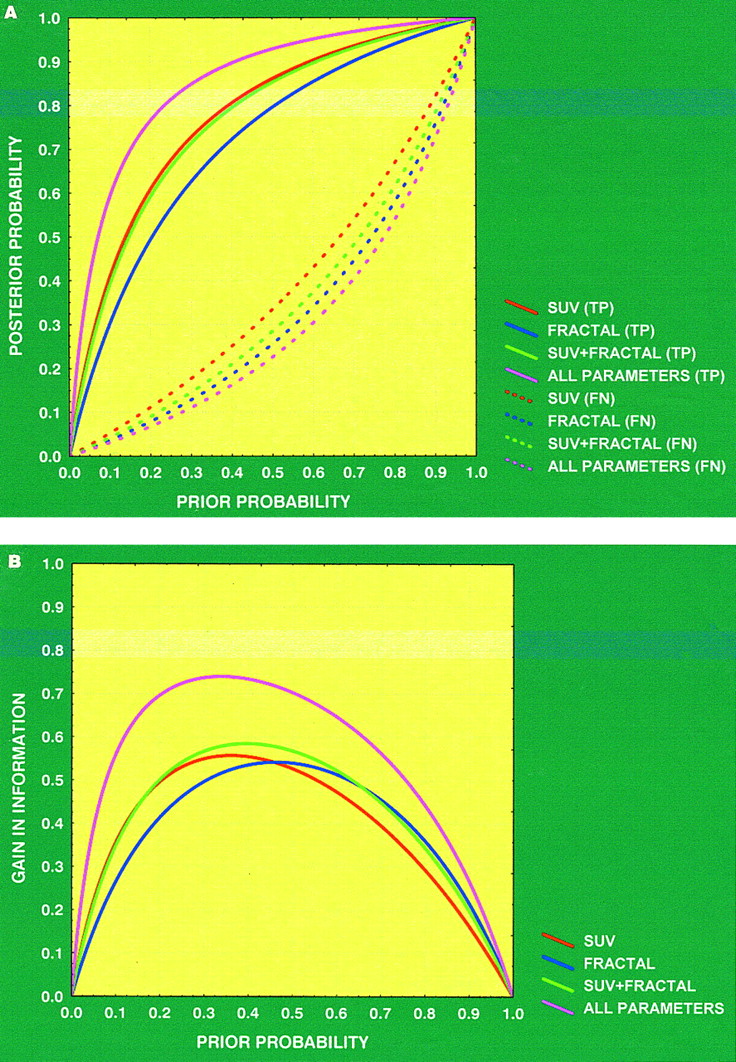
(A) Bayesian analysis applied to all data shows that probabilities of true-positive (TP) and false-negative (FN) results using 4 different parameters (red curve, SUV; blue curve, fractal dimension; green curve, SUV + fractal dimension; purple curve, all parameters) for evaluation are dependent on prevalence of disease. Solid curves represent posterior probability of true-positive results and dashed curves represent posterior probability of false-negative results. (B) Discriminant curves (difference of absolute values between posterior probability true-positive and posterior probability false-negative) for 4 different parameters of A indicating profit in information using PET. Full kinetic analysis (purple curve) is superior to all other parameters and provides maximum information at low level of prior probability.
DISCUSSION
PET with 18F-FDG is recommended for the primary diagnosis and staging as well as for the detection of recurrences in patients with different tumor types. However, conventional radiography is still the method of choice for the initial diagnosis of a primary bone tumor and the differentiation between malignant and benign intraosseous lesions. In many cases, CT and MRI are needed to assess the nature of a lesion and the morphology of a suspicious structure. However, the sensitivity and specificity of CT and MRI may be highly variable (17). The sensitivity reported in the literature using a dedicated PET scanner exceeds 90%, whereas the specificity is lower and highly variable, ranging from 65% to 80% (3,18). Malignant lesions of the bone may be missed (false-negative) or some benign lesions may be classified as malignant because of an enhanced 18F-FDG uptake (false-positive). Low-grade tumors, which frequently show a low 18F-FDG uptake (3,4), provide the main reason for false-negative results. False-positive results may be caused not only by acute inflammatory lesions but also by some benign diseases with an inflammatory component, such as eosinophilic granulomas, fibrous dysplasia, or aneurysmatic cysts (2,3,19). Evaluation of the reported results varies from visual evaluation to semiquantitative evaluation using the SUV or even calculation of metabolic rates (4). Our goal was to examine the value of a dynamic, quantitative 18F-FDG study using several pharmacokinetic parameters for evaluation with respect to the final diagnosis and to the prevalence of disease.
Dehdashti et al. (18) studied 20 patients with intraosseous lesions and reported that the SUV was helpful in the diagnosis of benign and malignant intraosseous lesions. With a 2.0 cutoff value for the SUV, the sensitivity was 93% and the specificity was 80% in 15 patients with malignant lesions and 5 patients with benign bone lesions. However, benign lesions such as a fibrous dysplasia and infections showed an SUV in the malignant range (false-positive), whereas 3 bone metastases from prostate, breast, and bladder carcinoma did not show enhanced 18F-FDG uptake (false-negative). Schulte et al. (3) reported on 202 histologically verified bone lesions and found a sensitivity of 93% and a specificity of 66.7% using a cutoff level of 3.0 for the tumor-to-background ratio. Low-grade sarcomas (grade I) and plasmocytomas revealed false-negative results, whereas various benign lesions, such as aneurysmatic bone cysts, fibromas, and parathyroid osteopathy, showed an enhanced 18F-FDG uptake. The data show that sensitivity and specificity depend on the variety of histologic subtypes included in a study and on the cutoff level defined by the investigators. Using our results with a cutoff of 1.0 SUV, the sensitivity was 81.58% and the specificity was 54.17%. In contrast, for a cutoff of 2.0 SUV, the sensitivity was 68.42% and specificity was 85.42%. These data show that the heuristic selection of a cutoff level is critical with respect to sensitivity and specificity. Therefore, statistical methods such as the DA should find preferential use for the data analysis.
A 2-tissue-compartment model is a generally accepted method for an accurate, detailed kinetic analysis of the 18F-FDG metabolism. To limit the burden for the patient, we chose the retrieval of the input function from the image data. Ohtake et al. (12) showed that the image-based data obtained from a vessel VOI consisting of at least 7 consequent ROIs correlate well with those obtained by arterial and venous blood sampling. We used VOIs instead of ROIs to maximize the information retrieved from the images. The high resolution, the small pixel size used for reconstruction, and the use of VOIs limit the partial-volume effects in our study (recovery coefficient, 0.85 for lesions of >8 mm in diameter). For small vessels with a diameter of <8 mm, a partial-volume correction was performed on the basis of phantom measurements of the recovery function.
However, no data have been provided about the impact of a quantitative procedure on diagnostic accuracy. The role of quantitative dynamic 18F-FDG studies with arterial blood sampling and calculation of metabolic rates was studied by Kole et al. (4). The authors reported the dynamic data, including arterial blood sampling for the input function and the lack of correlation between the metabolic rate of 18F-FDG and the aggressiveness of the neoplasms in 19 malignant and 7 benign bone lesions (4). Furthermore, the authors concluded that it was not possible to differentiate between malignant and benign bone tumors using the metabolic rate of glucose consumption. However, the authors confined the evaluation to the metabolic rate and did not include the kinetic parameters of a full 2-tissue-compartment model.
The use of several kinetic parameters obtained from the dynamic 18F-FDG data provides more information about 18F-FDG pharmacokinetics than the SUV of a single acquisition. The transport constant K1 is a parameter for the transport capacity of 18F-FDG, and the rate constant k3 is associated with the phosphorylation rate of the radiopharmaceutical. The blood volume in a tumor tissue is a parameter that modulates the uptake of the tracer. Therefore, the use of the VB of 18F-FDG is another parameter that can improve diagnostic accuracy. In addition to compartment analysis, the fractal dimension may help to quantify heterogeneity. In general, tumors showed a higher fractal dimension—as shown in the parametric image of Figure 1—than benign processes. The increased fractal dimension is indicative of a more chaotic distribution of 18F-FDG. Furthermore, the example of Figure 1 reveals that the area of chaotic metabolism of 18F-FDG is larger than the area of enhanced 18F-FDG uptake expressed in SUV.
We used the t test for the basic analysis of the data and to determine the most statistically significant kinetic parameters for the differentiation of benign and malignant lesions. Interestingly, SUV, VB, Ki, and fractal dimension were significant parameters for the differentiation of these 2 groups. Some investigators have used the fractal dimension as a parameter for the assessment of spatial heterogeneity. Kleen et al. (14) used the fractal dimension as a scale-independent factor to measure spatial heterogeneity of blood flow. We used the fractal dimension to characterize the kinetics of 18F-FDG in all lesions. The mean value for the fractal dimension in malignant lesions is significantly higher than that in benign lesions. According to the data, the 18F-FDG turnover in benign, metabolically inactive lesions is more deterministic than that in tumors and in inflammations. The advantage of the fractal dimension is the lack of an input function and the good reproducibility of the values. DA, using only the fractal dimension data as input variable, revealed an improvement of sensitivity and accuracy in comparison to the analysis with SUV.
Analysis of the pharmacokinetic data revealed some interesting aspects about the bone lesions. To our knowledge, there are no reports about transport rates (K1–k4) in bone lesions. To analyze the predictive value of 18F-FDG kinetics for the differential diagnosis (benign vs. malignant), we applied the DA to the data and compared the predicted classification with the histologically observed classification in each patient (Table 3). The results revealed a sensitivity of 75.86%, a specificity of 97.22%, and an accuracy of 87.69% when all transport constants, VB, Ki, fractal dimension, and SUV were used as input variables (nonlinear analysis). The data indicate that a negative PET study is reliable for the exclusion of a bone tumor. The coefficients of the nonlinear discriminant function are presented in the Appendix and can also be used for a prospective classification of a lesion into benign or malignant.
In addition to the impact of the evaluation parameters on the diagnostic accuracy of 18F-FDG PET, the prevalence of disease is another aspect that must be considered. The Bayesian analysis was applied to the data of this study to analyze sensitivity and specificity of the PET results with respect to different levels of the prevalence of disease. Theoretically, a diagnostic procedure should provide a high rate of true-positive results at a low level of prevalence of disease (prior probability of disease). Analysis of our data generally showed a high posterior probability of true-positive results at relatively low levels of prior probability for almost all parameters. Using only the 55- to 60-min SUV for evaluation, a posterior probability true-positive value of 0.8 was achieved at a 0.39 level of prior probability (Fig. 4A). However, the posterior probability of a false-negative value was not acceptable in comparison with the results obtained with the other kinetic parameters. In contrast, the fractal dimension was superior to the SUV concerning the posterior probability of false-negative results (Fig. 4A). However, the best results were obtained using the combination of all kinetic parameters with a posterior probability true-positive value of 0.8 at a prior probability of 0.235 (Fig. 4A). According to our data, the full kinetic analysis of an 18F-FDG study is the most accurate method for the differentiation of malignant and benign lesions at a low level of prior probability of disease. The Bayesian analysis showed a clear dependency of the PET results on the prevalence of disease (prior probability) and on the kinetic parameters used for the quantification of the PET images. This explains the highly variable specificity reported in the literature for 18F-FDG PET studies of bone lesions.
CONCLUSION
18F-FDG has a high specificity for the exclusion of a malignant bone tumor. Evaluation of the full 18F-FDG kinetics and the application of DA are required and can be used prospectively to classify a bone lesion into malignant or benign.
APPENDIX
DA
DA is a statistical procedure that is used to determine which variable discriminates between 2 or more a priori defined groups. The most common application of DA is to include many measures of the study to determine the ones that best discriminate between groups. In this study, DA was used to determine which of the evaluated parameters (SUV, VB, K1, k2, k3, k4, Ki, fractal dimension [FD]) best discriminates between malignant and benign lesions. The basic idea underlying discriminant function analysis is to determine whether groups (in this case, malignant vs. benign) differ with regard to the mean of a variable. In the 2-group case (malignant vs. benign) discriminant function analysis is analogous to a multiple regression function, which is calculated for both groups (malignant/benign) separately. The equation used was of the type:

 where a is a constant and b1 through bm are regression coefficients; x1 to xm were equal to the quantification parameters used: SUV, VB, K1, k2, k3, k4, Ki, FD.
Those variables with the largest standardized regression coefficients are the ones that contribute most to the prediction of group membership.
To discriminate malignant from benign lesions using all kinetic parameters, the following equations were applied:


The coefficients given in these 2 equations were calculated for the data included in this study. We classify the case as belonging to the group for which it has the highest classification score (www.statsoft.com/textbook/stdiscan.html).
Bayesian Analysis
The Bayesian analysis takes into account the different prevalence of disease and its influence on diagnostic accuracy. The Bayesian theorem was used to assess the performance of the different quantification parameters regarding different levels of disease prevalence.
The equation used to calculate the posterior probability of true-positive results (P1) for each quantification parameter was:
 where P(D+) is the prior probability (probability of having a disease before a diagnostic test) and P(D−) is 1−P(D+).
The equation used to calculate the posterior probability of false-negative results (P2) for each quantification parameter was:
 where P(D+) is the prior probability (probability of having a disease before a diagnostic test) and P(D−) is 1−P(D+).
The prevalence of disease P(D+) was varied from 0 to 1 in Equations P1 and P2: a=true-positive; b=false-negative; c=false-positive; d=true-negative.
The gain in information was calculated using the formula:

Acknowledgments
The authors thank Gisela Irngartinger, MD, German Cancer Research Center (Heidelberg), for her support.
Footnotes
Received Dec. 7, 2000; revision accepted May 14, 2001.
For correspondence or reprints contact: Antonia Dimitrakopoulou-Strauss, MD, Department of Oncological Diagnostics and Therapy, E0105, Medical PET Group, Biological Imaging, German Cancer Research Center, Im Neuenheimer Feld 280, Heidelberg, D-69120 Germany.
E-mail: a.dimitrakopoulou-strauss{at}dkfz.de
REFERENCES
In this issue


Jump to section
Related Articles
Cited By...
- Diagnostic work up and recognition of primary bone tumours: a review
- MRI for the detection of prostate cancer origin vertebral metastases in the preosteoblastic phase
- PET/CT and MRI of intra-osseous haemangioma of the tibia
- Shortened Acquisition Protocols for the Quantitative Assessment of the 2-Tissue-Compartment Model Using Dynamic PET/CT 18F-FDG Studies
- Usefulness of 11C-Methionine for Differentiating Tumors from Granulomas in Experimental Rat Models: A Comparison with 18F-FDG and 18F-FLT
- Imaging of Malignant Bone Involvement by Morphologic, Scintigraphic, and Hybrid Modalities
- Biologic Correlates of Intratumoral Heterogeneity in 18F-FDG Distribution with Regional Expression of Glucose Transporters and Hexokinase-II in Experimental Tumor
- 18F-FDG Kinetics and Gene Expression in Giant Cell Tumors
- Shortened PET Data Acquisition Protocol for the Quantification of 18F-FDG Kinetics
- Delayed 18F-FDG PET for Detection of Paraaortic Lymph Node Metastases in Cervical Cancer Patients