


Abstract
5-Hydroxytryptamine (serotonin)-1A (5-HT1A) receptors are of key interest in research on the pathophysiology and treatment of psychiatric disorders. The PET radioligand [carbonyl-11C]WAY-100635 (11C-WAY), where WAY-100635 is 3H-(N-(2-(1-(4-(2-methoxyphenyl)-1-piperazinyl)ethyl)-N-(2-pyridyl) cyclohexane-carboxamide, is commonly used for quantitation of 5-HT1A receptors in the human brain. The aim of this PET study was to compare 11C-WAY with the putative metabolite and selective radioligand [carbonyl-11C]desmethyl-WAY-100635 (11C-DWAY). Methods: A PET examination was performed on each of 5 healthy male volunteers after intravenous injection of 11C-WAY and 11C-DWAY on separate occasions. Radioactive metabolites in plasma were determined with high-performance liquid chromatography. The plasma metabolite–corrected input function was used in a kinetic compartment analysis. The simplified reference tissue model and peak equilibrium method, using the cerebellum as reference region, was applied for comparison of data. Results: For both radioligands, the highest radioactivity was observed in the neocortex and the raphe nuclei, whereas radioactivity was low in the cerebellum. The regional binding potentials were similar for the 2 radioligands. The brain uptake was more than 2-fold higher for 11C-DWAY than for 11C-WAY, in part because of higher delivery (first-order rate constant K1, 0.38 vs. 0.16). The time–activity curves were well described by a 3-compartment model for all regions, whereas uptake in the cerebellum could not be described by a 2-compartment model, supporting the existence of kinetically distinguishable nonspecific binding in the cerebellum or radioactive metabolites in the brain for both radioligands. Both radioligands were rapidly metabolized, and <10% of the radioactivity in plasma represented unchanged 11C-WAY or 11C-DWAY at 10 min after injection. The metabolic pattern was similar for both radioligands, with the formation of radiolabeled cyclohexanecarboxylic acid and more polar components. For 11C-WAY, small amounts of an additional labeled metabolite comigrated with reference desmethyl-WAY-100635. Conclusion: The advantages of 11C-DWAY over 11C-WAY for research on central 5-HT1A receptors is supported by a significantly higher radioactivity signal at equipotent doses, providing improved imaging statistics and advantages in biomathematic modeling and the preclusion of 11C-DWAY as a metabolite interfering with PET measurements.
A technique currently applied to examine the pathophysiology of neuropsychiatric disorders and to establish the pharmacology of central nervous system drugs is PET (1). The progress of PET for brain imaging is related to the development of suitable radioligands for the multitude of neuroreceptor subtypes that are expressed in the human brain.
Imaging of serotonin 5-hydroxytryptamine-1A receptors (5-HT1A) is of high interest in research on the pathophysiology and treatment of anxiety, depression, and schizophrenia (2–5). Presynaptic 5-HT1A receptors mediate inhibition of 5-hydroxytryptamine release (6) and are highly concentrated on cell bodies in the raphe nuclei, whereas postsynaptic receptors are abundant in the neocortex, as shown by in vitro studies (7).
The 5-HT1A receptor has recently been characterized in the postmortem human brain using the receptor antagonist 3H-(N-(2-(1-(4-(2-methoxyphenyl)-1-piperazinyl)ethyl)-N-(2-pyridyl) cyclohexane-carboxamide (WAY-100635), which binds selectively and with high affinity (dissociation constant [Kd], approximately 0.4 nmol/L) to this receptor subtype (8,9). Labeling of WAY-100635 in its carbonyl group with 11C (half-life, 20.4 min) yields a radioligand (Fig. 1) that accurately delineates the distribution of 5-HT1A receptors in the human brain (10).
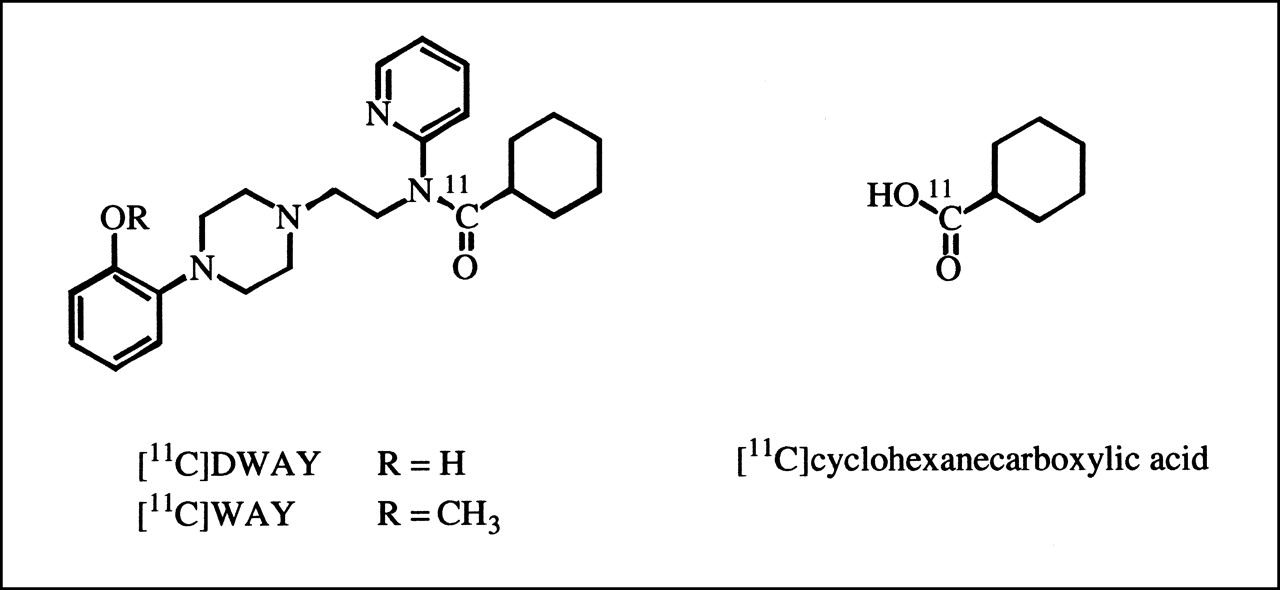
Chemical structure of [carbonyl-11C]WAY-100635 (11C-WAY) and 2 metabolites, [carbonyl-11C]desmethyl-WAY-100635 (11C-DWAY) and [carbonyl-11C]cyclohexanecarboxylic acid.
[carbonyl-11C]WAY-100635 (11C-WAY) has been characterized and used for quantitative studies of 5-HT1A receptors in the brains of humans and other primates (11–15). A common quantitative approach has been to use the cerebellum as reference tissue for the free radioactivity concentration in brain because this region is almost devoid of 5-HT1A receptors. A consistent finding has been a significantly better description of the cerebellar time–radioactivity curves by a 3-compartment model (3-CM) than by a 2-compartment model (2-CM) (13–15). One hypothesis to explain the better fit of data using a 3-CM for the cerebellum is the existence of kinetically distinguishable nonspecific binding. An alternative explanation is that the observation may represent uptake of a radioactive metabolite (13,14). Interestingly, WAY-100635 labeling in the carbonyl position (10) gives radioactive metabolites, such as 11C-cyclohexanecarboxylic acid and, to a low extent, [carbonyl-11C]desmethyl-WAY-100635 (11C-DWAY) (Fig. 1), that may contribute to radioactivity in the cerebellum (11,16,17).
The metabolite 11C-DWAY has high affinity to 5-HT1A receptors (inhibitory concentration of 50% [IC50], 1.4 nmol/L) and has recently been suggested as a putative radioligand for PET (11,18,19). One reason is that 11C-DWAY has the possible advantage of not forming any further labeled metabolite that passes the blood–brain barrier other than 11C-cyclohexanecarboxylic acid. The binding of 11C-DWAY to central 5-HT1A receptors has been characterized by autoradiography and in preliminary PET studies in monkeys and humans (11,18,19).
The current PET study evaluated the prospects for using 11C-DWAY as an alternative to 11C-WAY for quantification of central 5-HT1A receptors in the human brain. Two- and 3-compartment analyses and 2 reference tissue approaches were applied in 5 healthy male volunteers to calculate rate constants and estimate regional radioligand binding in the brain. Radioactive metabolites in plasma were examined with high-performance liquid chromatography (HPLC).
MATERIALS AND METHODS
Subjects
The study was approved by the ethics and the radiation safety committees of the Karolinska Hospital. Six men (age range, 20–32 y) participated in 2 PET measurements after giving informed consent. One of the 6 men was excluded because of arterial blood-sampling failure. All men were healthy according to history, physical examination, psychiatric interview, blood and urine analysis, and MRI of the brain. All were nonsmokers and used no medication.
MRI and Head Fixation System
The MRI system was a 1.5-T Signa (General Electric Medical Systems, Milwaukee, WI). T2-weighted and proton density MR images of the brain were obtained for all participants. A head fixation system with an individual plaster helmet was used for the PET and MRI examinations to allow mastery of positioning between the 2 modalities and to ensure accuracy on repositioning (5,20). The helmet was made so that the plane defined by the external anatomic landmarks of the meatus acusticus externus and the lateral angle of the orbita was oriented along the expected image plane.
Radiochemistry
11C-WAY (Fig. 1) was synthesized as described previously (9). The specific radioactivity of 11C-WAY at the time of intravenous injection was between 47,138 and 75,332 GBq/mmol. The radioactivity injected ranged from 257 to 300 MBq, and the injected mass ranged from 1.7 to 2.6 μg.
11C-DWAY (Fig. 1) was prepared by 11C-acylation of the appropriate secondary amine precursor, as described previously (18). 11C-DWAY was isolated by HPLC on a μBondapak C-18 column (Waters, Milford, MA) eluted with methanol and 0.1 mol/L ammonium formate. All chemicals were of analytic grade. The radiochemical purity, chemical purity, and specific radioactivity of each batch were determined by HPLC. The radiochemical purity of the final products was >99%. The specific radioactivity of 11C-DWAY at the time of intravenous injection ranged from 25,942 to 41,736 GBq/mmol, and the radioactivity injected was between 157 and 306 MBq, corresponding to an injected mass of 3.1–4.6 μg.
Arterial Blood Sampling
To obtain the arterial input function, an automated blood sampling system was used during the first 5 min of each PET measurement (21). Subsequent arterial blood samples were taken manually at the midpoint of each frame until the end of the PET measurement (22). The experimentally defined difference between the appearance of radioactivity in the automated blood sampling system and brain was approximately 10 s.
Determination of Radioactive Metabolites in Plasma
The fractions of plasma radioactivity corresponding to unchanged 11C-WAY and 11C-DWAY were determined as described previously (11). In short, arterial blood samples (2 mL) were drawn at 4, 10, 20, 30, 40, 50, and 60 min after injection. The supernatant liquid obtained after centrifugation for 2 min was deproteinized with acetonitrile and analyzed by HPLC on a reverse-phase column (μBondapak C-18, 7.8 × 300 min, 10 μm) eluted at 6 mL/min over 9 min with acetonitrile and 0.01 mol/L phosphoric acid, using a gradient of 10:90 to 70:30 acetonitrile:phosphoric acid from 0 to 6.5 min and back to 10:90 at 7.5 min. The radioactivity in a certain fraction was expressed as the percentage of the total radioactivity in plasma (14).
PET Experimental Procedure
The PET system was an ECAT EXACT HR (CTI, Knoxville, TN/Siemens Medical Systems, Inc., Hoffman Estates, IL) that provided 47 sections with a center-to-center distance of 3.125 mm (23). The intrinsic spatial resolution was 3.6 mm in the imaging plane and 4.0 mm in full width at half maximum (FWHM) axially. With a Hanning filter, used for scatter correction, the reconstructed in-plain resolution was 5.5 mm in FWHM. Data were acquired in 3-dimensional mode. Scatter correction was performed as described in the literature, and attenuation correction was performed using the transmission scan data. The reconstructed volume was displayed as 47 transaxial sections with a section thickness of 3.125 mm.
Each subject was placed recumbent with his head in the PET system. To standardize the positioning of the cerebellum within a PET section and to avoid positioning this region at the edge of the axial field, anatomic landmarks were used together with the horizontal and vertical laser beams of the PET system.
Each subject was examined with PET on 2 occasions on the same day, once in the morning using 11C-WAY and once in the afternoon using 11C-DWAY. At least 4 h elapsed between the 2 measurements. The time between the 2 PET scans corresponded to more than 9 physical half-lives for 11C (20.4 min). Residual radioactivity from the first PET measurement thus should not have interfered with the second PET measurement. In each PET measurement, the subject was placed recumbent with his head in the PET system. A cannula was inserted into the left brachial artery, and another cannula was inserted into the right antecubital vein. A sterile physiologic phosphate buffer (pH 7.4) solution containing 11C-WAY or 11C-DWAY was injected as a bolus during 2 s into the right antecubital vein. The cannula was then immediately flushed with saline (8 mL).
Brain radioactivity was measured in a series of 16 consecutive time frames for up to 69 min. The frame sequence consisted of three 1-min frames followed by four 3-min frames and nine 6-min frames.
Regions of Interest and Regional Radioactivity
Regions of interest (ROIs) were chosen for brain regions that are in the focus of research on schizophrenia, anxiety, and affective disorders. ROIs were defined for the neocortical regions, thecingulate cortex, the frontal and lateral temporal cortices, the insular cortex and the medial temporal cortices, the hippocampus, the raphe, and the cerebellar cortex. ROIs were delineated on MR images according to anatomic boundaries and were transferred to the corresponding PET images. However, the raphe nuclei were delineated directly on reconstructed PET images because this small structure cannot be distinguished on MR images.
The frontal and temporal cortices were drawn at the level of the basal ganglia, whereas the raphe nuclei were delineated at the level of the hippocampal formation. The ROIs for the cerebellar cortex and neocortical regions were drawn in 3 adjacent sections, and the raphe nuclei in 4 sections. Data were pooled so that the average radioactivity concentration for the whole volume of interest, and both hemispheres when applicable, was obtained.
The image matrix size was 128 × 128, and the pixel size was 2.0 mm. The pixel size was multiplied by the number of pixels of each ROI, plane, and subject to calculate the average ROI size. These values were 297 mm2 for the cingulate cortex, 1,050 mm2 for the frontal cortex, 1,260 mm2 for the temporal cortex, 503 mm2 for the insular cortex, 312 mm2 for the hippocampus, 53 mm2 for the raphe, and 690 mm2 for the cerebellum.
Quantitative Analyses
To determine the rate constants describing the regional kinetics of 11C-WAY and 11C-DWAY, conventional 2-CMs and 3-CMs were fitted to the datasets. Parameters relating to binding and delivery of the tracers were derived from these rate constants. Statistical assessment of the residuals to the model fit allowed decisions to be made about the most appropriate compartment model configuration. In addition, 2 reference tissue approaches that do not require an arterial input function were applied to the datasets and regional binding potentials (BPs) were obtained.
Compartmental Analysis
Radioligand binding to 5-HT1A receptors was analyzed using the conventional compartmental model for PET ligand-receptor binding (Fig. 2). The 4 compartments correspond to the radioactivity concentrations of unchanged radioligand in plasma (Cp), free (unbound) radioligand in brain (Cf), nonspecifically bound radioligand in brain (Cns), and radioligand specifically bound to receptors (Cb). All concentrations have the dimension nCi/mL.

General compartmental configuration showing 2-CM and 3-CM.
A common assumption is that the concentrations of Cns and Cf rapidly equilibrate to form an effective compartment (24) that corresponds to nondisplaceable radioligand in brain, or Cn. In this study, the resultant simplified model using 3 compartments and 4 first-order rate constants, K1, k2, k3, and k4 (24–26), was used to describe the time–radioactivity curves in brain regions known to contain 5-HT1A receptors. All compartments were assumed to be homogeneous in concentration. The model is described by the following set of differential equations:
 Eq. 1
Eq. 1
 Eq. 2
Eq. 2
 Eq. 3
where Ct(t) is the total radioactivity concentration in brain, corrected for the cerebral volume (CBV) as described further below.
Eq. 3
where Ct(t) is the total radioactivity concentration in brain, corrected for the cerebral volume (CBV) as described further below.
The 4 rate constants were estimated by fitting the model in a least squares sense to the regional time–radioactivity curve (27). The differential equations were solved using a convolution approach (28). All data points were given equal weight. The time–radioactivity curves for unchanged 11C-WAY and 11C-DWAY in arterial plasma were used as input functions.
Reference Tissue Analysis
The cerebellum is a brain structure virtually devoid of 5-HT1A receptors (9,29). The radioactivity concentration in this reference region, Cn(t), is estimated using the following 2 approaches.
Simplified Reference Tissue Model.
The simplified reference tissue model, introduced by Lammertsma and Hume (30), is a 3-parameter model that provides increased convergence rates, including stability, compared with a previously developed 4-parameter model (28). By approximating the tissue ROI as a single tissue compartment, the model is reduced from 4 parameters to 3; the BP, the relative delivery to the ROI and compared with the reference tissue (R1 = K1/K′1), and the efflux constant from brain to plasma (k2). This model was used for the calculation of regional BP, which is referred to here as BPSRTM.
Peak Equilibrium Method.
The radioactivity in the cerebellum, Ccer(t), was used to calculate Cb(t), that is, Ct(t) − Ccer(t), according to Equation 3, assuming that the radioligand time–radioactivity curves for free and nonspecific binding are identical in the reference and target tissues. The condition of peak equilibrium is defined as theoretically existing when the derivative for Cb(t) is zero (12). This moment is called peak equilibrium because, theoretically, at that very moment the number of molecules associating to the receptors is equal to the number that dissociates from the receptors (13). At peak equilibrium, the ratio Cb/Cn is equal to the BP, which is referred to as BPEQ.
BPs and Volumes of Distribution
The analyses used in this article are based on the injection of radioligand with high specific radioactivity. Under such conditions, the receptor density (Bmax) and affinity (Kd) cannot be differentiated. The concept BP has been introduced as the ratio Bmax/Kd, where Bmax denotes the maximum concentration of binding sites and Kd denotes the apparent equilibrium dissociation rate constant (13,25). In the current comparison, the definition of the parameter BP also contains the tissue radioligand “free” fraction (f2), and hence, BP = k3/k4 (= f2 Bmax/Kd).
A widely used quantitative approach has been to express radioligand binding in terms of distribution volume. Two such volumes are defined by Equations 4 and 5:
 Eq. 4
and
Eq. 4
and
 Eq. 5
Eq. 5
Vn is the distribution volume in a brain region with only nondisplaceable binding and, thus, is devoid of specific binding sites. Vt is the total distribution volume. Vt was calculated by entering into Equations 4 and 5 the rate constants obtained from the 3-CM analysis.
In the current comparison of the 2 radioligands, regional BP was estimated in 3 ways: BP3-CM, using the volume of distribution obtained from the 3-CM, and BPSRTM and BPEQ, obtained from the 2 reference tissue approaches. The ratio of k5 to k6 for the cerebellum was used to calculate the “nonspecific” BP (BPns) for the cerebellum. Vcerebellum = K1/k2 is the distribution volume in a reference region with kinetically distinguishable nonspecific binding. For comparison of results, BP was also calculated from the compartment model fits as V/Vcerebellum − 1, where V = K1/k2(1 + k3/k4) and Vcerebellum = K1/k2(1 + k3/k4). The value thus derived should be most directly comparable with BP values calculated by the 2 reference methods.
Cerebellum as Reference Region
The cerebellum is a brain region with a low density of 5-HT1A receptors as supported by binding studies on postmortem human brain material (7), messenger RNA distribution (31), and receptor distribution in autoradiography studies (9,29).
In a region that is devoid of specific binding sites and thus does not have a specific binding compartment (Cb), a 2-CM with 2 rate constants should be sufficient to describe the time–activity curves (assuming rapid equilibration of the free and nonspecifically bound compartments). To evaluate the number of tissue compartments required to describe the cerebellum, we applied both a 2-compartment 2-parameter fit (K1 and k2) and a 3-compartment 4-parameter fit (K1, k2, k5, and k6) to the cerebellar cortex data (12,22). The 2 models were assessed statistically by application of the F test (32), the Akaike information criteria (33), and the Schwartz criteria (34) to the residual sum of squares of the model fits. The root mean square error was calculated using the equation  , where RSS is the residual sum of squares.
Using a 2-CM in the cerebellum does not guarantee the ability to distinguish between free and nonspecific components as the 2 compartments. Nonspecific binding may have both a kinetically distinguishable component and, in addition, a rapidly equilibrating component as originally suggested (24).
Cerebral Blood Volume
Cerebral blood volume (CBV) correction was performed according to the following equation (22,28):
 Eq. 6
where CROI(t) is the ROI concentration, Vb is the blood volume component, Ct(t) is the tissue concentration, and Ca(t) is the whole-blood concentration. A reference Vb of 4% was used in the kinetic analyses to correct for radioactivity in CBV (35). The calculated radioactivity contribution from CBV was subtracted from the regional time–radioactivity curves before the compartment analysis. The ROI and cerebellum curves were not corrected for blood volume before the simplified reference tissue model (SRTM) and peak equilibrium method were applied; a bias may thus be expected.
Eq. 6
where CROI(t) is the ROI concentration, Vb is the blood volume component, Ct(t) is the tissue concentration, and Ca(t) is the whole-blood concentration. A reference Vb of 4% was used in the kinetic analyses to correct for radioactivity in CBV (35). The calculated radioactivity contribution from CBV was subtracted from the regional time–radioactivity curves before the compartment analysis. The ROI and cerebellum curves were not corrected for blood volume before the simplified reference tissue model (SRTM) and peak equilibrium method were applied; a bias may thus be expected.
Radioligand Brain Delivery
The radioligand brain delivery of 11C-WAY and 11C-DWAY was compared and examined for the total brain. In addition, maximum uptake was calculated. This parameter includes clearance and binding, thus providing information on expected imaging statistics in a complete biologic system in vivo. The average radioactivity for 4 adjacent brain sections was calculated to determine total radioactivity in brain. The average concentration in the time frame corresponding to maximal radioactivity uptake was used and multiplied by the average total brain volume (set to 1,350 mL). The total radioactivity uptake was then compared with the injected radioactivity to calculate brain uptake in percentage of injected 11C-WAY and 11C-DWAY.
RESULTS
Each subject participated in 2 PET examinations on the same day, once with 11C-WAY and once with 11C-DWAY. For both radioligands, radioactivity appeared rapidly in the brain (Figs. 3A and 3B). The highest radioactivity concentration was observed in the insular and medial temporal cortices (including the hippocampal formation), with a somewhat lower uptake in the raphe (Figs. 3A, 3B, and 4). A high signal was also notable in the cingulate, frontal, and lateral temporal cortices, whereas the signal in the cerebellum was low (Figs. 3 and 4).

Time curves for regional brain radioactivity after intravenous injection of 11C-WAY (A) and 11C-DWAY (B), normalized to injected dose (300 MBq), and time curves for specific radioligand binding of 11C-WAY (C) and 11C-DWAY (D). dCb/dt indicates time of peak equilibrium.
The regional time–activity curves reached a peak at approximately 4 and 8 min after 11C-WAY and 11C-DWAY injection, respectively (Figs. 3A and 3B). The signal in all regions was about twice higher using 11C-DWAY than using 11C-WAY (Figs. 3A and 3B). The percentage of injected radioactivity in the brain at the time of maximal radioactivity uptake was 11.2 ± 1.9 for 11C-DWAY and 4.6 ± 1.9 for 11C-WAY (mean ± SD; n = 5).
Both radioligands were rapidly metabolized (Fig. 5A), and <10% of the radioactivity in plasma represented unchanged 11C-WAY or 11C-DWAY at 10 min after injection, as determined with HPLC (Fig. 5B). The HPLC chromatograms revealed similar polar labeled metabolites of 11C-WAY and 11C-DWAY and an identical comigration for the reference cyclohexanecarboxylic acid. For the 11C-WAY radioligand only, there was an additional possible metabolite comigrating with DWAY (<2% of the parent radioligand at 10 min); however, the additional metabolite was not observed for all subjects.

PET images in 3 projections of healthy male volunteer (subject 4), obtained by summation of frames acquired from 9 to 69 min after intravenous injection of 11C-WAY and 11C-DWAY, normalized to injected dose. Subject’s right is on left in transaxial and coronal projections. Anterior is on right in sagittal projection.
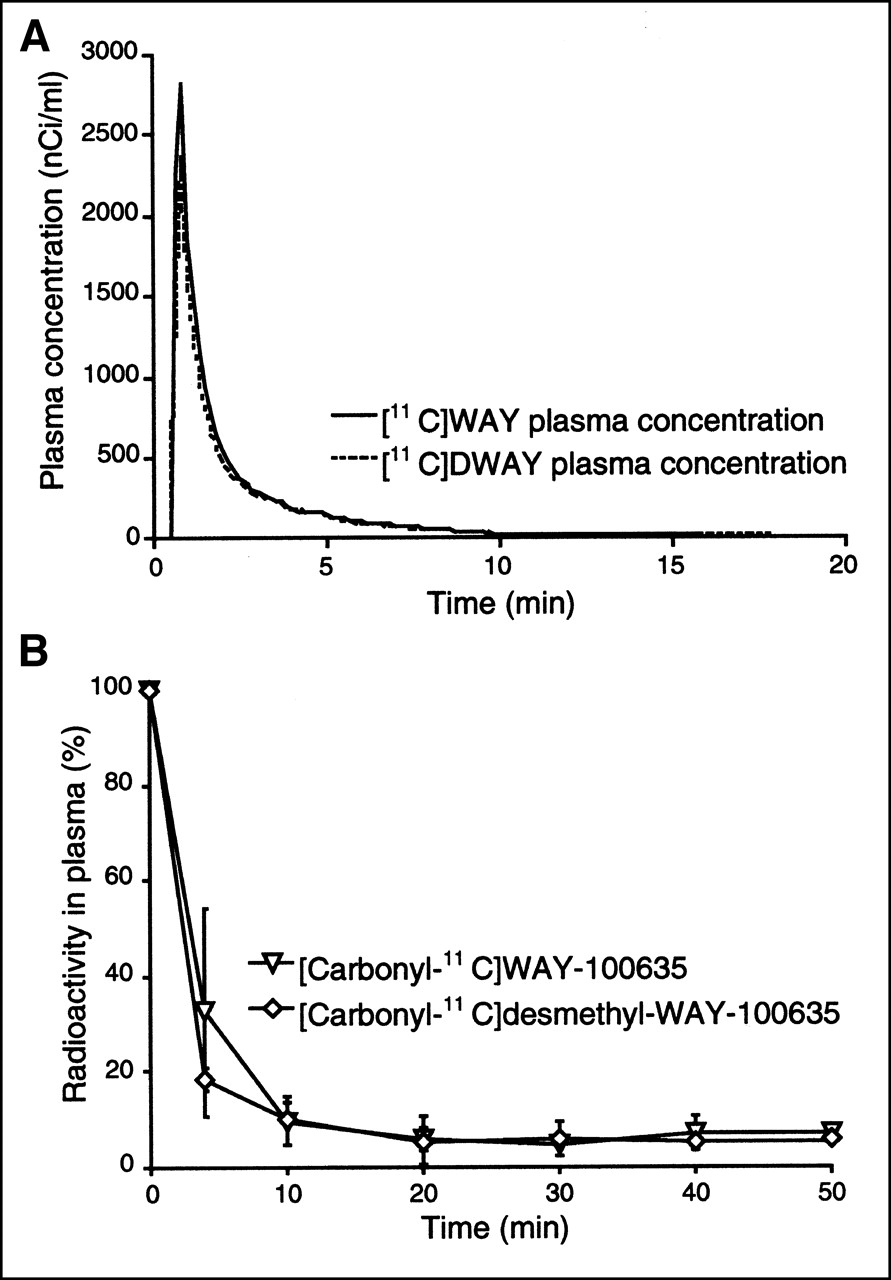
(A) Mean (n = 5) 11C-WAY and 11C-DWAY plasma concentration, normalized to injected dose and corrected for metabolites, during 69-min interval after radioligand injection. (B) Time–activity curves for fraction of radioactivity in plasma represent unchanged 11C-WAY and 11C-DWAY.
Time–radioactivity curves for the neocortical regions and raphe could be described by the 3-CM. The average rate constants obtained from the 3-CM analysis are given in Table 1. A regression analysis of the rate constants obtained for 11C-WAY and 11C-DWAY was performed on all ROIs except the cerebellum (Fig. 6A), which was analyzed separately (Fig. 6B). K1 was, on average, more than 2 times higher for 11C-DWAY, whereas the k2 was about half that of 11C-WAY. The outliers on the K1 graphs (Fig. 6A) correspond to regions of a single subject (subject 1). The nonspecific volume of distribution (Vns = K1/k2), calculated for each ROI and PET measurement, was accordingly much higher for 11C-DWAY than for 11C-WAY (Table 1), whereas k3 and k4 were similar for the 2 radioligands (Table 1; Fig. 6A). The corresponding figures for the cerebellum (Fig. 6B) were similar to the other regions in terms of K1 and k2. The ratio of k5 to k6 supported a lower nonspecific binding for 11C-DWAY than for 11C-WAY but was limited by the small number of data points.

(A) Fitted regression lines for rate constants (K1, k2, k3, and k4) for 6 central 5-HT1A receptor-rich regions determined by kinetic 3-CM analysis for 11C-WAY (x-axis) and 11C-DWAY (y-axis) at a certain radioactivity concentration. (B) Corresponding fitted regression lines for rate constants (K1, k2, k5, and k6) in cerebellum.
Parameters Obtained by Kinetic Analysis of 11C-WAY and 11C-DWAY Binding
The time–activity curve for the cerebellum was better described by the 3-CM than 2-CM for both radioligands (Table 2). At the statistical evaluation, root mean square errors, Akaike information criteria scores, and Schwartz criteria scores were lower for the 3-CM than the 2-CM (Table 2). F statistics (P [T ≤ t], 2-tailed) rejected the null hypothesis for all subjects but one (11C-DWAY, subject 4), thus excluding the possibility that radioligand uptake could be more adequately described by the 2-CM. The ratio of k5 to k6 for the cerebellum (nonspecific BP [BPns]) was lower for 11C-DWAY than for 11C-WAY (Table 2).
Comparison of 2-CM and 3-CM for Description of 11C-WAY and 11C-DWAY Binding in Cerebellum of 5 Healthy Subjects
The specific binding for all regions reached a peak within the 69-min time span of the PET measurements (Figs. 3C and 3D), thus satisfying a condition for peak equilibrium. The peak was reached earlier for 11C-WAY than for 11C-DWAY (Fig. 3).
Regional BPs obtained by the kinetic 3-CM analysis (BP3-CM), the simplified reference tissue model (BPSRTM), and the peak equilibrium method (BPEQ) are presented in Table 3 and Figure 7.

Fitted regression lines for regional BPs in 6 central regions in 5 healthy male volunteers calculated by kinetic 3-compartment analysis (BP3-CM), simplified reference tissue model (BPSRTM), and peak equilibrium method (BPEQ), respectively.
Binding Potentials for 11C-WAY and 11C-DWAY Calculated by 3 Quantitative Approaches
For both radioligands, the 3-CM gave higher values than did the simplified reference tissue model. The BP was also higher for 11C-WAY when calculated by the 3-CM than when calculated by the peak equilibrium method, whereas the opposite was found for 11C-DWAY (Fig. 7).
DISCUSSION
In each of the 5 subjects examined, radioactivity uptake in brain was rapid and high after intravenous administration of 11C-WAY and 11C-DWAY (Figs. 3 and 4). The maximal radioactivity uptake in the brain at 8 and 4 min after injection was considerably higher using 11C-DWAY (mean ± SD [n = 5], 11.2% ± 1.9%) than using 11C-WAY (4.6% ± 1.9%). The higher radioligand brain delivery and higher uptake in the cerebellum at late time points (Fig. 3) imply that 11C-DWAY should provide better imaging statistics than 11C-WAY at a given radioactivity dose injected.
Comparison of rate constants obtained by the 3-compartment analysis revealed a consistently higher K1 value for 11C-DWAY than for 11C-WAY (Table 2; Fig. 6) and a higher nonspecific volume of distribution (Vns), as shown in Table 1. The explanation for these findings may include a difference in lipophilicity, protein binding, or other factors for the 2 radioligands. Higher lipophilicity may be associated with a higher extraction of the tracer, consistent with increased delivery (K1) and increased nonspecific binding, manifested as a reduction in k2 in the 3-CM (k2 in the 3-CM is a composite rate constant that includes the volume of distribution of the nonspecific compartment). However, the lipophilicity for 11C-DWAY and 11C-WAY has been determined (36) and does not support a higher log probability value for 11C-DWAY (2.77) than for 11C-WAY (26). Another explanation is a difference in the degree of plasma proteins, which have been shown to influence radioligand delivery (K1) (22). This hypothesis could not, however, be confirmed without the associated assays, which were not determined in this study.
For both radioligands, the highest radioactivity concentration was observed in the medial temporal cortex (including the hippocampal formation), neocortex, and raphe, whereas radioactivity uptake was low but conspicuous in the cerebellar cortex (Figs. 3 and 4). The rank order for regional radioactivity is consistent with the central 5-HT1A receptor distribution previously reported for in vitro studies (7,37), for messenger RNA animal studies (31), and for postmortem human autoradiography studies using 3H-WAY and 11C-DWAY (9,18).
A possible difference in affinity for 5-HT1A receptors should be expected to give different levels of specific radioligand binding in the brain. 11C-WAY and 11C-DWAY have both been developed as putative selective antagonist radioligands with a high affinity to 5-HT1A receptor in the brain. They have not, however, been characterized using the same methods. WAY-100635 has been characterized using recombinant human 5-HT1A receptors, expressed in a Chinese hamster ovary cell line (38). Scatchard analyses have revealed a homogeneous population of 3H-WAY recognition sites (Kd = 0.32 nmol/L; Bmax = 162 fmol/mg of protein). The affinity of 11C-DWAY for the 5-HT1A receptor subtype has been reported as an IC50 value of 1.4 nmol/L in rat brain in vitro (18). Comparison of affinity data for 11C-WAY and 11C-DWAY is thus complicated by the different methods applied for the characterization of the same radioligand. A similar affinity in vivo is supported by the current observation that both radioligands provided similar BPs in regions known to contain 5-HT1A receptors. A difference in affinity of the 2 radioligands cannot, however, be excluded, because peak equilibrium was reached sooner for 11C-WAY than for 11C-DWAY (Figs. 3A and 3B).
The 3 quantitative methods gave similar BPs for 11C-DWAY and 11C-WAY (Table 3; Fig. 7) and, except in the raphe, with the same rank order for all subjects. Estimates of the regional BPs were higher when calculated by the 3-CM than by the 2 reference tissue approaches, which provided similar values (Table 3; Fig. 7) (39,40). The simplified reference tissue model and the peak equilibrium method are dependent on the cerebellum as a reference region, suggesting that the use of a reference region may provide lower BPs. This possibility calls for a critical analysis of uptake for both 11C-WAY and 11C-DWAY in the cerebellum.
For both radioligands, the 3-CM yielded a statistically better fit to the cerebellar data than did the 2-CM (Table 2), as supported by nonlinear least squares fitting analyses and statistical methods to select the most appropriate model. The higher estimates of BPs given by a kinetic 3-CM analysis (BP3-CM) than by the simplified reference tissue model (BPSRTM) or the peak equilibrium method (BPEQ) may be explained by the additional compartment in the cerebellum. This compartment will be viewed as part of the free radioligand concentration using any of the 2 reference tissue models, a simplification that will give lower BPs in regions with 5-HT1A receptors.
A basic assumption of the reference tissue model is that the reference tissue can be described by a 2-CM. However, the reference tissue could not be fitted to a 2-CM (Table 2). This observation does not, however, automatically mean that the 3-compartment analysis is better, because the compartment analysis does not include kinetically distinguishable nonspecific binding. When a 3-CM is applied, kinetically distinguishable nonspecific binding will thus contribute by unknown proportions to Cb and Cf. The handling of data that include kinetically distinguishable nonspecific binding should thus be viewed as an accuracy problem in most currently applied quantitative approaches.
The fraction of plasma radioactivity corresponding to each of the 2 unchanged compounds, 11C-WAY and 11C-DWAY (Fig. 5A), was determined with HPLC for each subject and PET measurement, as described previously (11,13). Metabolism was rapid for both radioligands (Figs. 5A and 5B). For 11C-WAY, the additional metabolite, which comigrated with reference DWAY, was previously estimated to be <2% of the parent radioligand. The value is low, but so is the percentage of 11C-WAY remaining at 10 min (13). A small fraction of radiolabeled DWAY may be a reason for the higher BPns with 11C-WAY than with 11C-DWAY. Given the common formation of the 11C-cyclohexanecarboxylic acid (11) using 11C-WAY as well as 11C-DWAY, this labeled metabolite may explain the need for a 3-CM to describe cerebellar radioactivity in kinetic analyses for both radioligands.
The main objective of this study was to evaluate prospects for using 11C-DWAY as an alternative to 11C-WAY. We used 3 analytic methods as tools to describe the new radioligand in this first study on humans. The set of methods was not primarily used to choose the best method for applied studies with any of the tracers. Studies on larger samples are required for that purpose. However, taking advantage of such information from studies with the reference ligand 11C-WAY, we have approached the demand by inclusion of a new figure (Fig. 7). From such a comparison of BPs derived from invasive (3-CM) and noninvasive (peak equilibrium and SRTM) reference tissue models using the cerebellum as reference region and input function, respectively, use of a noninvasive method can be recommended for studies in which interindividual differences in nonspecific binding are of little concern. Similarly, BPs derived from the distribution volume using a plasma input may be recommended if there are concerns about changes in nonspecific binding and if measures for plasma protein binding are available.
CONCLUSION
The 11C-DWAY PET radioligand provides 2-fold higher brain uptake than does 11C-WAY. This is a putative advantage over 11C-WAY for quantification and labeling of 5-HT1A receptors in the human brain, implicating better imaging statistics and advantages in biomathematic modeling. Differences in lipophilicity or protein binding are suggested as plausible explanations for the difference in brain uptake between the 2 radioligands. The beneficial metabolism of 11C-DWAY, which limits the formation of possible active metabolites, and a smaller kinetically distinguishable nonspecific binding compartment in the cerebellum for 11C-DWAY than for 11C-WAY, which is indicated by a kinetic 3-CM analysis, further support the suitability of 11C-DWAY as a PET radioligand for measures of 5-HT1A receptors in the human brain.
Acknowledgments
The assistance of the members of the Karolinska PET Center is gratefully acknowledged. This study was supported by the Human Frontier Science Program Organization (grant RGO235/1998-B), the National Institute of Mental Health (grant Ro1 MH41205-13), the Swedish Medical Research Council (grant 09114-11A), and the Stockholm County Council.
Footnotes
Received Feb. 5, 2001; revision accepted Dec. 3, 2001.
For correspondence or reprints contact: Bengt Andrée, MD, PhD, Psychiatry Section, Department of Clinical Neuroscience, Karolinska Hospital, Karolinska Institutet, S-17176 Stockholm, Sweden.
E-mail: bengt.andree{at}ks.se


