


Abstract
The purpose of this study was to evaluate the accuracy of image coregistration of PET and CT (PET/CT) images in patients with lung lesions and the influence of the breathing protocol during CT. Methods: Seventy-five patients with a solitary and well-circumscribed pulmonary lesion (non-small cell lung cancer; size, 10–30 mm) underwent PET/CT on a combined scanner. CT was acquired during shallow breathing in 37 patients and during normal expiration (i.e., the level reached when the patient exhaled without forcing expiration and then held the breath) in 38 patients. The volume of interest of each lesion was defined separately on PET and CT images, and the geometric center of gravity (COG) was assessed. The distance of COGs between the PET image and the CT image was measured. All lesions were classified according to 4 lung regions: apical, peripheral, central, and lung base. The mismatch between COGPET and COGCT was compared between regions and patient groups using a 2-way ANOVA with the Bonferroni-Dunn test for post hoc comparisons. Results: The range of COG distance between PET and CT was 1.7–5.4 mm in the apex, 0.5–14.7 mm in the periphery, 0.7–5.9 mm centrally, and 2.9–11.3 mm in the lung base. The match between PET and CT was significantly better in patients who had the CT scan obtained during normal expiration than in patients who performed shallow breathing during CT scanning (P = 0.024). No reciprocal effects were found (interaction P = 0.76). The mismatch of lesions depends significantly on lung region (P < 0.0001). Post hoc analysis showed a significant difference between the upper 2 regions and the lower 2 regions (all P ≤ 0.002) but not between the apex and the central region (P = 0.95) and between the peripheral region and the lung base (P = 0.15). The lesion size had no influence on the COG mismatch. Conclusion: The match of lung lesions in coregistered PET/CT images is better when acquiring the CT scan during normal expiration. The coregistration accuracy is better in the upper and central parts of the lung. The normal expiration protocol is suggested to be superior to shallow breathing during CT scanning.
The coregistration of nuclear medicine studies with structural information obtained by radiologic methods allows the precise correlation of molecular and anatomic data in the same image. Significant gains in diagnostic accuracy and observer confidence can be achieved with the coregistration of data provided by 2 different imaging modalities. Using 18F-FDG uptake as an indicator of cancer activity, recent investigations of PET indicate its overall potential as an excellent sensitive and specific tool in diagnosing and staging patients with thoracic malignancies (1). With the recent introduction of combined PET/CT scanners, the quality of an imaging study will be compromised if coregistration errors occur (2). Such errors can deteriorate the final image quality and lead to wrong anatomic positioning and even misinterpretation of lesions. In the thorax, respiratory movements can limit the quality of coregistered studies and, therefore, the CT scan has to be acquired during a respiration position that matches that of the PET image. It is obvious that a CT scan obtained during maximum inspiration or maximum expiration position will not optimally fit to the PET scan, which is acquired during several minutes in a patient who breathes normally. As an alternative breathing protocol, CT can be performed during shallow breathing or during a normal expiration level. This respiration level is reached when the patient first inhales and then exhales without forcing expiration and then holds his or her breath in this position.
The aim of this study was to evaluate the accuracy of 3-dimensional PET/ CT image coregistration of pulmonary lesions in patients with non-small cell lung cancer (NSCLC). In addition, the coregistration accuracies of PET/CT studies based on CT scans obtained during shallow breathing and during a normal expiration level were compared in 2 patient groups.
MATERIALS AND METHODS
Patients
Seventy-five patients (45 men, 30 women; age range, 18–85 y; mean age, 64 y) with solitary pulmonary lesions caused by NSCLC, who were examined in a routine clinical setup for the purpose of tumor diagnosis, staging, or follow-up, were enrolled in the study. Patients were selected when they had a pulmonary lesion that was clearly visible on CT and also showed a marked 18F-FDG uptake on PET imaging. Only patients with a solitary and well-circumscribed and homogeneous lesion were selected.
In a first group of 37 patients (21 men, 16 women; age range, 46–82 y; mean age, 64 y) the CT scan used for PET/CT image coregistration was acquired during normal, shallow breathing. In a second group, which consisted of 38 patients (24 men, 14 women; age range, 18–85 y; mean age, 64 y), the CT scan was acquired during the normal expiration position. Normal expiration was defined as the level reached when the patient exhaled without forcing expiration and then held his or her breath. Patients were instructed in this respiration task and it was rehearsed with all patients of the second group.
Image Acquisition
All data acquisition was performed on a combined PET/CT in-line system (Discovery LS; General Electric Medical Systems, Waukesha, WI). In this dedicated system, an Advance NXi PET scanner (General Electric) and a multislice helical CT scanner (LightSpeed Plus; General Electric) are integrated, which allows the acquisition of “hardware” coregistered CT and PET images in 1 session. Patients fasted for at least 4 h before scanning, which started approximately 45 min after the injection of 300–400 MBq 18F-FDG. The supine patients were examined if possible with the arms above the head. First, the CT scan was acquired starting at the level of the head and using the following parameters: 80-mA tube current, 0.5 s per tube rotation, 140-kV tube voltage, helical pitch of 6, reconstructed slice thickness of 4.25 mm with 4 simultaneous slice acquisitions, and a scan length of 867 mm. These parameters resulted in a data-acquisition time of 22.5 s. In both groups the CT scan was acquired using the same parameters and without application of intravenous contrast medium. Immediately after the CT acquisition, a PET emission scan was acquired starting at the pelvic floor. PET scans were obtained using an acquisition time of 4 min for the emission scans per cradle position, with a 1-slice overlap at the borders of the field of view (FOV) to avoid artifacts. The PET camera has a 14.6-cm axial FOV and, because PET data were smoothed using an 8-mm gaussian filter, the final resolution after reconstruction was approximately 10-mm full width at half maximum (FWHM) at the center of the FOV. During image acquisition patients were under supervision of a technician.
Image Coregistration and Reconstruction
The combined in-line PET/CT system permitted acquisition of perfectly matched data by automated table movement from the CT to the PET gantry. In phantom studies, a hardware coregistration of <1 mm was achieved by the combination of a mechanical adjustment of the 2 gantries and electronically adjusting the 3 spatial offset parameters. No further patient-specific software image coregistration was required to obtain the final matched data.
The CT scans also served for attenuation correction. They were first reduced to the PET resolution by smoothing with a gaussian filter of 8-mm FWHM, and then the CT pixel values (in Hounsfield units [HU]) were transformed into linear attenuation coefficients (in cm−1) at 511 keV by a bilinear function defined by the 3 coordinates (−1,000 HU, 0 cm−1), (0 HU, 0.0933 cm− 1), and (+1,326 HU, 0.172 cm−1). The PET data were reconstructed using a standard iterative algorithm (ordered-subsets expectation maximization, 2 iterative steps). The acquired images were viewed with software providing multiplanar reformatted images of PET, CT, and fused data with linked cursors (eNtegra 3.0215; General Electric Medical Systems, Haifa, Israel).
Measurements
All measurements were done using commercially available software (pmod, version 2.3; www.pmod.com) (3). Regions of interest were drawn in consecutive slices around the morphologic lesion on the CT scan (soft-tissue windowing) and the corresponding region with increased 18F-FDG uptake on the PET scan, and a 3-dimensional volume of interest (VOI) was defined. Patients had only lesions with a size of 10–30 mm, as measured on the CT scan, to reduce the bias in measurements resulting from the difference in geometric configuration of lesions on both scans. All measurements were performed by the same experienced nuclear medicine physician. The location of a lesion in the patient coordinate system was assumed to be represented by the geometric center of gravity (COG) of the corresponding VOI and calculated from the VOI definition after replacing the effective pixel values by a constant. The COG is defined for a collection of masses and corresponds to the point where all of the weight of an object can be considered to be concentrated. In this study, a VOI was considered to be equivalent to a collection of masses and the COG served as the reference point in the VOI. The distance between the lesions in PET and CT was obtained by calculating the distance of the respective COGs (COGPET and COGCT) in the patient coordinate space.
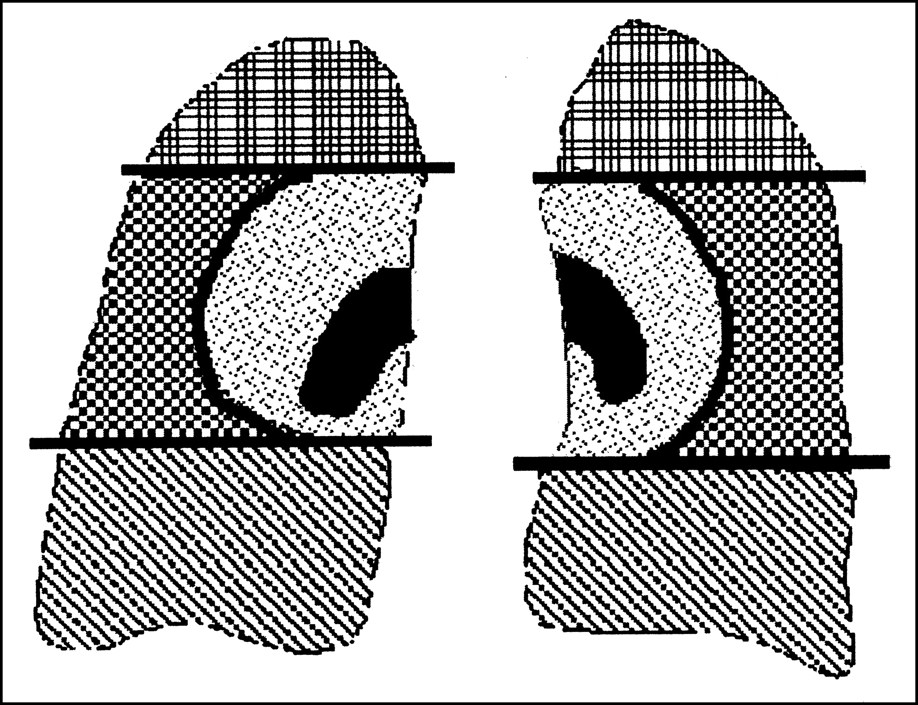
The studied lesions were classified according to their anatomic location in the lung into 4 different regions: lung base, peripheral, central, and apical (Fig. 1). In addition, the lesions were categorized according to their volume: small lesions (1–9.6 cm3), medium-sized lesions (9.7–18.3 cm3), and large lesions (18.4–27 cm3). A lesion with a maximum diameter of approximately 30 mm had a maximum volume of approximately 27 cm3. The distribution of small, medium-sized, and large lesions was analyzed in the 2 groups and in the 4 lung regions to identify the relationship between the COG mismatch and the size of a lesion.

Four different lung lesions: apex, peripheral, central, and base of lung. Lesions were visually associated with a region. Apex corresponds to approximately upper 25% of lung and base corresponds to lower 25% of lung. Central was defined as area surrounding lung hila up to half of distance between hila and lateral border of lung. Peripheral was remaining lateral, anterior, and posterior space around this central area.
Statistics
The mismatch between COGPET and COGCT was expressed as mean ± SD. For statistical analysis, the measured mismatches were square-root transformed to achieve an approximately normal distribution. The 2 patient groups and different regions were compared using a 2-way ANOVA with the Bonferroni-Dunn test for post hoc comparisons. Simple regression was performed to estimate the dependency of COG incongruence on lesion size.
RESULTS
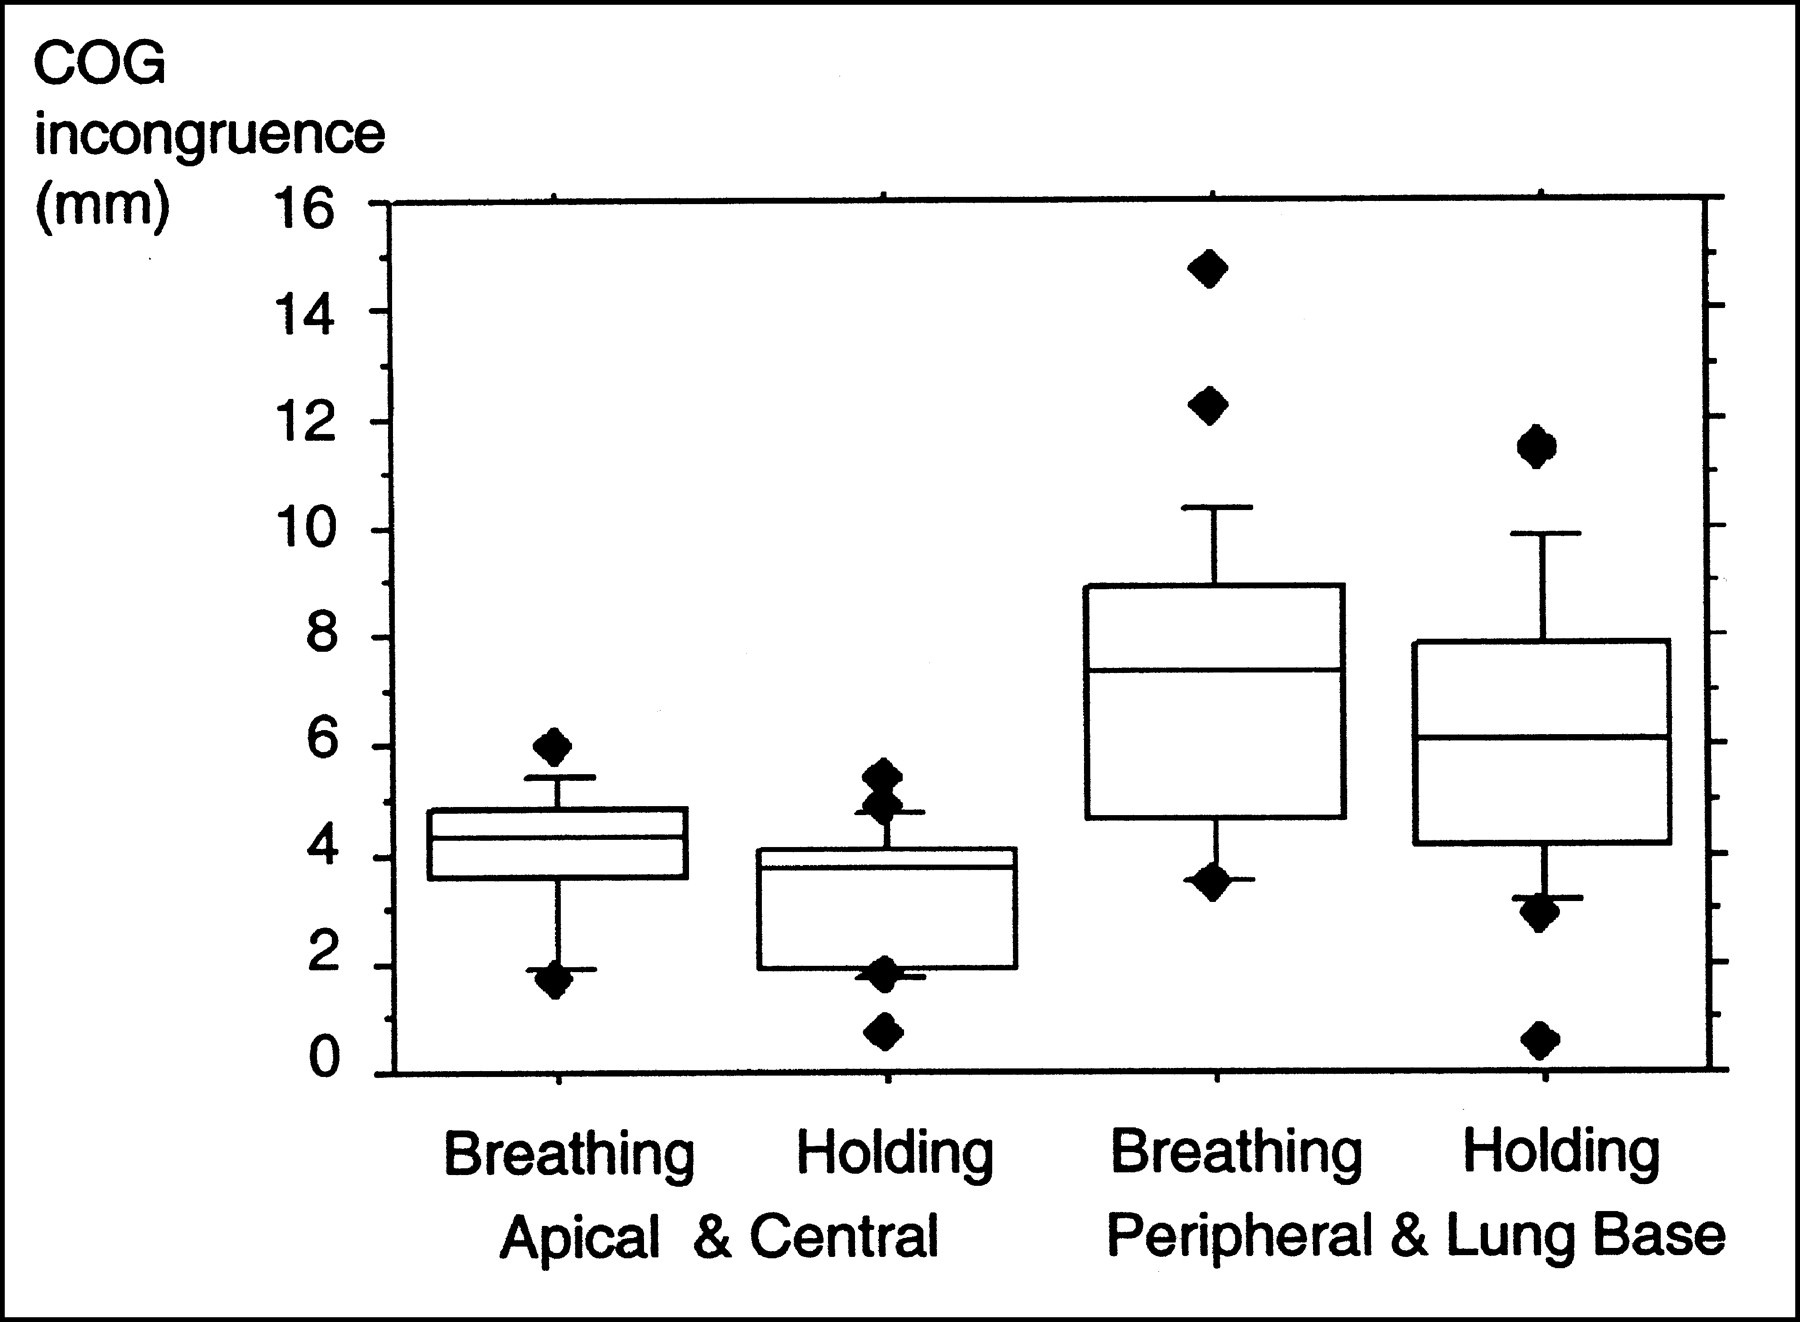
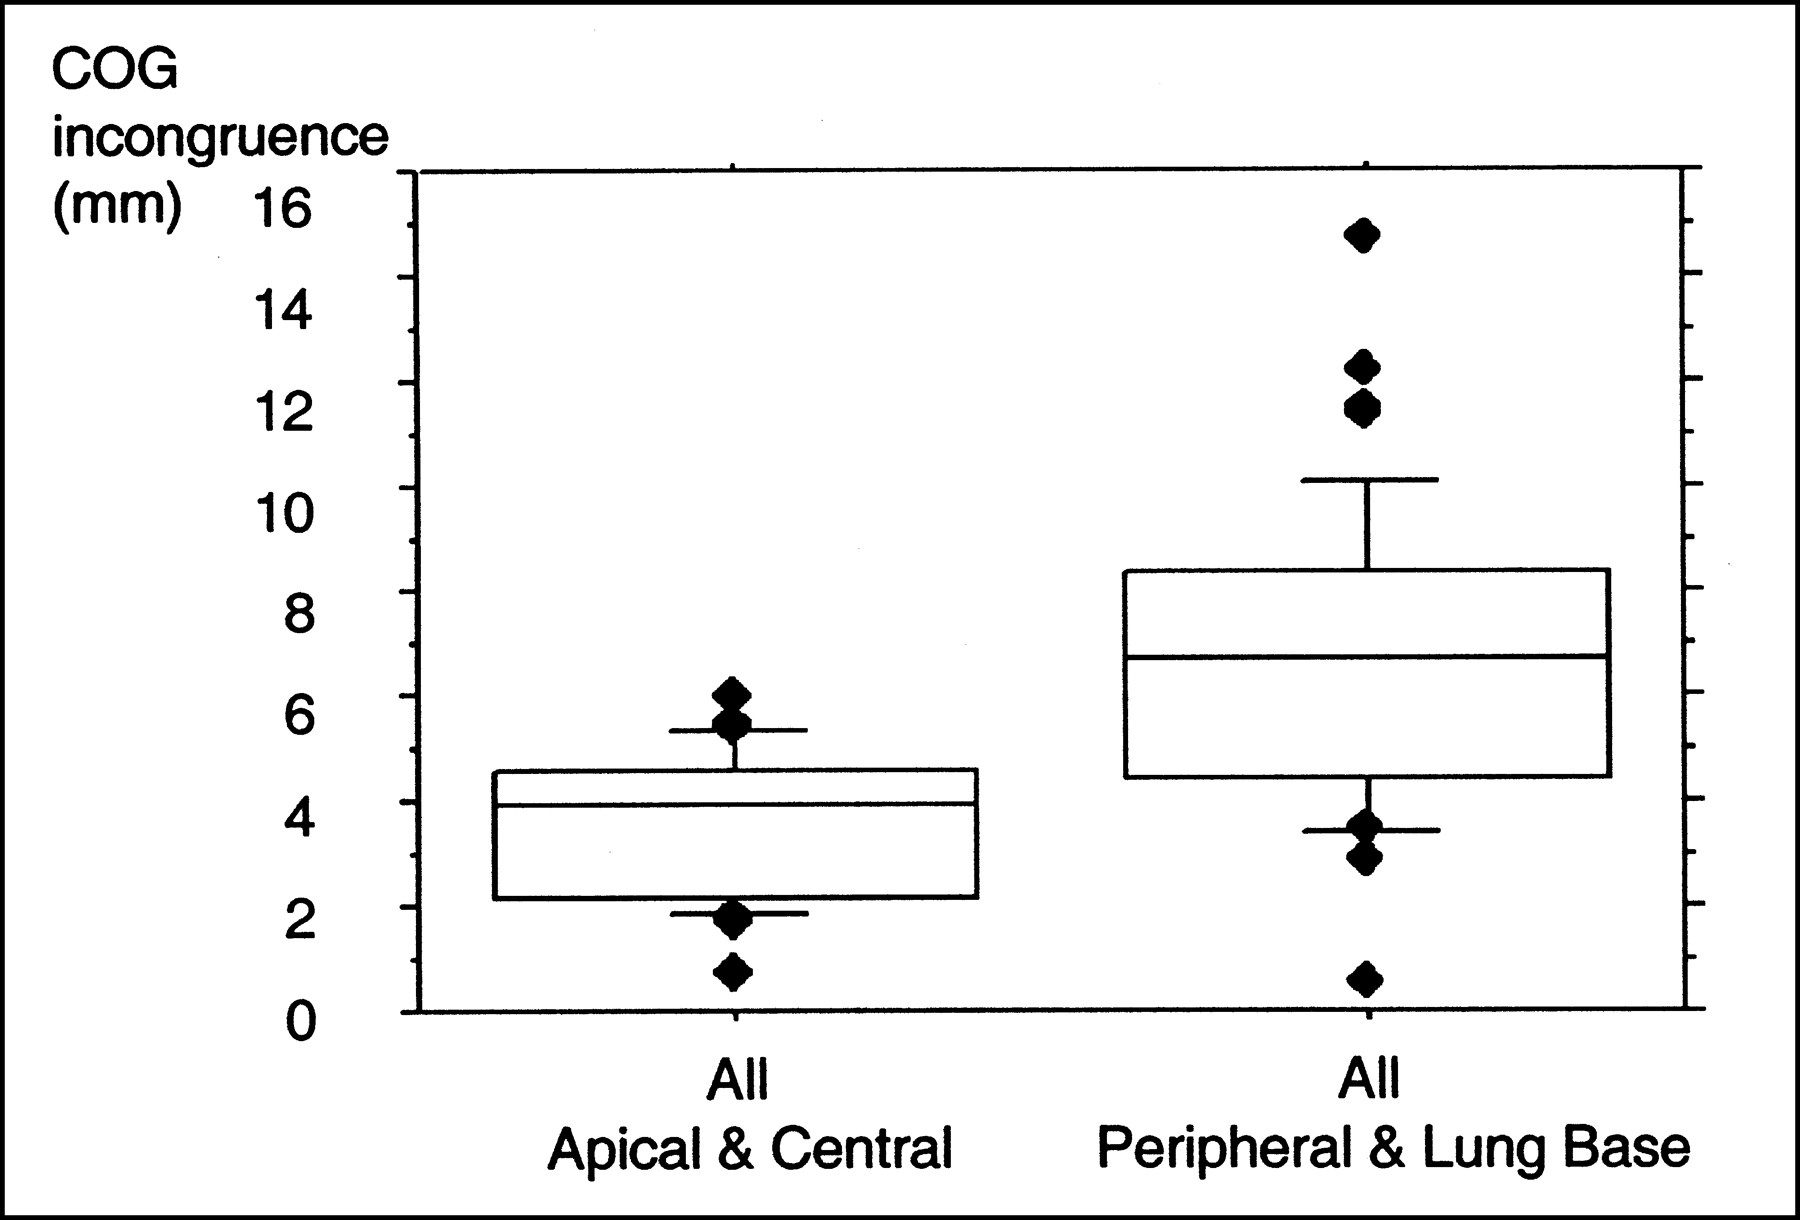
The mean ± SD of the mismatch between COGPET and COGCT in the different lung regions is summarized in Table 1. The range of the measured values is illustrated in Figure 2. Taking both patient groups together, the range of COG distance between PET and CT was 1.7–5.4 mm in the apex, 0.5–14.7 mm in the periphery, 0.7–5.9 mm in the central areas, and 2.9–11.3 mm in the lung base. Relatively higher mean values of COG incongruence were found with lesions located in the base of the lung or in the peripheral lung zones (Table 1; Fig. 2). In contrast, central lesions and apical lesions showed remarkably lower values (Table 1; Fig. 2). When pooling the apical lesions with the central lesions and the peripheral lesions with the lesions found in the lung base, it became even more evident that lesion mismatch was marked in the base and in the peripheral parts of the lung (Figs. 3 and 4). Table 2 gives a summary of the measured mismatch values for the different areas in the 2 groups.
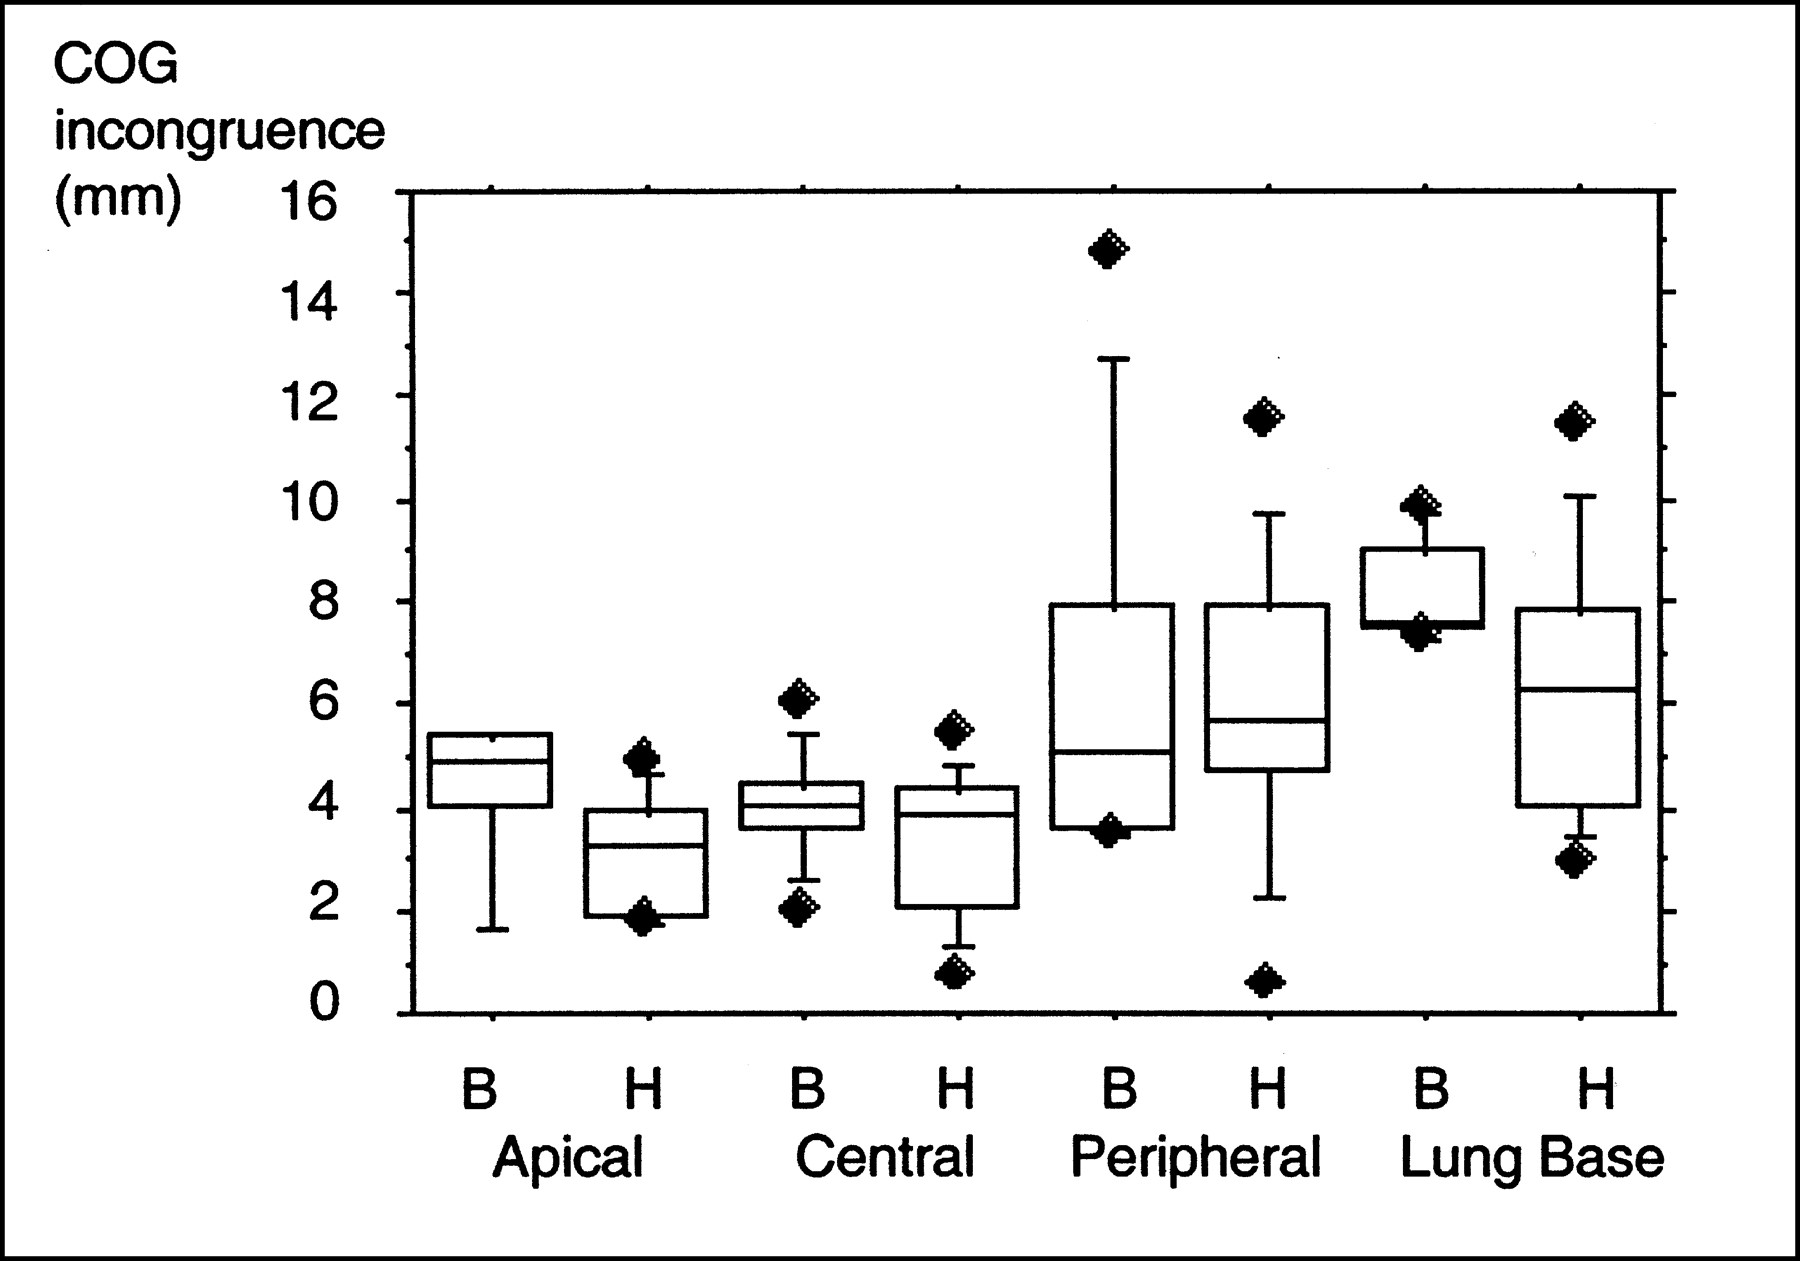
Box plot illustrates incongruence of COGs for all lung lesions in 4 different regions and for 2 patient groups. In this graph each box is composed of 5 horizontal lines that display the 10th, 25th, 50th, 75th, and 90th percentile. Diamonds indicate 95% confidence interval around median. B = group that breathed normally during CT scanning; H = group that held its breath in normal expiration level.

Box plot illustrates that incongruence between PET and CT for lesions in apex and in central parts of lung is less than that for lesions in periphery and in base of lung. This is the case with both respiration protocols: Breathing = group that breathed normally during CT scanning; Holding = group that held its breath in normal expiration level. Refer to legend to Figure 2 for explanation of horizontal lines and diamonds.

Taking both patient groups together, discrepancy of COGs between upper and central parts and lower and peripheral parts of lung is even more evident. Box plot shows that PET/CT match of lesions is worse in base and in periphery of lung. Refer to legend to Figure 2 for explanation of horizontal lines and diamonds.
COG Incongruence of 4 Lung Regions
COG Incongruence: Upper and Central Parts vs. Peripheral and Lower Parts of Lung
Of the studied lesions, 94.6% revealed COGs of <10 mm. Forty-two percent of all COGs in the 2 groups were 0–5 mm, 38.6% were 5.1–10 mm, and 4 lesions (5.4%) had incongruence of >10 mm: In the group with shallow breathing, 2 lesions located in the anterolateral parts of the left lung and in the right middle lobe, and in the group with expiration arrest, 2 lesions, one in the peripheral region and one in the base of the lung, showed a larger COG mismatch of 11.3–14.6 mm (Table 3).
Number of Lesions for Different Levels of Incongruence
Considering the different volumes of the lung regions, small, medium-sized, and large lesions were evenly distributed in both lungs (Table 4). Simple regression revealed no dependency of lesion size on COG incongruence: R2 was 0.029 in the shallow breathing group and 0.005 in the normal expiration group. Thus, no correlation was found between lesion size and COG incongruence for both groups.
Distribution of Lesions as Defined by Size
Statistical analysis using a 2-way ANOVA revealed that the match between PET and CT was significantly better in patients who had the CT scan obtained during normal expiration than that in patients who performed shallow breathing during CT scanning (P = 0.024). No reciprocal effects were found (interaction P = 0.76), and the respiration protocol of the normal expiration group revealed a better match between lesions on PET and CT images for all lung regions (Fig. 2). Incongruence of lesions depends significantly on the lung region (P < 0.0001). Post hoc analysis did not show any significant difference between the apex and the central region (P = 0.95) and between the peripheral region and the lung base (P = 0.15). However, a significant difference was found between the upper 2 regions and the lower 2 regions (all P ≤ 0.002), underlining the fact that the match of lung lesions in PET and CT is better in the upper and central parts of the lung (Figs. 3 and 4).
Examples of the adequate coregistration quality of PET/CT for a peripheral lesion and a lesion located at the base of the lung are given in Figures 5–7.
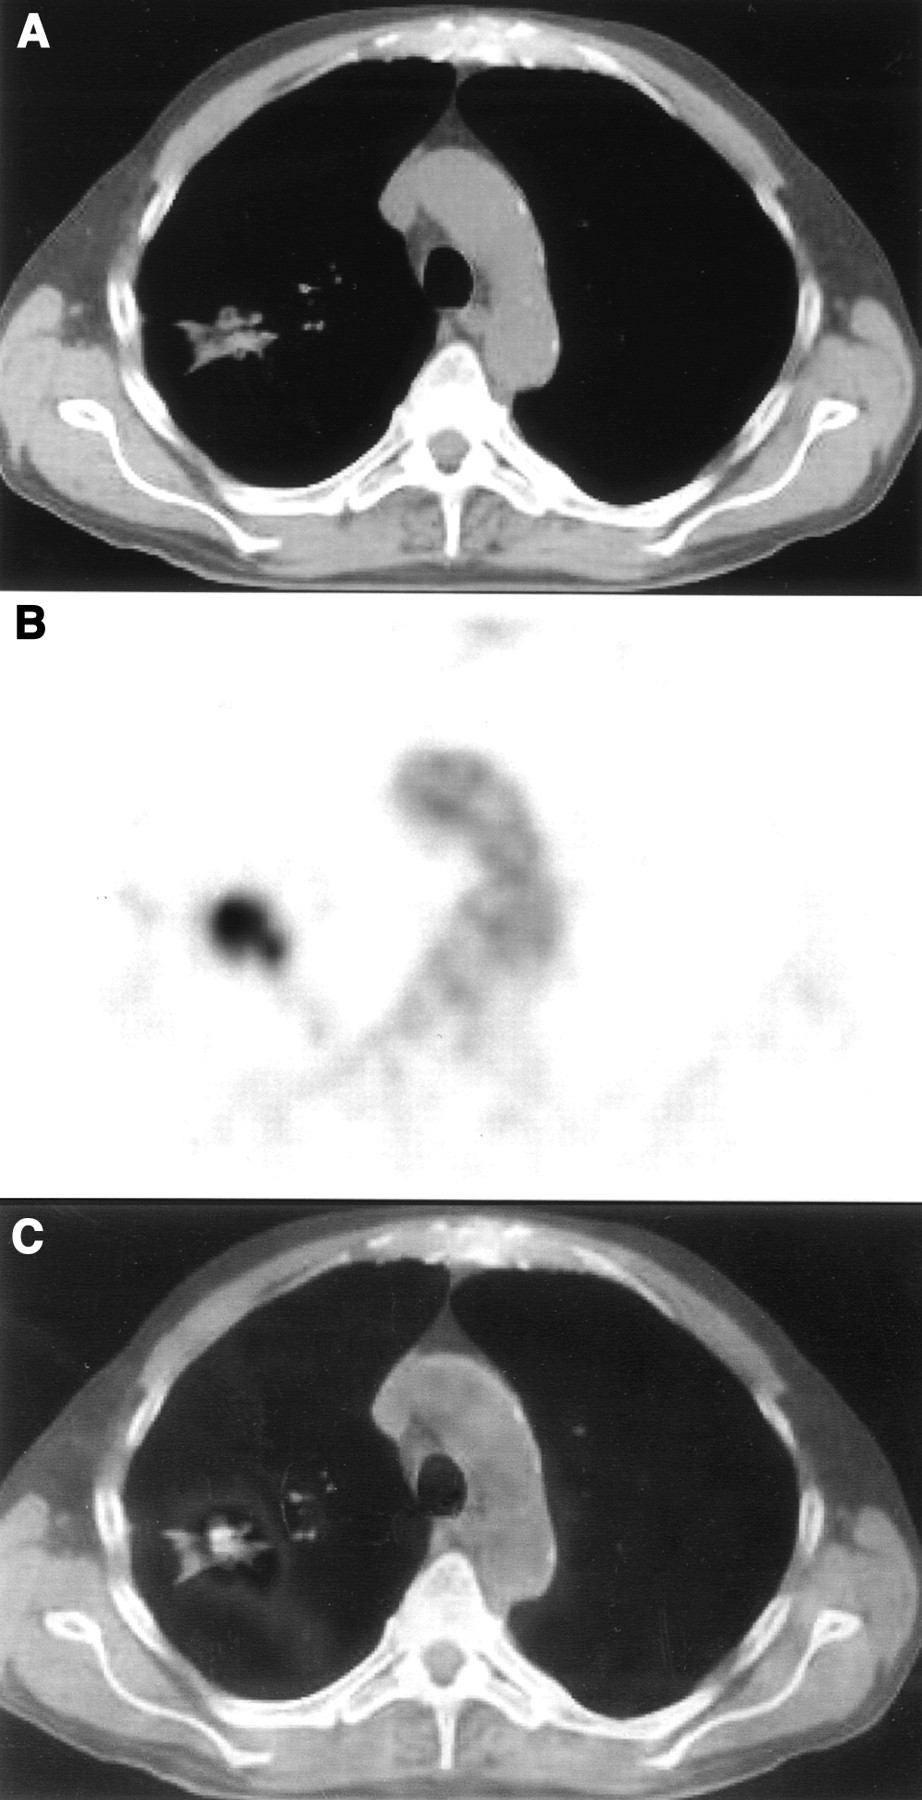
Patient with solitary lung lesion caused by NSCLC in upper peripheral part of right lung. Coregistration of CT (A) and PET (B) images is visually adequate, but measured incongruence was 1.8 mm. This is due to different shapes of lesions, with more star-like appearance on CT and roundly shaped lesion on PET. (C) Final coregistered PET/CT image.
DISCUSSION
This study shows that, for combined PET/CT imaging on an in-line scanner, the accuracy of image coregistration of lung lesions is better in patients who underwent CT scanning during normal expiration than that in patients who performed shallow breathing during CT scanning (P = 0.024).
Using the normal expiration level as the routine respiration protocol for CT scanning, the patients revealed a better match between PET and CT images in all lung regions. This is in line with previous work in which the distances between a reference point on the vertebral column and the anatomic landmarks diaphragm, thoracic wall, and the lung apex were measured and the best match between PET and CT was found when the CT scan was acquired during normal expiration (4). Furthermore, the match between PET and CT depends on the location of the lesion in the lung. Lesions in the periphery and in the base of the lung exhibit larger mismatches of PET/CT coregistration than that of lesions that are located in the apices or in the central regions of the lung. This finding is not surprising and is in accordance with respiratory physiology: The caudal and peripheral parts of the lung have a larger range of respiration-induced movement than that of the central regions of the lung or the apices. This is also a well-known problem in radiation therapy planning using CT, and a previous report has described large movements of intrathoracic tumors for lesions in the base of the lung (5). It has also been suggested that in radiation therapy treatment planning, CT should be acquired during the state of ventilation in which the patient spends most of the time—that is, normal exhalation (6).
The COG approach always showed an inherent mismatch between a lesion in PET and CT. This is not surprising, because the structural geometry of a lesion does not correspond to the metabolic “geometry” obtained by 18F-FDG uptake. A case underlining this inherent discrepancy between PET and CT images is shown in Figure 5: Although the match of lesions in PET/CT is good, there is a difference of shape between 18F-FDG uptake and the structural lesion on the CT scan. This leads to a difference between the COGs measured in CT or PET. This study included patients with only solitary lung lesions of 10–30 mm to minimize this effect. However, the analysis of lesion size revealed that the volume of a lesion did not influence the measurement of a COG mismatch. Therefore, the COG mismatch reflects the different location of a lesion between PET and CT images and the difference between lesion shapes as seen on PET and CT images. The mismatch between the COGs of PET and CT was less than the lower limit of lesion size (10 mm) for most pathology (95.4%). With an estimated clinical resolution of the scanner of about 6 mm, 65% of all lesions were below this size. Considering the gaussian filtering for smoothing, 84% of all lesions were <8 mm. This indicates that coregistration accuracy using this combined PET/CT scanner is adequate. It is likely that most lung lesions at least partially superimpose onto the coregistered PET/CT images (Fig. 5).
For lesions located in the lung and surrounded by normal lung tissue, this coregistration accuracy seems to be adequate. However, if a lesion is located adjacent to the pleura, the mismatch of image coregistration can cause problems. A mismatch of >10 mm could lead to an erroneous placement of a lesion that is located, for example, in the lung tissue into adjacent structures such as the liver or a rib. This problem can be overcome by careful image analysis with visual control of the quality of image coregistration. In this study such large coregistration errors were uncommon (4/77 lesions), and all lesions with intrapulmonary locations using PET were also in the lung parenchyma on the CT images.
It is important to instruct patients before the examination and to ensure that they cooperate during CT scanning. This will reduce the likelihood of acquiring the CT scan in a wrong respiration position. Even small mismatches of only a few millimeters can lead to problems if a peripheral lesion seems to invade adjacent structures. Examples of adequate coregistration of PET/CT images at the base of the lung are shown in Figures 6 and 7: Using PET/CT imaging, a direct infiltration of the lesion into the diaphragm cannot be ruled out.
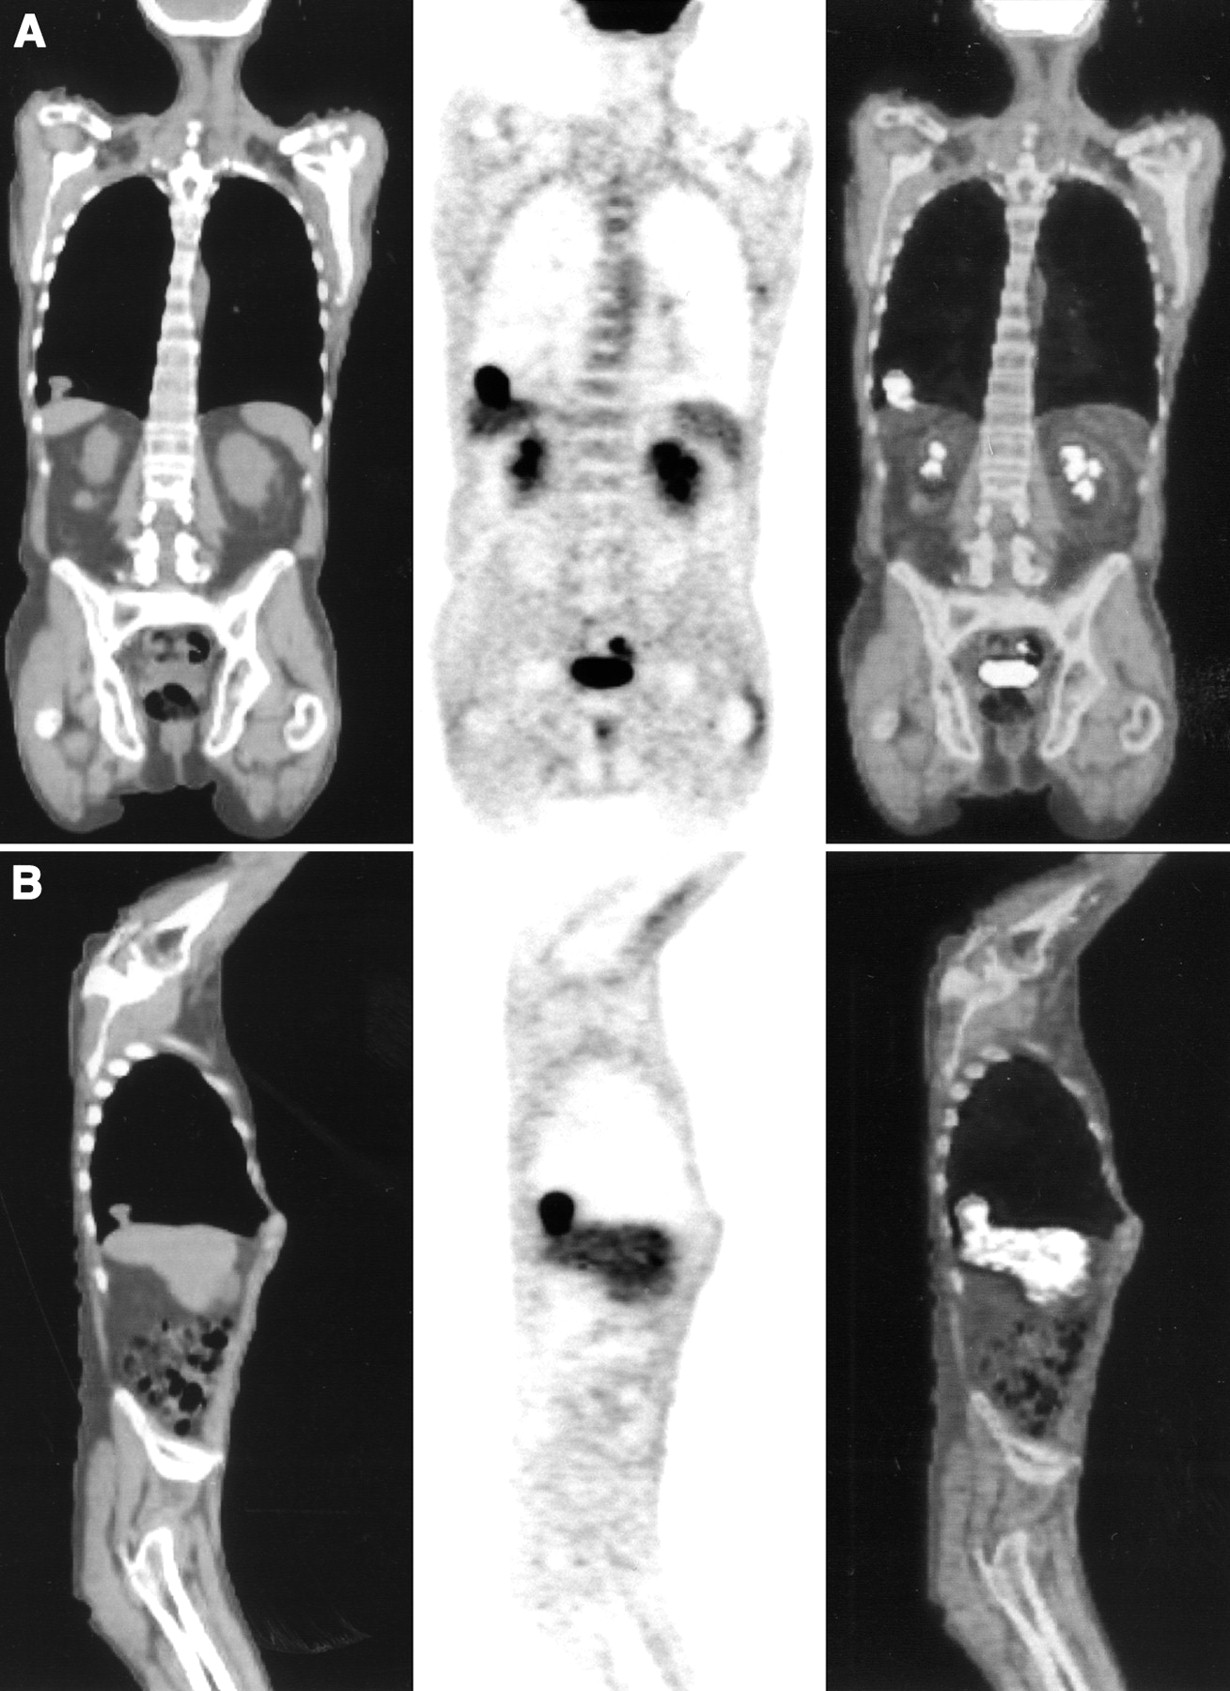
Coronal (A) and sagittal (B) CT (left), PET (middle), and PET/CT (right) images of patient with solitary lung lesion adjacent to diaphragmatic pleura just above liver. Lesion seen on PET image seems to be larger than lesion visible on CT image with soft-tissue windowing. Lesion cannot be discriminated from pleura or liver and direct infiltration is not ruled out with this image, although 18F-FDG uptake in lung lesion is higher than normal liver uptake.

Same lesion as in Figure 6 in transversal view. On CT image with lung window (A) lesion is larger and fits better to size seen on 18F-FDG PET image (B). (C) Incongruence in this case was measured as 6.2 mm because shape of lesion was measured on CT images with soft-tissue windowing. (D) There is perfect match of lesion on coregistered PET/CT image of this patient, who performed normal expiration protocol during CT scanning.
A potential drawback of the normal expiration protocol is the increased workload for the technical personnel because they have to explain the protocol and train the patient to perform this task. In this study all patients were able to perform this breathing protocol. However, it still can be difficult for a patient to hold his or her breath in the normal expiration position during CT scanning. Therefore, we began to have the patients breathe deeply several times before acquisition of the CT scan. This increases oxygenation and helps the patient to maintain the normal expiration position. Future studies will need to assess whether the performance of the normal expiration protocol can be facilitated, for example, by adding oxygen.
On the basis of these data, we believe that the improved coregistration accuracy obtained with the normal expiration protocol will also translate into a clinical benefit. The correct localization of 18F-FDG-avid lesions facilitates image interpretation. This seems to be a minor problem in patients with a solitary lung lesion but could become more important in patients with complex lesions. In patients with peripheral lesions adjacent to the pleura, a more precise coregistration could improve staging and, eventually, treatment planning. However, future studies have to evaluate whether integrated PET/CT imaging will provide more clinical impact than the combination of conventional PET and CT imaging.
CONCLUSION
Our study suggests that PET/CT image coregistration of lung lesions can be improved by acquisition of the CT scan during normal expiration. We recommend instruction of the patient before scanning to control the performance of the breathing task and to meticulously analyze CT images regarding lesion location.
Acknowledgments
The authors gratefully acknowledge Thomas Berthold for his help in scanning the patients. This work has been supported by an award of the Research and Education Fund of the European Association of Radiology and by the Federal Commissions for Scholarships, Berne, Switzerland.
Footnotes
Received Feb. 15, 2002; revision accepted Jul. 9, 2002.
For correspondence contact: Gerhard W. Goerres, MD, Division of Nuclear Medicine, University Hospital Zurich, Raemistrasse 100, CH-8091 Zurich, Switzerland.
E-mail: gerhard.goerres{at}dmr.usz.ch
In this issue


Jump to section
Related Articles
Cited By...
- Improving the Spatial Alignment in PET/CT Using Amplitude-Based Respiration-Gated PET and Patient-Specific Breathing-Instructed CT
- Value of 4-Dimensional 18F-FDG PET/CT in the Classification of Pulmonary Lesions
- Use of H215O-PET and DCE-MRI to Measure Tumor Blood Flow
- Latest Advances in Molecular Imaging Instrumentation
- Postacquisition Detection of Tumor Motion in the Lung and Upper Abdomen Using List-Mode PET Data: A Feasibility Study
- Imaging and Oncologic Drug Development
- Automated 3-Dimensional Elastic Registration of Whole-Body PET and CT from Separate or Combined Scanners
- Attenuation Correction of PET Images with Respiration-Averaged CT Images in PET/CT
- The CT Motion Quantitation of Lung Lesions and Its Impact on PET-Measured SUVs
- Automated 3-Dimensional Registration of Stand-Alone 18F-FDG Whole-Body PET with CT