


Abstract
To evaluate the appropriate model for calculating regional cerebral blood flow (rCBF) with PET and H215O, the values obtained from 1- and 2-compartment analyses were compared. Methods: Dynamic PET scans were performed on 12 healthy volunteers after injection of H215O in 2 conditions of baseline and visual stimulation. Calculation of rCBF was performed using the 2-weighted integral (WI) and autoradiographic methods for the 1-compartment analysis, and the 3-WI method was followed for the 2-compartment analysis. Arterial blood radioactivity was counted continuously and corrected for delay and dispersion. The rCBF images were transformed into the Talairach space and analyzed by statistical parametric mapping to identify regional differences in the 2 methods. The values obtained from regions of interest also were compared. Results: Although the difference in global CBF between the 2 models was not significant, rCBF values in the large arteries and neighbor areas were significantly greater in the 2-WI method than in the 3-WI method. However, regional differences in the activation studies were not affected when the 2 methods were compared. The images of cerebral arterial blood volume (V0) obtained by the 3-WI method showed a significant increase in V0 in the visual cortex during visual stimulation. Conclusion: These results suggest that the rCBF values in the 1-compartment analysis were affected by radioactivity in the vessels. The 3-WI method could provide rCBF values that are less influenced by vascular radioactivity and also show differences in V0 in PET activation studies.
- cerebral blood flow
- arterial blood volume
- weighted integral method
- autoradiographic method
- statistical parametric mapping
Over the past 2 decades, several procedures for measuring regional cerebral blood flow (rCBF) have been introduced, and each institution seems to have established its own method for rCBF calculation. Even in the measurement of absolute values of rCBF with new methods, H215O and PET studies are considered the standard method of evaluating the results of other methods, such as microsphere tracers in SPECT or PET studies (1–3). However, the H215O and PET studies have several methods for calculating rCBF values. The purpose of this study was to evaluate rCBF values in the brain tissue and vascular area separately, and to compare the rCBF values measured by methods based on 2 kinds of compartment modeling (1- and 2-compartment models).
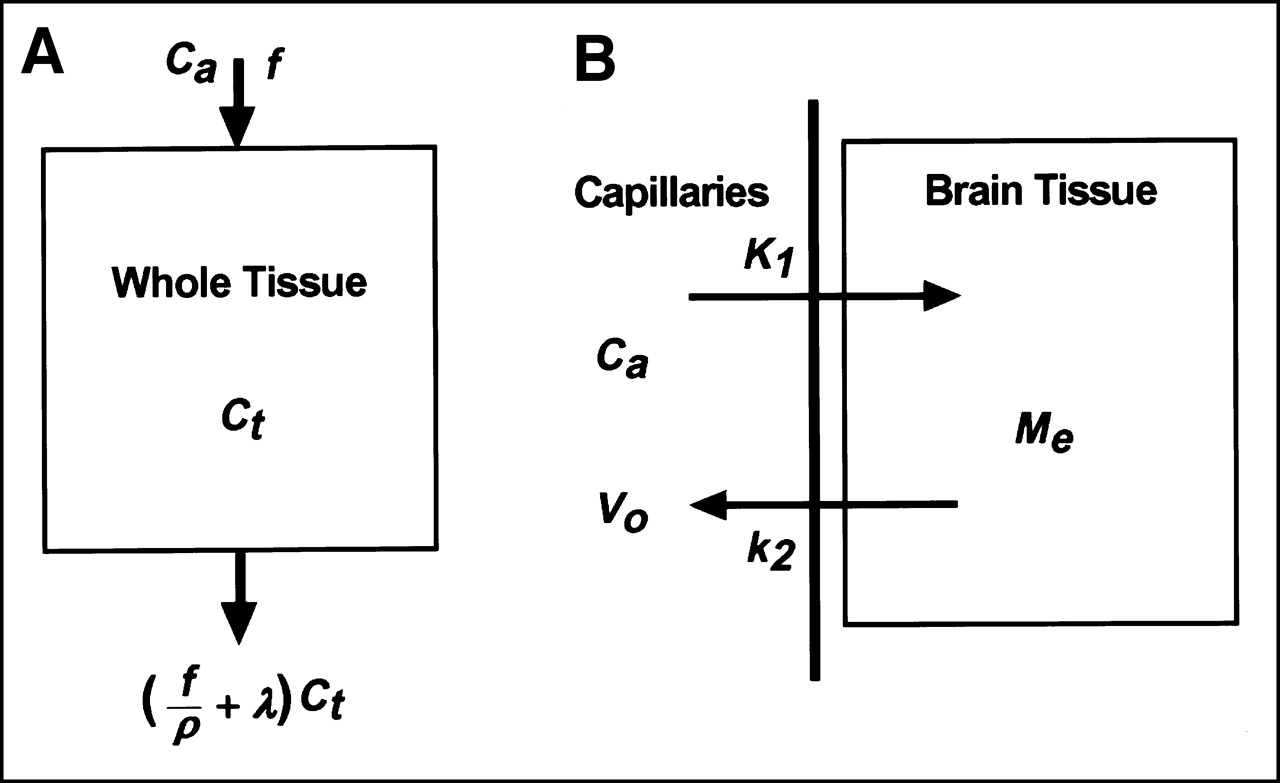
The autoradiographic method established by Raichle et al. (4) and Herscovitch et al. (5) seems to be the most common method for rCBF calculation with H215O on the basis of a 1-compartment model. The 2-weighted integral (WI) method is also based on the 1-compartment model (6,7). A new approach to the quantitative measurement of rCBF was reported by Ohta et al. (8) using a 2-compartment model and the 3-WI method, which was based on a reformulated 2-compartment model originally formulated by Gambhir et al. (9). In their modeling, the 2 compartments are defined as follows: Vascular space is the first compartment and extravascular space (i.e., brain tissue) is the second compartment (Fig. 1). They compared rCBF values obtained by their new method with those obtained through the conventional 1-compartment analysis. The new method was advantageous in that it could reduce the influence of the cerebral vessels on rCBF images and that it was able to calculate images of cerebral arterial blood volume (V0) simultaneously.

Two models of compartment analysis used in this study. One-compartment model (A) in conventional H215O PET studies includes radioactivity from both brain tissue and vascular volume, which are calculated separately in 2-compartment analysis. (B) One-compartment model: Ca, radioactivity level in intravascular space; f, blood flow (mL/min/100 g); Ct, tissue radioactivity; ρ, partition coefficient; λ, decay constant for H215O. Two-compartment model: K1 (mL/g/min) and k2 (min−1), rate constants; Me, radioactivity level in extravascular space.
The other factors involved in correct measurement of rCBF values in H215O studies were the timing and duration of PET scanning. Koeppe et al. (10) concluded that the influence of vascular radioactivity was reduced when the initial PET data obtained 40 s after the tracer injection was eliminated in rCBF calculation. The effects of vascular activity in the vessels on the rCBF values were also reported in a study of patients with arteriovenous malformation and the influence was reduced by omitting several initial frames of the dynamic PET data (11). Kanno et al. (12) reported that the maximal signal-to-noise (S/N) ratio for the rCBF calculation was obtained when the scan duration was from 90–120 s. On the other hand, a tendency toward declining rCBF values appeared when the scan lasted longer in 1-compartment analysis (8,12).
In this study, statistical parametric mapping (SPM) was used to compare regional differences in rCBF calculated by the 2- and 3-WI methods. Then, the results of activation studies were compared between the 2 methods to determine the influence of modeling on rCBF in PET activation studies. Because the images calculated by the 3-WI method are supposed to show less influenced tissue perfusion by intravascular radioactivity, the comparison between the 2 methods was expected to distinguish the effect of vascular radioactivity on the location of activated foci. The method might provide the precise location of increase in blood volume and perfusion itself. Furthermore, the effects of the scan timing and duration on rCBF values in the areas of large vessels were also evaluated in the autoradiographic method to determine the optimal scan timing.
MATERIALS AND METHODS
Subjects
Twelve healthy volunteers (6 men, 6 women; age range, 22–32 y; mean age, 25 ± 3.5 y), were recruited for the PET activation study with visual stimulation. The study was approved by the Research and Ethics Committee of the Montreal Neurological Institute and Hospital and the Ethics Committee of McGill University. Written informed consent was obtained from each volunteer before the study.
PET Procedures
All subjects underwent PET scans with an ECAT EXACT HR+ whole-body scanner (CTI/Siemens, Knoxville, TN), which provides 63 image slices in a 3-dimensional acquisition mode, with an intrinsic resolution of 4.5–5.8 mm in the transverse direction and 4.9–8.8 mm in the axial direction (13). PET images were blurred to 8.1 mm full width at half maximum (FWHM) in the transaxial direction using a Hanning filter. Transmission scans were performed using 68Ga for attenuation correction.
The volunteers were positioned on the scanner bed with their heads immobilized using a customized head holder (Vac-Lock; MED-TECH, Montreal, PQ, Canada). A short, indwelling catheter was placed in the left radial artery for blood sampling. After intravenous bolus injection of up to 370 MBq (10 mCi; the dose was not scaled to the weight of each volunteer) of H215O from the right antecubital vein, a 3-min dynamic PET scan was started at the beginning of the injection with frame durations of 5 s × 12, 10 s × 6, and 20 s × 3. Arterial blood radioactivity was counted automatically using a catheter in the radial artery and corrected for external delay and dispersion of the catheter (14). The radioactivity was calibrated with samples obtained manually during the last 60 s of each 3-min scan. Decay of radioactivity from PET and blood data was corrected to the starting point of each scan.
Each volunteer received PET scans under 2 conditions: with visual activation and with no stimulation (baseline). A yellow and blue annular checkerboard was used for visual stimulation at a frequency of 8 Hz, which is expected to be the strongest stimulation of the visual cortex (15,16). In the baseline condition, subjects were asked to keep their eyes on a crosshair line in the center of the screen. This visual stimulus has been described in detail elsewhere (17). Stimulation began 4 min before the start of the PET scan and continued during the 3-min scan. The room lights were dimmed, and the screen and the volunteer’s head were covered by black drapes for clear viewing of the screen.
Calculation of rCBF Images
rCBF (mL/min/100 g) images were calculated from the dynamic PET data and arterial blood curves using the 2 kinds of WI and autoradiographic methods. The 2-WI method was used for the 1-compartment analysis (6,7), and the 3-WI method was used for the 2-compartment analysis. The calculation in the 3-WI method has been described in detail elsewhere (8,18). Briefly, the first compartment is defined as vascular space and the second compartment is defined as extravascular space (i.e., brain tissue; Fig. 1). The model is expressed by the following equation:
 Eq. 1
where Me and Ca are the radioactivity levels in the extra and intravascular spaces, and K1 and k2 are the rate constants. The equation is solved as:
Eq. 1
where Me and Ca are the radioactivity levels in the extra and intravascular spaces, and K1 and k2 are the rate constants. The equation is solved as:
 Eq. 2
Eq. 2
 Eq. 3
Eq. 3
In Equation 3, M represents the quantity of tracer in the brain, V0 is vascular volume, and ⊗ represents convolution. If the observed and theoretically expected time–activity records were weighted with separate weights as wi values (i = 1–3), Equation 3 is reformulated as Equation 4, and, finally, 1 of the solutions is expressed as Equation 5.


Equations 4 and 5 can be solved for K1 using the table lookup method with variable k2, brain tissue activity from PET data, and Ca from blood samples. The V0 images are then obtained by Equation 3.
The time delay of arterial input was corrected automatically in the program, and a time constant of τ = 4 s was used for internal dispersion correction (8,19,20). Two slice levels around the basal ganglia and internal carotid artery (ICA) were chosen to compare rCBF values pixel by pixel between the 2 calculation methods. The autoradiographic method was used to evaluate the effect of data elimination on rCBF values to optimize rCBF images (11). Several initial frames of dynamic data were removed every 5 s from 20–45 s after the tracer injection. Then the rCBF images were calculated by the autoradiographic method using a partition coefficient of 0.9 (mL/g) (21). The images of the shorter scan duration and the whole scan duration were compared.
Coregistration of PET and MRI
Each subject underwent a high-resolution MRI scan (160 slices, 1 mm thick) obtained with a Magnetome Vision scanner (1.5T) (CTI/Siemens). Coregistration of individual PET and MRI images was performed using an automatic procedure (22) that applies the averaged tissue activity images obtained from dynamic PET data. MRI images of each subject were transformed into Talairach space automatically (23,24), and rCBF images coregistered to the MRI were transferred into the Talairach space using the same spatial transformation parameters (25). Both rCBF and V0 images obtained simultaneously in the 3-WI method were also transformed into the Talairach space according to the same individual parameters and used for comparison with the SPM program or regional values between the different conditions.
Regions of interest (ROIs) were drawn on the bilateral ICA in several slices after transformation into the Talairach space, and values in units of mL/min/100 g were taken from the 3 kinds of images representing rCBF, that is, those calculated by the 2- and 3-WI methods and by the autoradiographic method. In the autoradiographic method, summation of the different frame lengths of the PET scan was applied to assess the effect of scan duration. ROIs were also placed on several brain structures in the Talairach space to compare regional rCBF and V0 values between the 2 model analyses. The same ROIs were applied to all the rCBF and V0 images of the 12 subjects (25).
Statistical Analysis
Three kinds of rCBF images were analyzed using SPM 96 (26–28). Each rCBF image was smoothed using a Gaussian filter (14-mm FWHM) to reduce the effect of individual variability on the cortical gyral anatomy of the brain. To remove the effect of global differences in regional values among subjects, analysis of covariance was applied for all of the analyses (26). SPM comparisons were made at a threshold of 80% of the peak value, the standard cutoff in rCBF SPM studies. The global mean of 50 mL/min/100 g was used for normalization of CBF to correct fluctuations of global blood flow (15,29). The t test was applied pixel by pixel to compare the regional differences in blood flow between the different calculation methods, and between the different conditions (activation vs. baseline). The V0 images were also applied to compare regional differences in blood volume between the different conditions in which the global mean of V0 images was applied for normalization. The t value for each pixel was then converted to a normal standard distribution (Z value), independent of the degree of freedom from error and constituting a statistical parametric map, as reported by Friston et al. (27). To identify the regions showing significant differences, the height threshold (u) used to interpret the t test in terms of probability levels was set at P = 0.001, and the extent threshold (k) was set at P = 0.05 to avoid reaching significance by chance (28,30).
Differences in regional blood flow values obtained from the ROIs on bilateral ICA and brain structures were compared statistically between the 2- and 3-WI method, and between different scan durations in the autoradiographic method using ANOVA. Statistical significance was defined as P < 0.0024 using a post hoc Bonferroni test.
RESULTS
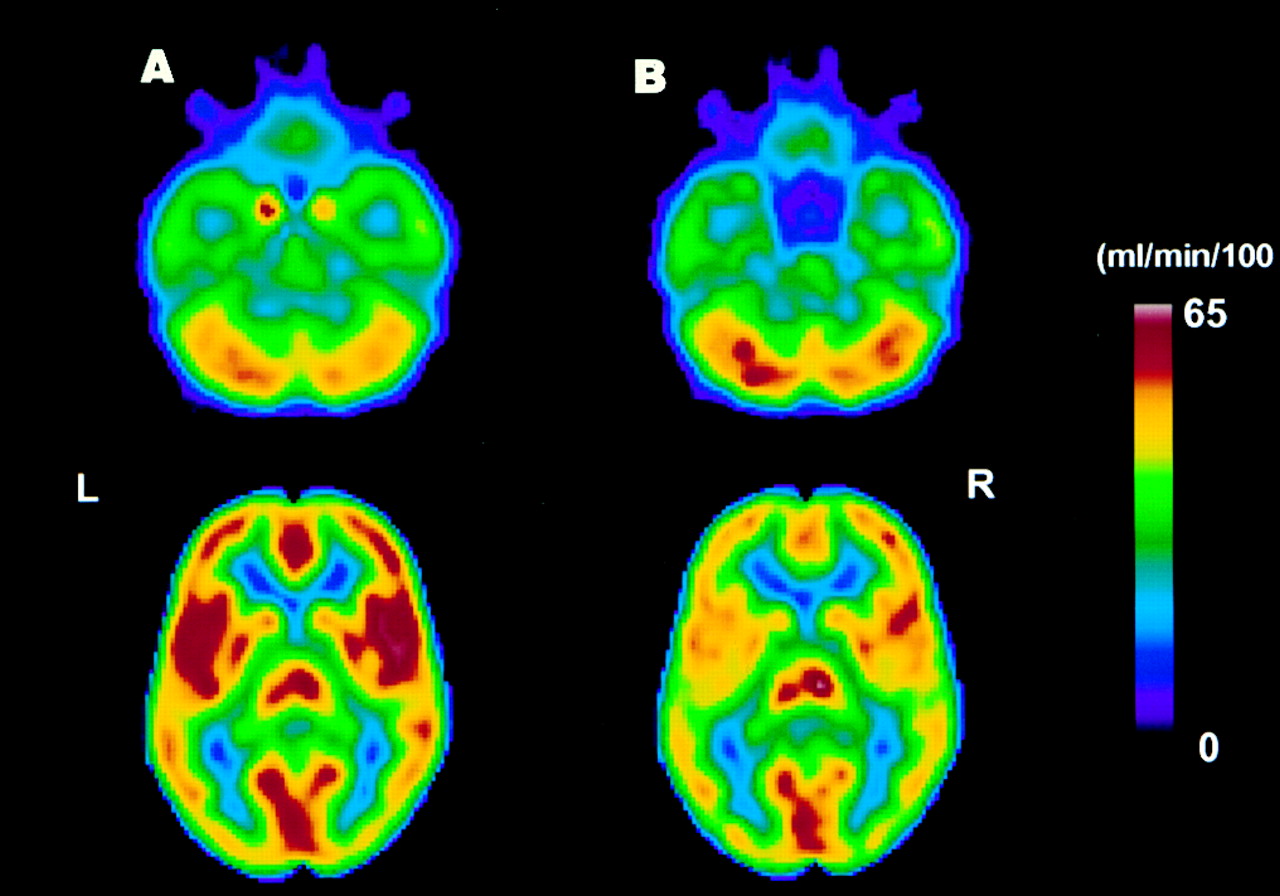
In all subjects, time–activity curves for arterial blood were observed to ensure that the curves were appropriate for an input function. Radioactivity arrived in the brain approximately 15–20 s after the bolus injection of the tracer, and the peak activity in the artery arrived about 10–20 s after the arrival of radioactivity. Using the time–activity curve from arterial blood as an input function, rCBF values were calculated from the 12 subjects’ dynamic PET data by the 3 methods explained previously. Two slice-level images of ICA and basal ganglia were chosen and compared as shown in Figure 2, in which rCBF images obtained from the 2 calculation methods were transformed into the Talairach space and averaged among the 12 subjects. The images show great differences between 1- and 2-compartment models in rCBF values at the location of large vessels and bilateral insula affected by vascular radioactivity in the Sylvian fissure. Figure 3 represents a pixel-by-pixel comparison of values from the averaged rCBF images between the 2 kinetic models using the same slice images as used in Figure 2. Although the rCBF values in the brain tissue corresponded well between the 2 methods, values from the intravascular space and tissue located close to the large vessels provided a great discrepancy between methods, resulting in the lower correlation in rCBF values obtained by the 2 methods. rCBF and V0 values obtained from ROIs on several brain structures are presented in Table 1. rCBF values from the 1-compartment analysis were slightly higher than those from the 2-compartment analysis, especially in the major cortices, but the difference was not significant. Regional differences in V0 images were greater than those seen in rCBF values, although the differences were not significant among the regions. The cortices supplied by the middle cerebral artery tended to show higher values in V0.

Two slice-level images of rCBF in baseline condition obtained by 2 calculation methods. Images for 12 subjects were averaged after transformation into Talairach space. Left column shows rCBF images calculated by 2-WI method, and right column shows those calculated by 3-WI method. Images show large differences between (A) 1- and (B) 2-compartment models in rCBF values in large vessels and bilateral insula, which is considered affected by middle cerebral arteries in Sylvian fissure. L and R indicate left and right sides of brain.
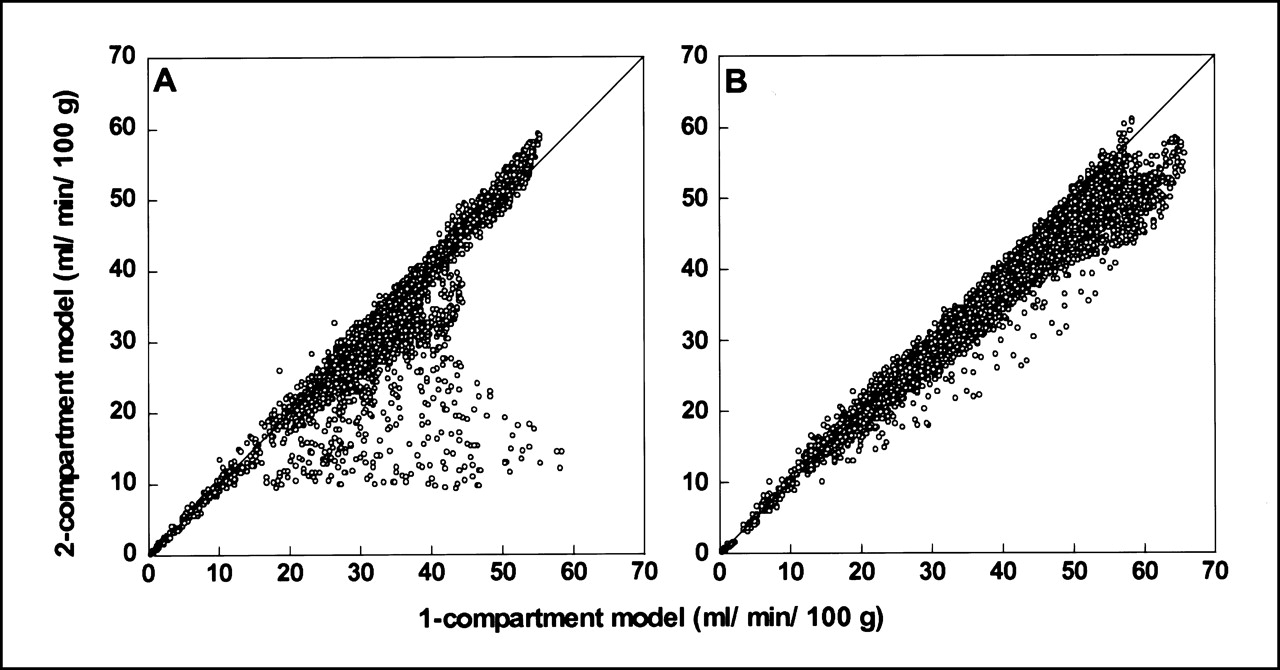
Pixel-by-pixel comparison of values from averaged rCBF images between 2 kinetic models using same slice levels as in Figure 2 (levels in internal carotid artery (A) and basal ganglia (B)). rCBF values in brain tissue corresponded well between 2 methods in most regions. Discrepancy between methods was greatest in regions located close to large vessels, resulting in much lower correlation between methods seen in left graph (A). Areas of bilateral insula and temporal lobes affected by vascular radioactivity in Sylvian fissure also showed overestimation in right graph (B) when using 1-compartment model. Line is a line of identity.
Regional Differences in rCBF Between 1- and 2-Compartment Models and Arterial Blood Volume
Effects of different scan durations on rCBF values obtained by the autoradiographic method were evaluated in the areas of bilateral ICA regions at slice levels around the pituitary fossa and gray matter in the bilateral parietal lobes that were located more remotely from any of the major arteries. Elimination of the initial time frames reduced rCBF values in the vascular region from 24.3–18.8 mL/min/100 g as a function of omitting frames in every 5 s, and rCBF values reached a plateau after elimination of the initial 30–35 s or longer. The changes in rCBF were significant when initial dynamic frame data of ≥30 s were eliminated (P < 0.001, post hoc Bonferroni test), although the values were still overestimated compared with the values obtained by 2-compartment analysis (6.4 mL/min/100 g). In contrast, rCBF values in the cortical regions remotely located from major vessels were not affected by the scan duration and showed stable rCBF values (43.5 ± 0.3 mL/min/100 g) despite elimination of initial frames.
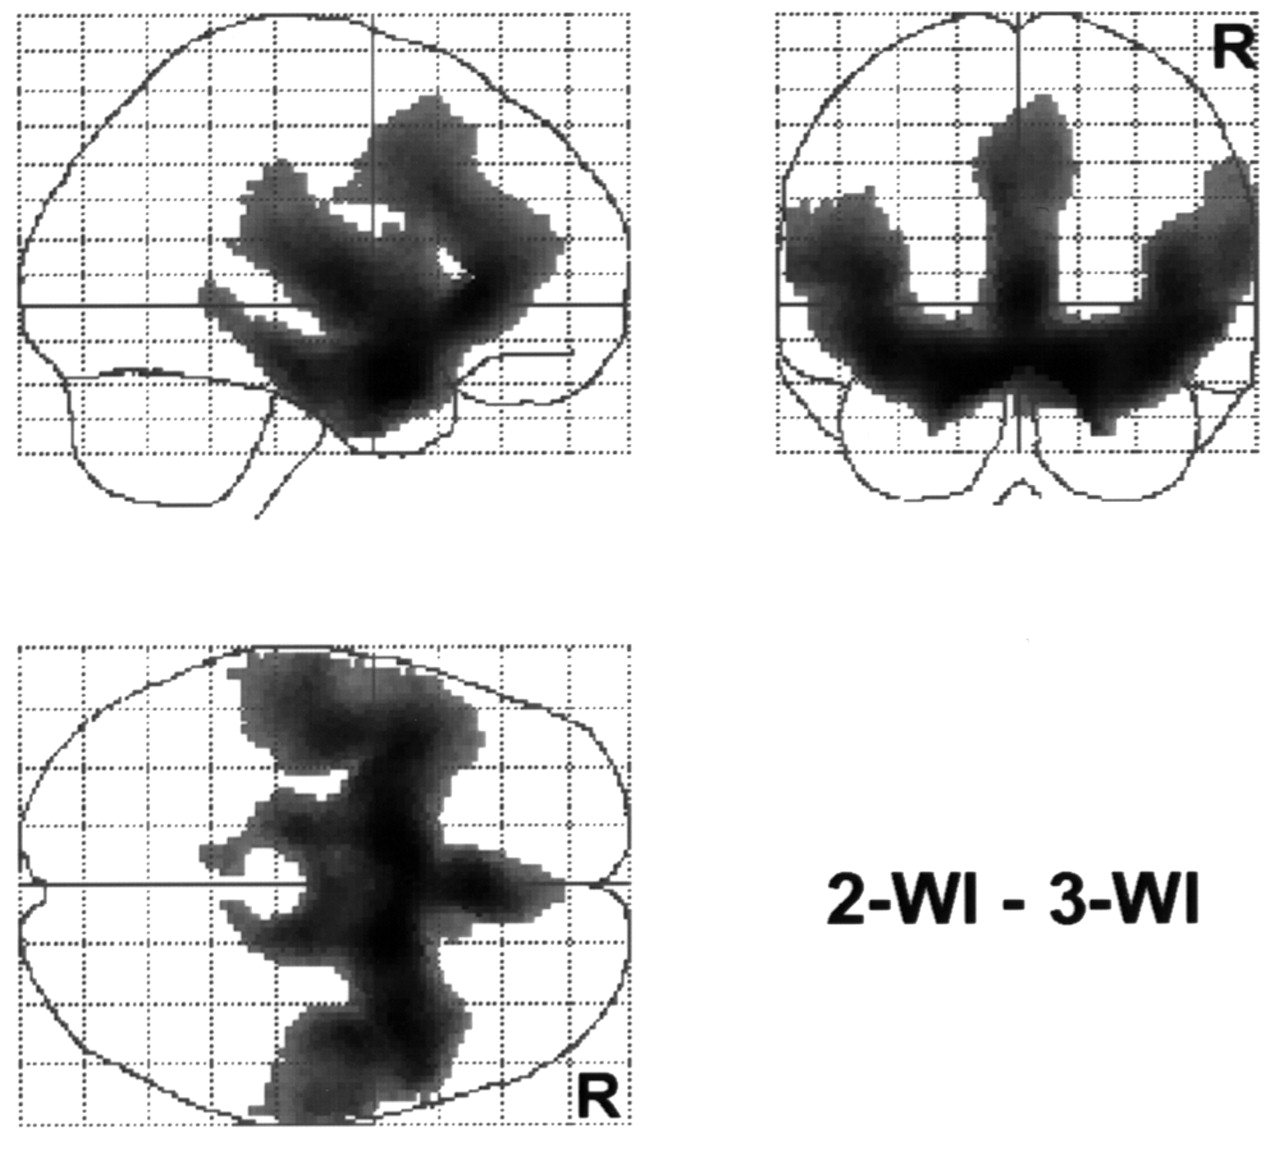
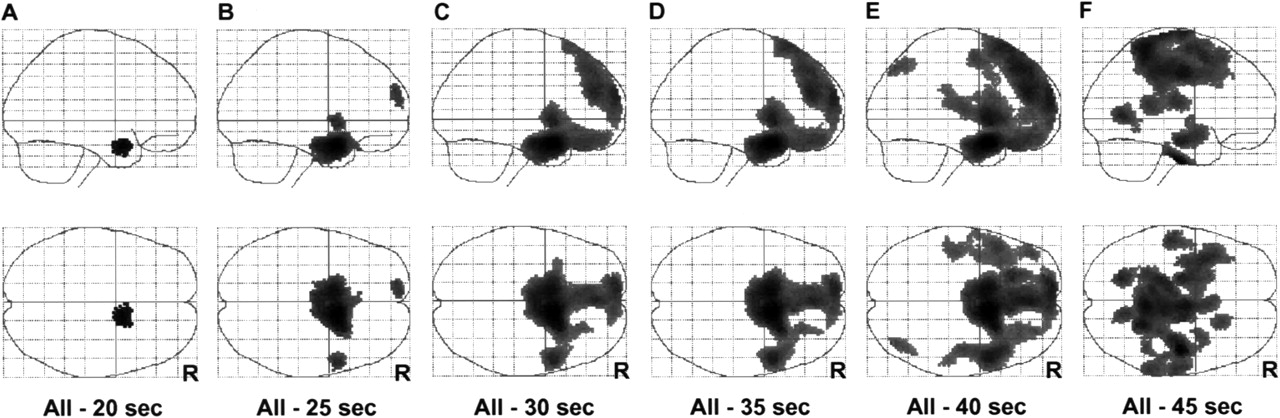
The results of SPM analysis between the 1- and 2-compartment methods are shown in Figure 4. The major arteries supplied from the bilateral ICA and surrounding areas were expressed, suggesting that the arterial phase of the tracer was seen as a difference. The differences in rCBF calculated from the eliminated PET data and whole frames were compared using SPM to observe the location of elimination effects (Fig. 5). The arterial phase of the tracer was expressed according to the omitted initial frame data. The areas of significant difference in this comparison were similar to those shown in Figure 4, when the initial 30–40 s of frames were eliminated from the whole data.
SPM results comparing rCBF obtained by 1- (2-WI) and 2- (3-WI) compartment methods in baseline condition. Major arteries supplied from bilateral ICA and surrounding areas were expressed, suggesting that arterial phase of tracer was seen as difference. R indicates right side of brain.

Differences in rCBF calculated from data after eliminating initial frames and from entire PET frames using autoradiographic method. SPM was used to determine location affected by elimination. Areas of significant difference in comparison were similar to those shown in Figure 4 when initial 30–40 s of frames were eliminated from whole set of data. R indicates right side of brain.
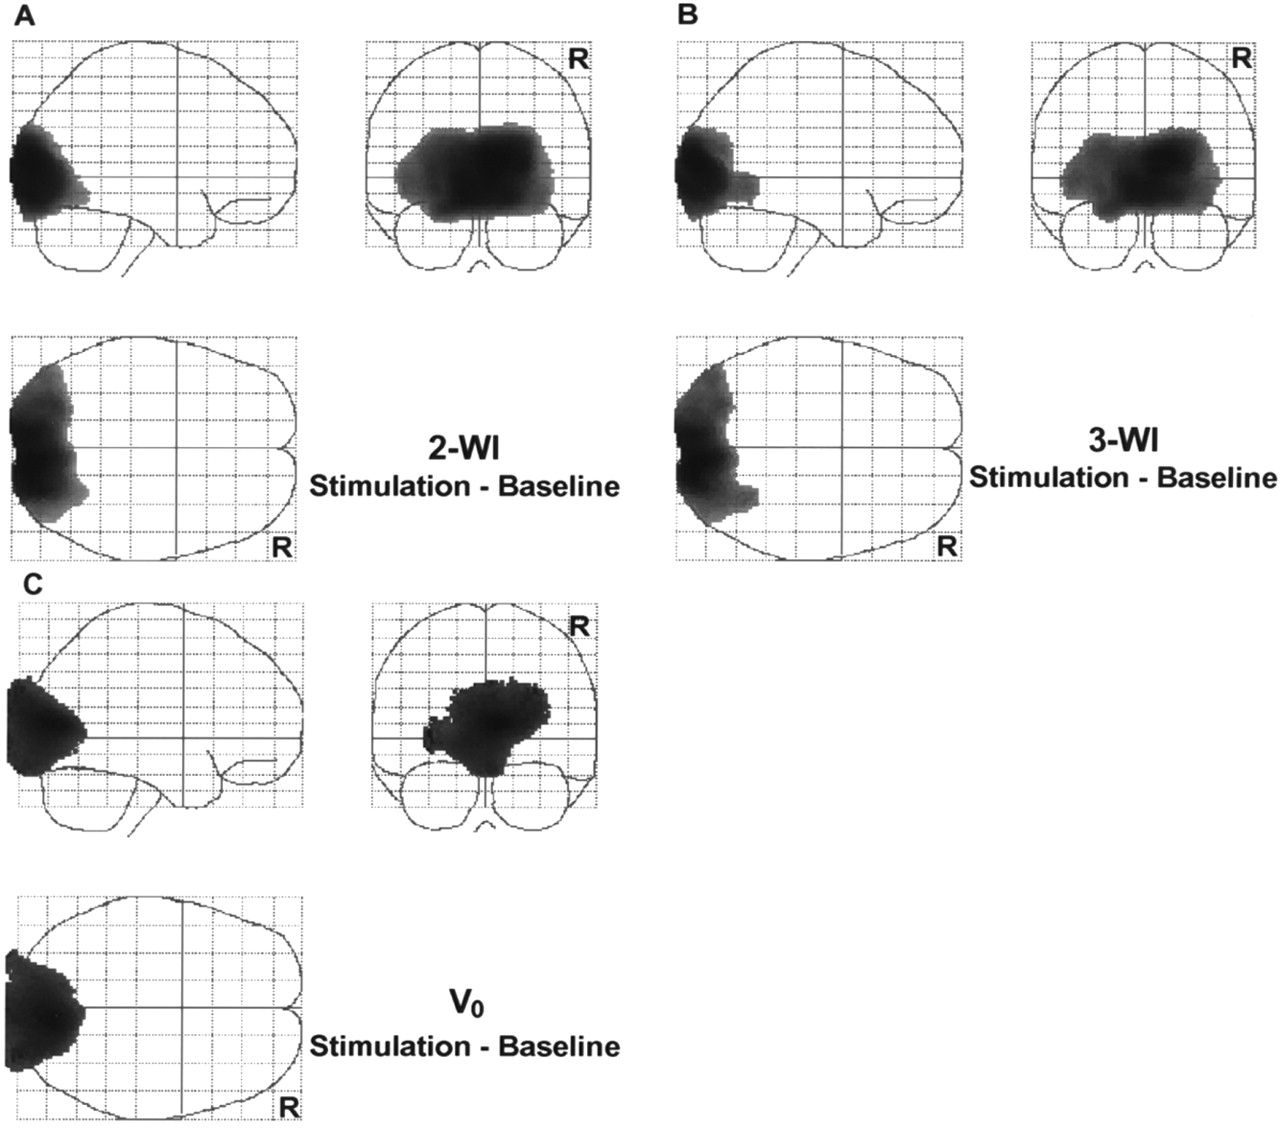
Differences in rCBF between the 2 conditions in the activation study were analyzed using SPM (Fig. 6). Similar regions were identified as significantly activated when the results obtained by the 2 calculation methods were compared. SPM analysis with V0 images also showed that the arterial blood volume was increased significantly in the visual cortex and surrounding areas in the visual stimulation condition (Fig. 6C). The global mean of 1.55 mL/100 g obtained from the 12 volunteers was used for V0 normalization in SPM analysis. The peak location and Z values are (x,y,z) = (8,−88,10; Z = 7.97), (12,−88,12; Z = 7.32) and (6,−78,12; Z = 4.79) for rCBF with the 2- and 3-WI methods and V0, respectively.

Regional differences in rCBF between 2 conditions in activation study were analyzed using SPM. Results from 2-WI (A) and 3-WI (B) were similar in visual activation study. Location of peak Z values are (x,y,z) = (8,−88,10; Z = 7.97), and (12,−88,12; Z = 7.32) for 2- and 3-WI methods, respectively. V0 comparison also showed a significant increase in blood volume in visual cortex and surrounding areas in visual stimulation (C) ((x,y,z) = (6,−78,12); Z = 4.79). Note that areas expressed as significant difference in V0 comparison (C) expanded out of brain because V0 image includes superficial vascular volume of brain. R indicates right side of brain.
DISCUSSION
The conventional methods of using H215O injection or C15O2 inhalation in PET have been viewed as standards for quantitative rCBF measurement in clinical studies. The methods were based on a 1-compartment model introduced by Kety (31,32). However, the 1-compartment model overestimated rCBF in blood-rich areas when using the autoradiographic method with H215O injection (11). rCBF in the high perfusion areas seemed to be underestimated when using the continuous inhalation method with C15O2 (4,5,33). In another study, the 2 methods resulted in similar rCBF values after correction for internal dispersion (34). The 3-WI method based on the 2-compartment model developed by Ohta et al. (8,18) was expected to provide less-influenced rCBF values, especially in the blood-rich areas, by calculating blood flow separately from arterial blood volume, which would circumvent the effects of radioactivity in the large vessels. One of the objectives of this study was to determine the correlation of rCBF values between the 1- and 2-compartment analyses and to assess the accuracy of the values in the brain tissue close to large vessels in which the values are expected to be influenced because of high radioactivity. Furthermore, the effect of eliminating the initial frames in the autoradiographic method was also evaluated to optimize or lessen the influence of radioactivity in the blood-rich regions on nearby brain tissue (10,11). Visual activation accompanied this study, and the results of the activation were also compared between the 2 methods.
Pixel-by-pixel comparison of the rCBF values between the 1- and 2-compartment models showed excellent correlation, except in the blood-rich areas and large vessels, as shown in Figures 2 and 3. Ohta et al. (8) previously reported underestimation of rCBF in 2-compartment analysis (mean rCBF of 45.1±16.8 vs. 33.1±11.9 in a 3-min scanning time for the 2- and 3-WI methods, respectively). However, in this study, the differences in the mean values of global CBF were <10%, which was not significant. Heterogeneity of the brain tissue in ROIs in the previous study might have been one reason for the large difference in the mean rCBF values. An improved method used in this study for blood sampling and dispersion correction to estimate an input function might be another reason for the better correlation (14,34). The good correlation of rCBF values in the deep gray matter and basal ganglia (Fig. 3; Table 1) indicates that the 2-compartment model with the 3-WI method can be used to estimate appropriate rCBF values. Comparison of the rCBF images obtained by the 2 models showed that the 2-compartment model avoids the influence of radioactivity in the vessels on tissue perfusion (Fig. 2). This is because the influence of high radioactivity in the blood-rich regions was expected when using methods based on the 1-compartment model in H215O and PET studies (11). Regional differences in V0 obtained from 2-compartment analysis also support this speculation. Although the regional differences in V0 were not significant because of large SDs (Table 1), the major cortices close to major arteries showed greater V0 values compared with basal ganglia. Furthermore, SPM results comparing rCBF obtained by the 2 methods showed significant differences in the large arteries and adjacent tissue (Fig. 4). The results of the pixel-by-pixel comparison and SPM indicate that the difference in rCBF values between the 2 models was caused by overestimation of rCBF in the 1-compartment calculation (Figs. 3 and 4), which is highly affected by radioactivity in the large vessels and superficial arteries.
Elimination of the first several frames from the dynamic PET data reduced the influence of the large vessels in the autoradiographic method. When 30 s or more of time frames after administration of the tracer were omitted, the activity in these areas was significantly reduced, a relationship that has been reported (10,11). On the contrary, rCBF values in the cortical regions remotely located from the major arteries were not affected by the scan duration. In measuring absolute rCBF by the autoradiographic method, the timing of the scan start is important. The scanning should start at the point at which brain radioactivity reaches its peak.
The timing of the scanning seems more complicated in the PET activation studies. The arterial phase of PET data in activation studies is considered important, and excessive elimination of this phase of dynamic PET data might reduce signals in the activated cortex and result in a reduced S/N ratio that could affect significance of regional differences (35–37). SPM comparison of the effect of omitting several frames from dynamic PET data showed that eliminating data could prevent overestimation of rCBF in major arteries and surrounding areas significantly (Fig. 5). However, summation of change in rCBF and V0 might improve statistical results in PET activation studies. In the present visual stimulation study, the regional differences in rCBF in the 2 conditions were similar between the 2 methods (Figs. 6A and 6B), suggesting that vascular activity may not have a great effect on the results of activation studies. However, the comparison of V0 values obtained under the 2 conditions revealed a significant difference in the visual cortex and surrounding areas, indicating that the blood volume was also increased in the activation condition (Fig. 6C). This result indicates that radioactivity in the vessels may affect the correct location of difference in activation studies (38).
A few small activated areas were identified as significant with the 3-WI method when only the height threshold (P < 0.001) was applied in SPM analysis, whereas the 2-WI method did not show any other additional regions to be significant. This observation was not presented in the results because the small areas did not satisfy the extent threshold; however, rCBF images less influenced by vascular radioactivity may lead to a different observation compared with the images from conventional methods in PET activation studies. The stimulation used in this study activated the visual cortex, where the effect of large arteries was expected to be minimal. If an activation task is chosen in such a way that cortices adjacent to the large vessels are expected to be stimulated (Fig. 4), the results might be affected by vascular radioactivity and increased blood volume. The 2-compartment or 1-compartment analysis, accompanied by elimination of the initial PET frames or delayed scan timing, would circumvent the effects of vascular radioactivity and increased arterial blood volume on the activation peaks in PET activation studies. The method would detect a precise location of changes in rCBF that might be differently located from the area detected by functional MRI, which is considered sensitive mostly to changes within the blood.
CONCLUSION
The results of this study suggest that rCBF values in the areas surrounding the large vessels were affected by radioactivity in the vessels. The 3-WI method provided rCBF values that were less influenced by the vascular radioactivity and also showed the differences in regional arterial blood volume simultaneously in PET activation studies. To obtain absolute rCBF values with the autoradiographic method, elimination of the initial 30–40 s of data helps to reduce overestimation in the superficial gray matter.
Acknowledgments
The authors thank the staff of the Medical Cyclotron and PET Units of the McConnell Brain Imaging Center, Montreal Neurological Institute.
Footnotes
Received May 1, 2000; revision accepted Aug. 14, 2000.
For correspondence and reprints contact: Hidehiko Okazawa, MD, PhD, PET Unit, Research Institute, Shiga Medical Center, 5-4-30 Moriyama, Moriyama-shi, Shiga, 524-8524, Japan.
REFERENCES
In this issue


Jump to section
Related Articles
Cited By...
- Kinetics of brain nicotine accumulation in dependent and nondependent smokers assessed with PET and cigarettes containing 11C-nicotine
- Diagnosis of Misery Perfusion Using Noninvasive 15O-Gas PET
- Relationship Between Vasodilatation and Cerebral Blood Flow Increase in Impaired Hemodynamics: A PET Study with the Acetazolamide Test in Cerebrovascular Disease
- Differences in Vasodilatory Capacity and Changes in Cerebral Blood Flow Induced by Acetazolamide in Patients with Cerebrovascular Disease
- Distinction Between Cerebral Blood Flow and Vascular Activity by PET Tracer Kinetic Analysis: Practical and Physiologic Considerations