


Abstract
Kinetic modeling of 99mTc-diethylenetriaminepentaacetic acid galactosyl human serum albumin (Tc-GSA) measures the total amount of asialoglycoprotein receptor within a subject’s liver. This study tested the hypothesis that the amount of asialoglycoprotein receptor measured by Tc-GSA modeling provides a valid index of functional liver mass. Methods: Twenty-two patients with cirrhosis, 18 patients with chronic hepatitis, and 9 patients with normal liver parenchyma were studied with Tc-GSA using a 30-min dynamic imaging protocol. The total amount of hepatic receptor was measured by kinetic modeling of the Tc-GSA time–activity data. The total number of viable hepatocytes was calculated using standard morphometric measurements of liver biopsy samples and liver volume measurements through CT. Results: The total receptor amount strongly correlated with the total hepatocyte number (r = 0.803; P < 0.0001). Conclusion: Tc-GSA measurement of the total receptor amount is proportional to the number of viable hepatocytes and therefore provides a valid assessment of functional liver mass.
- 99mTc-diethylenetriaminepentaacetic acid galactosyl human serum albumin
- asialoglycoprotein receptor
- functional liver mass
- kinetic modeling
Quantitative measurement of functional liver mass is critical in deciding the extent of liver resection needed in patients with liver tumors. In particular, hepatocellular carcinoma is frequently associated with cirrhosis or chronic hepatitis, and accurate estimation of the residual functional liver mass can be important in reducing morbidity and mortality after liver resection, especially in patients with cirrhosis (1).
99mTc-diethylenetriaminepentaacetic acid galactosyl human serum albumin (Tc-GSA) is a radiolabeled asialoglycoprotein (ASGP) analog developed for imaging the functional liver and is specifically extracted by hepatocytes by binding to the asialoglycoprotein receptor (ASGP-R). Because the amount of ASGP-R decreases in patients as liver function deteriorates (2), uptake of ASGP into the liver is influenced by the severity of liver damage (3). Quantitative measurements of ASGP-R concentration, the maximum removal rate of Tc-GSA, and the amount of ASGP-R using kinetic analysis have been developed (4–6).
Many reports (7–11) have shown significant correlations between indices of Tc-GSA imaging and clinical grading scores such as the Child-Pugh score (12) and histologic activity index (13). However, these scores are semiquantitative; therefore, these correlations are an indirect validation of the receptor measurement as an index of functional liver mass. Consequently, the hypothesis that Tc-GSA receptor measurements are proportional to the number of functioning hepatocytes has never been tested. The computer-aided morphometric method developed by Imamura et al. (14) permits a quantitative evaluation of histologic findings. Total hepatocyte number measured by this method is a quantitative index of functional liver mass (14,15). In this study, we tested the hypothesis that the amount of ASGP-R measured by Tc-GSA kinetic modeling provides a valid index of functional liver mass.
MATERIALS AND METHODS
Subjects
Forty-nine patients who underwent a Tc-GSA study before liver resection for tumors between August 1995 and January 1997 were included in this study. Patients were assigned to three groups according to histologic findings: 9 patients with histologically normal liver parenchyma, 18 patients with chronic hepatitis, and 22 patients with liver cirrhosis. The diagnosis was confirmed histologically from specimens of resected liver. The group with normal parenchyma consisted of 7 patients with metastatic liver tumors, 1 with cholangiocellular carcinoma, and 1 with benign liver tumors. All patients with chronic hepatitis and cirrhosis had hepatocellular carcinoma. Informed consent was obtained from each patient before the Tc-GSA study.
Tc-GSA Dynamic Imaging and Receptor Measurement
The Tc-GSA dynamic imaging and kinetic modeling have been described in detail (6). Briefly, after injection of 3 mg Tc-GSA, sequential images were acquired using a gamma camera with a large field of view. Data analysis was performed by creating regions of interest over the lung, heart, and liver. Standard software was used to generate time–activity curves for each region of interest. The lung curve was used to correct the heart curve for background. Measurement of total receptor amount was based on a kinetic analysis of the corrected liver and heart time–activity curves (6).
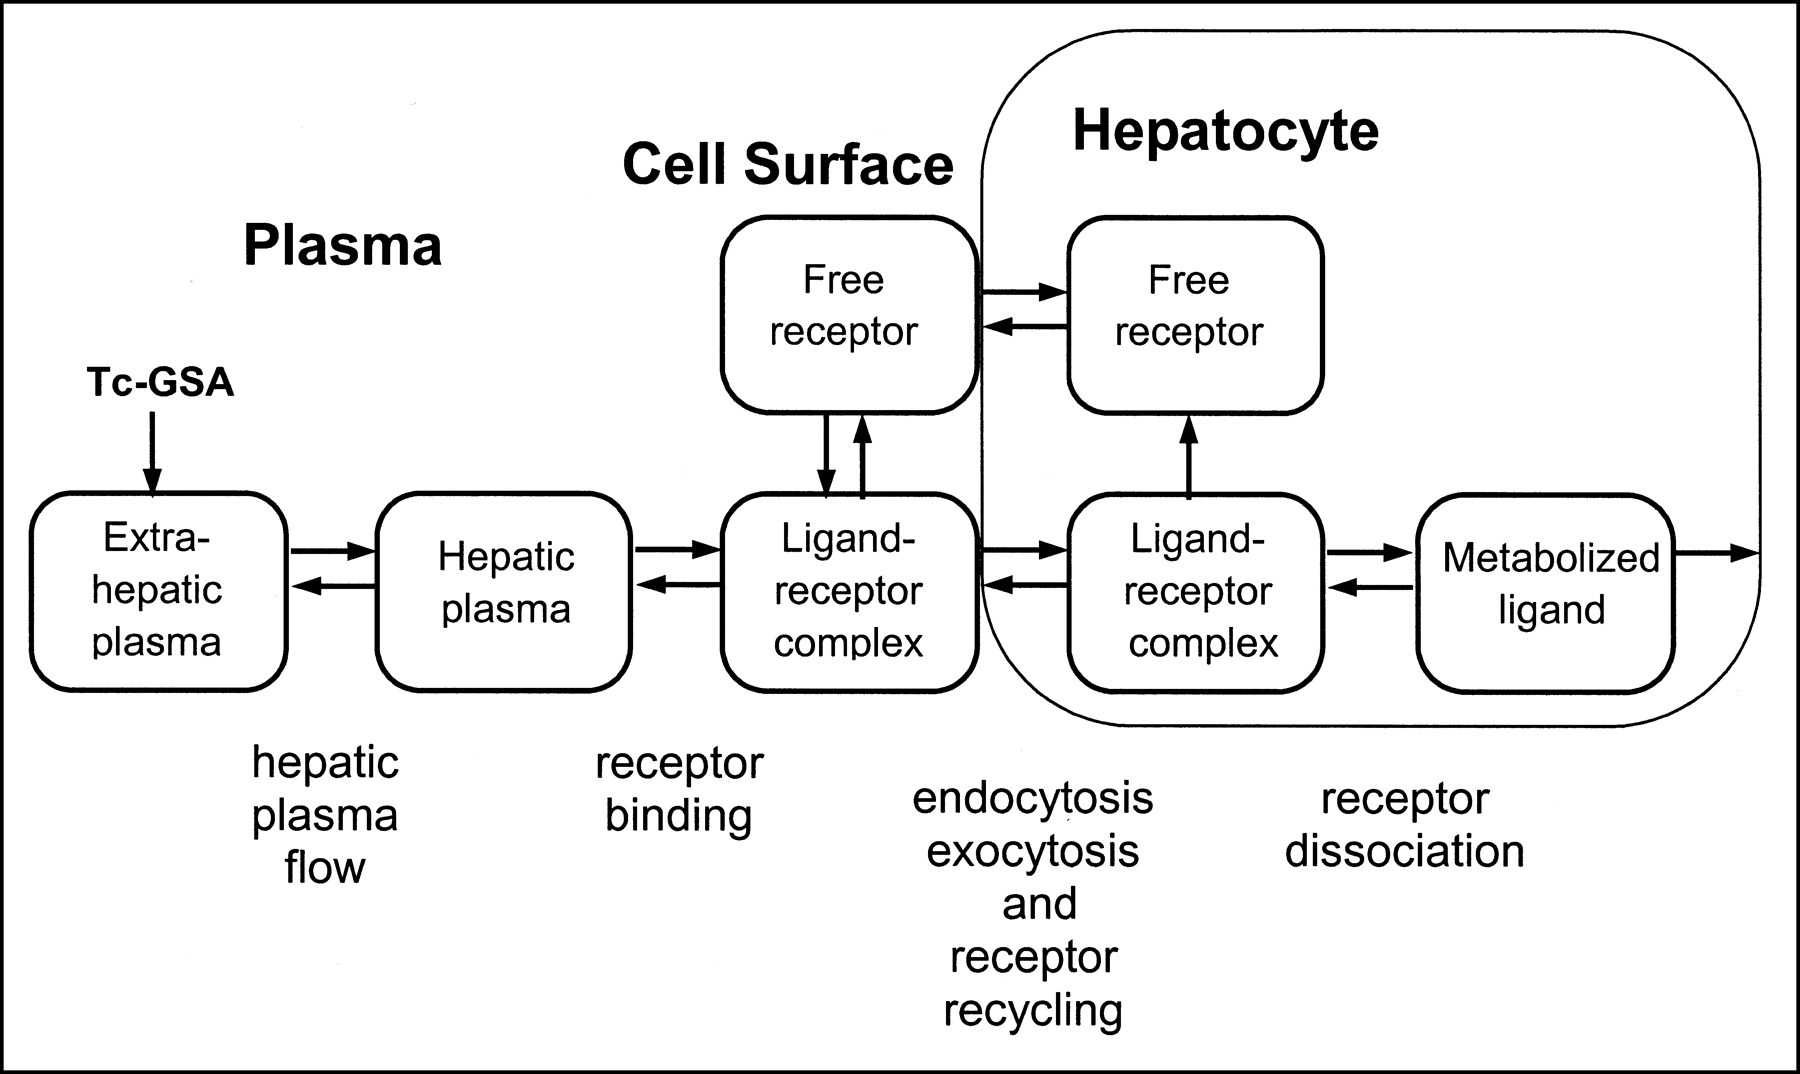
Figure 1 represents the kinetic model, which consists of five compartments of ligand and two compartments of unbound receptors. The kinetic model uses the following assumptions: equilibrium between ligand in hepatic plasma and the cell surface receptors is the most rapid equilibrium in the system, internalization is fast and exocytosis slow, dissociation of the ligand–receptor complex in the cytoplasm and return of the dissociated receptors to the receptor pool are slow, and equilibrium exists between the receptor pool in the cytoplasm and cell surface receptors. Total plasma volume was estimated from the patient’s body weight, height, and hematocrit level. Standard nonlinear regression was used to estimate the total amount of hepatic ASGP-R (Rtotal), hepatic plasma flow, and hepatic plasma volume.

Kinetic model of Tc-GSA with receptor endocytosis and recycling. Using this model, total receptor amount (Rtotal) was measured by computer-automated analysis of Tc-GSA liver and heart time–activity curves.
Liver Function Tests
Conventional liver function tests were performed using routine clinical methods. Platelet cell counts, albumin concentration, cholinesterase activity, total bilirubin concentration, glutamic oxaloacetic transaminase activity, glutamic pyruvic transaminase activity, and prothrombin time were included as liver function tests. The plasma disappearance rate (ICG-k) of indocyanine green (ICG) was measured by a standard method (16). A Child-Pugh score (12) was assigned to each patient.
Morphometric Analysis
Morphometric analysis was used to estimate the total number of viable hepatocytes. These measurements were performed without knowledge of hepatic function. The resected liver specimens were fixed in 10% formaldehyde and embedded in paraffin. Two-micrometer-thick noncancerous sections were stained with hematoxylin–eosin and azan. Photomicrographs were taken from azan sections at ×40 magnification and from hematoxylin–eosin sections at ×400 magnification. Five areas were chosen randomly within each section. The photomicrographs were converted to digital images using an image scanner (QS 35; Minolta Co., Ltd., Tokyo, Japan). The digitized images were then analyzed by a modification of the method of Imamura et al. (14), using Photoshop (version 4.0; Adobe Systems Inc., San Jose, CA). Each color image was separated into three primary-color images (red, green, and blue). The parenchymal cell volume ratio was calculated from the azan sections. Subtraction of the blue image from the red image enhanced the contrast between the parenchymal cells and fibrous tissue. After establishment of an appropriate threshold that filtered in the parenchymal cells, the ratio of the parenchymal cell volume to the total area was calculated. From the red image of the hematoxylin–eosin section, a contrast image of the parenchymal cell nuclei was obtained by setting an appropriate threshold (some images required manual identification and erasure of nonparenchymal nuclei). The volumetric fraction of parenchymal nuclei was measured, and the number of parenchymal cells per unit area was counted. Parenchymal cell density was calculated by a method described previously (17). Noncancerous liver volume was calculated by CT volumetric measurements (18). The parenchymal cell volume, the total hepatocyte number, and the number of receptors per hepatocyte were calculated as follows: Parenchymal cell volume = liver volume × parenchymal cell volume ratio. Total hepatocyte number = parenchymal cell volume × parenchymal cell density. Receptors per hepatocyte = Rtotal/total hepatocyte number × 6.02 × 10²³.
Statistical Analysis
Results are expressed as mean ± SD. Differences between groups were evaluated by F ratio using a one-way ANOVA. The Scheffé test was used for post hoc comparisons. All correlations were calculated using the Pearson correlation coefficient. After converting the correlation coefficient to z scores (19), we tested the significance of the difference between the correlation of Rtotal to total hepatocyte number and the correlation of ICG-k to total hepatocyte number; P < 0.05 was considered statistically significant.
RESULTS
Rtotal showed a strong correlation with total hepatocyte number (r = 0.803; P < 0.0001) (Fig. 2). Rtotal did not correlate significantly with liver volume (r = 0.22; P > 0.1) and correlated weakly with parenchymal cell volume (r = 0.396; P = 0.005). The correlation of Rtotal with hepatocyte number was significantly (P = 0.002) higher than the correlation of ICG-k with total hepatocyte number (r = 0.423; P < 0.005).

Rtotal and total number of viable hepatocytes within subject’s liver exhibited high correlation. ○ = normal; ▵ = chronic hepatitis; ◊ = cirrhosis.
The Rtotal values were the most significantly different among the three groups (P < 0.0001). Table 1 lists the means and SDs of Rtotal, ICG-k, platelet cell count, albumin concentration, cholinesterase activity, prothrombin time, and Child-Pugh criteria score for the three patient groups. Also listed in Table 1 are the probability values obtained by ANOVA.
Liver Function Tests
Liver volume and parenchymal cell volume did not significantly differ among the three groups (Table 2). However, the total hepatocyte number was significantly different among the three groups (P < 0.0001), between the normal and cirrhosis groups, and between the normal and chronic hepatitis groups. The numbers of receptors per hepatocyte were not significantly different among the three groups. The average number of total and surface receptors per cell in the normal group was 1.09 × 10⁶ and 6.3 × 10⁴, respectively.
Morphometric Parameters
DISCUSSION
We have shown that a high correlation exists between the total number of hepatocytes and the total amount of ASGP-R as measured by Tc-GSA functional imaging. These observations provide the basis for interpretation of a Tc-GSA measurement of receptor number as an index of a patient’s functional liver mass. Measurement of total hepatocyte number is an established technique that combines morphometric microscopy and CT imaging. Imamura et al. (14) and Kawasaki et al. (15) used this method to directly measure the total hepatocyte number in patients with cirrhosis.
Neither liver volume nor parenchymal cell volume (the functional hepatocyte volume excluding fibrous tissue) was significantly different among the histologically classified groups. In contrast, the total number of hepatocytes was significantly different among the three groups. In some cases, liver volume increases through the individual-hepatocyte enlargement that is caused by fat deposition. In fact, the cell density of the cirrhosis group was significantly smaller than that of the other two groups because of the enlargement of cirrhotic hepatocytes (20). Therefore, the reduction of hepatocyte number in cirrhosis was more evident than the reduction of liver volume.
If the individual-hepatocyte function is maintained, the total hepatocyte number is proportional to the total liver functional mass. The correlation between Rtotal and morphometric parameters supported this hypothesis. Rtotal, although not correlating with liver volume and showing only a weak correlation with parenchymal cell volume, exhibited a strong and linear correlation with total hepatocyte number. Kawasaki et al. (15) showed a similar correlation between antipyrine plasma clearance and total hepatocyte number and proposed the total hepatocyte number as an index of liver functional mass. Additionally, the correlation of Rtotal with hepatocyte number was significantly (P = 0.002) higher than the correlation of ICG-k with total hepatocyte number. This finding has significant implications for hepatobiliary surgery (21), for which the ICG test is the most common test of functional liver mass. Because hepatic resection in patients with cirrhosis is limited to individuals with relatively good functional reserve, the ICG index is considered to be more important than the Child-Pugh score or the histologic diagnosis when deciding the extent of resection needed.
With ANOVA, Tc-GSA measurements of total ASGP-R showed significant differences among the three patient groups, and a post hoc comparison revealed significant differences between all pairs of patient groups. The other liver function tests showed no significant differences between the normal group and the chronic hepatitis group. Rtotal could discriminate chronic hepatitis from normal parenchyma as well as cirrhosis from chronic hepatitis.
We estimated the total and surface receptor number per normal hepatocyte to be 1.09 × 10⁶ and 6.3 × 10⁴, respectively. Although surface receptor density varies from 6.7 × 10⁴ to 2.5 × 10⁵ in different reports (22–25), our values are similar to the values (1.2 × 10⁶ and 6.7 × 10⁴, respectively) calculated by Steer and Ashwell (22) using freshly isolated rat hepatocytes. In this study, the number of receptors per hepatocyte showed no significant differences among the three groups. Although the model cannot account for differences in ASGP-R distribution or affinity, receptor binding sites on the cell surface are likely maintained in cirrhosis. In addition, the strong correlation between ASGP-R and hepatocyte number suggested that decreased uptake of Tc-GSA in cirrhosis is explained mainly by a reduction in hepatocyte number.
Quantitative measurements of ASGP-R density and maximum removal rate of Tc-GSA using kinetic analysis have been reported (4,5). The model used in this study is a more accurate mathematic representation of ASGP-R biochemistry. This kinetic analysis (6) simultaneously estimates the ASGP-R quantity and hepatic blood flow while accounting for receptor-mediated internalization and recycling.
Although the three current methods (4–6) for kinetic analysis of ASGP-R concentration have different model structures and numeric algorithms, the methods share the common element of a bimolecular receptor-binding mechanism. Of the many physiologic and biochemical mechanisms within the ASGP-R pathway, receptor–ligand binding displays the highest kinetic sensitivity in vivo (26) and receptor concentration exhibits the highest diagnostic accuracy (27). For this reason, we propose that a receptor measurement from any of the current ASGP-R models is an index of functional hepatic mass. Moreover, we postulate that receptor measurements, in general, are an index of the functional mass of the target tissue.
CONCLUSION
Measurements of Rtotal through Tc-GSA kinetic modeling are proportional to the number of viable hepatocytes and, therefore, provide a valid assessment of functional hepatocellular mass. Additionally, the correlation of Rtotal with hepatocyte number was significantly higher than the correlation of ICG-k with total hepatocyte number. This finding has significant implications for hepatobiliary surgery, for which the ICG test is the most common index of functional liver mass.
Acknowledgments
This study was supported by grant-in-aid 08407036 for scientific research from the Ministry of Health and Welfare of Japan.
Footnotes
Received Jul. 6, 2000; revision accepted Jan. 10, 2001.
For correspondence or reprints contact: Kenji Miki, MD, Department of Hepato-Biliary-Pancreatic Surgery, Faculty of Medicine, University of Tokyo, 7-3-1 Hongo, Bunkyo-ku, Tokyo 113-8655 Japan.
REFERENCES
In this issue


Jump to section
Related Articles
Cited By...
- In Vitro to In Vivo Scalars for Drug Clearance in Nonalcoholic Fatty Liver and Steatohepatitis
- Targeted protein degradation systems to enhance Wnt signaling
- Minimal Physiologically Based Pharmacokinetic-Pharmacodynamic (mPBPK-PD) Model of N-Acetylgalactosamine-Conjugated Small Interfering RNA Disposition and Gene Silencing in Preclinical Species and Humans
- Molecular Imaging of the Glomerulus via Mesangial Cell Uptake of Radiolabeled Tilmanocept
- Hepatic Galactose Metabolism Quantified in Humans Using 2-18F-Fluoro-2-Deoxy-D-Galactose PET/CT
- Analysis of Site-specific Glycosylation of Renal and Hepatic {gamma}-Glutamyl Transpeptidase from Normal Human Tissue
- Nuclear Imaging Techniques for the Assessment of Hepatic Function in Liver Surgery and Transplantation