


Abstract
The goal of this investigation was to assess the accuracy of 7′-Z-[125I]iodorotenone (125I-iodorotenone) as a new deposited myocardial flow tracer and compare the results with those for 99mTc-sestamibi. Methods: The kinetics of these two flow tracers were evaluated in 25 isolated, erythrocyte- and albumin-perfused rabbit hearts over a flow range relevant to patients. The two flow tracers and a vascular reference tracer (131I-albumin) were introduced simultaneously as a compact bolus through a port just above the aortic cannula in the absence of tracer recirculation. Myocardial extraction, retention, washout, and uptake parameters were computed from the venous outflow curves using the multiple-indicator dilution technique and spectral analysis. Results: The extraction of 125I-iodorotenone was much higher than the extraction of 99mTc-sestamibi (0.84 ± 0.05 vs. 0.48 ± 0.10, respectively, P < 0.001). 125I-iodorotenone extraction was also less affected by flow than was 99mTc-sestamibi (P < 0.001). Net retention of 125I-iodorotenone was significantly greater than 99mTc-sestamibi net retention at 1 min (0.77 ± 0.08 vs. 0.41 ± 0.11, respectively, P < 0.001) and 26 min (0.46 ± 0.13 vs. 0.27 ± 0.11, respectively, P < 0.001) after tracer injection. Flow had less effect on 125I-iodorotenone net retention than on 99mTc-sestamibi net retention 1 min after tracer injection (P < 0.04). However, at 26 min, flow had an equivalent effect on the retention of both flow tracers (P < 0.4). The relationship between 125I-iodorotenone and 99mTc-sestamibi washout was complex and depended on elapsed time after isotope introduction and perfusion rate. Reflecting the favorable extraction and retention characteristics of 125I-iodorotenone, both its maximum myocardial uptake and its 26-min uptake were more closely related to flow than were those of 99mTc-sestamibi (P < 0.001 for both comparisons). Conclusion: The extraction and retention of 125I-iodorotenone were greater than those of 99mTc-sestamibi, making 125I-iodorotenone the superior flow tracer in the isolated rabbit heart.
Most perfusion tracers in clinical use are deposited in the myocardium in proportion to flow, allowing visual evaluation of regional perfusion without the use of mathematic models. Ideally, deposited flow tracers should be completely extracted and retained by the myocardium so that tissue tracer deposition and myocardial blood flow are directly and linearly proportional. However, all deposited flow tracers currently in use are incompletely extracted and retained by the myocardium (1–7), adversely affecting the proportionality between tissue tracer content and myocardial blood flow.
A major goal in developing new perfusion agents is to increase tracer extraction and retention to improve the proportionality between myocardial tracer deposition and blood flow. With this goal in mind, we evaluated a new tracer, 7′-Z-[125I]iodorotenone (125I-iodorotenone) (8), a neutral, lipophilic compound that is thought to bind to complex I of the mitochondrial electron transport chain (9–12). We used the multiple-indicator dilution technique (13) to evaluate myocardial 125I-iodorotenone kinetics at flow rates ranging from 0.5 to 3.7 mL/min/g of left ventricular wet weight. The experimental preparation was the isolated, isovolumic rabbit heart perfused retrograde with red blood cells (RBCs) and albumin (6,14). The results obtained with 125I-iodorotenone were compared with those for 99mTc-sestamibi, a perfusion tracer that is already in clinical use and that also accumulates in mitochondria (15).
Myocardial tracer deposition was computed from venous outflow curves after bolus introduction of 125I-iodorotenone and 99mTc-sestamibi together with an intravascular reference tracer, 131I-albumin. The venous outflow curves of the two flow tracers are a function of intravascular transport and dispersion, which is measured by the albumin curve, as well as extravascular extraction and retention by the myocardium. When tracers are evaluated in the heart, separation of extravascular and intravascular tracer kinetics is desirable. This separation can be done by computing the unit impulse response function to an input consisting of the venous concentration curve for the intravascular tracer (6,16). In this study, spectral analysis (17) was used to compute the unit impulse response functions of 125I-iodorotenone and 99mTc-sestamibi, providing a quantitative description of their extravascular tracer kinetics that was independent of intravascular tracer distribution. Spectral analysis also has an advantage in that it allows conventional compartmental analysis without prior knowledge of the number of compartments that the physiology may require or that the data will support.
Our results indicate that 125I-iodorotenone is superior to 99mTc-sestamibi as a deposited flow tracer in the isolated rabbit heart. Although 125I-iodorotenone is unsuitable for clinical use (half-life, 60 d), the ability to label rotenone with the single-photon–emitting 123I (half-life, 13 h) or the generator-produced, positron-emitting 122I (half-life, 3.5 min) indicates that labeled iodorotenone can be used with SPECT or PET in patients.
MATERIALS AND METHODS
Preparation for Experiment
All procedures were performed in accordance with institutional guidelines for animal research. Preparation of isovolumic, retrograde, RBC- and albumin-perfused rabbit hearts (n = 25) was similar to that reported previously (6,14). Hearts were obtained from male New Zealand rabbits (R & R Rabbitry, Stanwood, WA) weighing approximately 4 kg. The perfusate buffer was a modified Tyrode’s solution containing oxygenated bovine erythrocytes and 22 g/L bovine serum albumin (Fraction V, fatty-acid free; Boehringer Mannheim Corp., Indianapolis, IN). The specific electrolyte concentrations (in mmol/L) were 110 for NaCl, 2.5 for CaCl2, 6 for KCl, 1 for MgCl2, 0.435 for NaH2PO4, and 28 for NaHCO3. Glucose concentration was 5 mmol/L and sodium pyruvate was 2 mmol/L. The mean (±SD) pH value was 7.41 ± 0.04, and the partial pressure of oxygen was 316 ± 90 mm Hg. The concentration of RBCs in the perfusate buffer was adjusted to a hematocrit level of 17%–20%.
A fluid-filled latex balloon connected to a Gould-Statham P23ID pressure transducer (Gould, Oxnard, CA) was inserted into the left ventricle. The balloon was inflated to maintain diastolic pressure at 6–10 mm Hg. A coronary venous sampling catheter and needle thermistor (Omega Engineering, Stamford, CT) were inserted into the right ventricle. The hearts were paced at a rate of 180 bpm. Temperature was maintained between 36°C and 38°C with a water-jacketed heating coil and heart chamber. Coronary flow was held constant with a peristaltic pump (Rainin Instruments, Woburn, MA). The flow rate for control hearts was approximately 1.5 mL/min/g of left ventricular wet weight.
After the heart was prepared, an equilibration period of at least 15 min preceded all experimental interventions. During the equilibration period, developed pressure (peak systolic minus diastolic) was stable and averaged 85 ± 15 mm Hg (minimum developed pressure, 60 mm Hg). After equilibration, myocardial perfusion was gradually changed to the experimental flow rate and subsequently held constant by the perfusion pump. Twenty-five hearts were studied, with each heart evaluated at only one flow rate, which ranged from 0.5 to 3.7 mL/min/g of left ventricular wet weight (on the basis of previous work, flow rates greater than 0.5 mL/min/g of left ventricular wet weight are not ischemic (14)). Ten minutes after equilibration at the experimental flow rate, a mixed isotope bolus consisting of 131I-albumin, 125I-iodorotenone, and 99mTc-sestamibi (7.4–14.8 kBq of each isotope in 0.2 mL perfusate buffer) was injected just above the aortic cannula. Venous sampling was performed as previously described (6).
Radiopharmaceuticals
99mTc-sestamibi was purchased from Syncor International (Berkeley, CA). Bovine serum albumin was labeled with 131I (DuPont NEN Research Products, Boston, MA) using a protein iodination technique based on the IODO-GEN reagent (Pierce Chemical Co., Rockford, IL) (18). 125I-iodorotenone was prepared as described by Enas et al. (8).
RBC Uptake and Albumin Binding Studies
The availability of free 125I-iodorotenone to the myocardium was found by determining the binding of 125I-iodorotenone to bovine erythrocytes in the presence and absence of bovine serum albumin in three experiments. All binding experiments included 99mTc-sestamibi for comparison.
One set of tubes containing the radiotracers, albumin (2.2%), and washed RBCs (21%) in perfusate buffer was incubated at room temperature for periods of 30 s to 35 min, followed by centrifugation to pellet the cells. A second set of tubes without albumin was also incubated. The relative uptake into the cells was then determined by counting the RBC pellets and the supernatants (with or without albumin). Some of the albumin-and-buffer supernatants were further treated with trichloroacetic acid to assess the degree of association between 125I-iodorotenone and albumin.
The rate of release of 125I-iodorotenone by RBCs to albumin-containing buffer was also studied in one experiment. RBCs suspended in buffer without albumin were loaded with 125I-iodorotenone and 99mTc-sestamibi by a 15-min incubation followed by centrifugation. The RBC pellet was then resuspended in albumin and buffer, and aliquots were removed at times varying from 1 to 30 min. These aliquots were centrifuged, and the radioactivity was counted.
Data Acquisition and Data Analysis
Venous samples and aliquots of a dilution of the mixed isotope injection solution were counted on a gamma counter as previously described (6). Myocardial extraction, washout, retention, and uptake of 125I-iodorotenone and 99mTc-sestamibi were assessed from the measured venous activity. The venous activity was expressed as a fractional venous appearance rate, h(t), computed by the formula:
 1
where F denotes the blood flow (mL/s), Ci(t) denotes the venous sample activity (cps/g), and Q0 denotes the injected activity (cps).
1
where F denotes the blood flow (mL/s), Ci(t) denotes the venous sample activity (cps/g), and Q0 denotes the injected activity (cps).
The multiple-indicator dilution technique and spectral analysis (17) were used to assess blood–tissue exchange of 125I-iodorotenone and 99mTc-sestamibi. The fundamental assumption of the multiple-indicator dilution technique is that the intravascular reference tracer (131I-albumin) accurately measures intravascular perfusion tracer transport and dispersion. Therefore, any differences between the 131I-albumin venous concentration curve and the curves for 125I-iodorotenone and 99mTc-sestamibi reflect perfusion tracer transit time delays caused by movement into and out of the extravascular space. Mathematically, a linear-systems approach is used in which it is assumed that no interaction occurs between molecules of the perfusate or labeled tracers and that the uptake of any one molecule does not influence the uptake of any other. Using this formalism, each perfusion tracer in the venous output of the heart is modeled as a convolution of the appearance of the intravascular reference tracer with a unit impulse response function that characterizes the extravascular kinetics of the perfusion tracer.
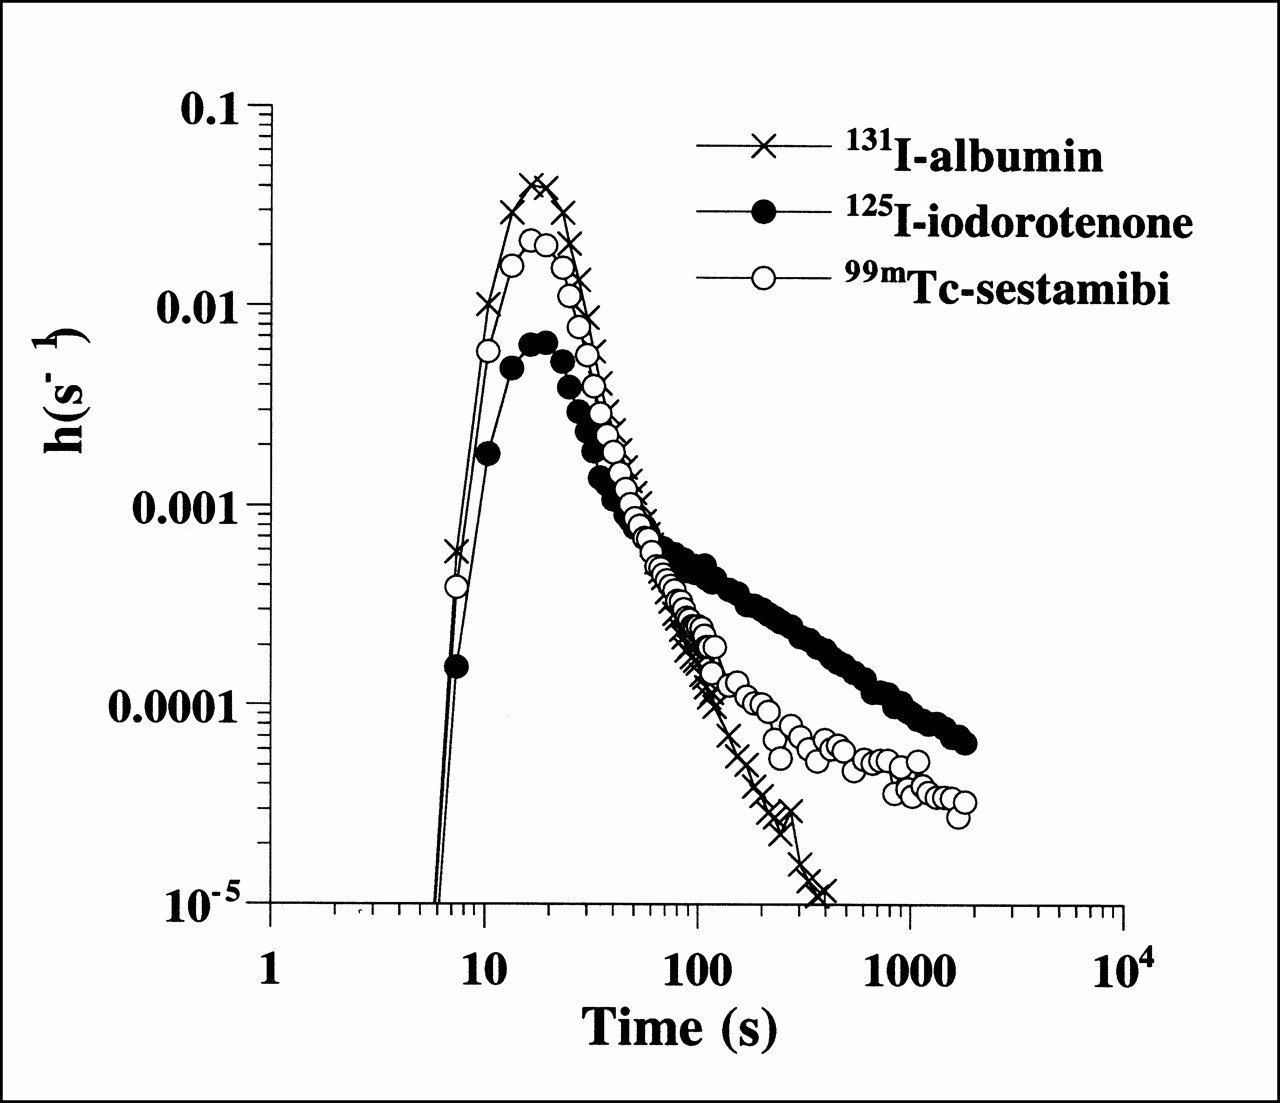
Spectral analysis uses the differences in fractional venous appearance curves for albumin and perfusion tracer (Fig. 1) to quantify extravascular transit time delays for 125I-iodorotenone and 99mTc-sestamibi by producing a spectrum of kinetic components that describe the unit impulse response function of each flow tracer. The impulse response function is the diffusible tracer venous concentration curve that would be observed after an idealized bolus without circulatory tracer dispersion or transport delay.

Fractional venous appearance rate, h(s−1), of 125I-iodorotenone, 99mTc-sestamibi, and 131I-albumin as function of venous collection time from experiment with flow rate of 1.3 mL/min/g of left ventricular wet weight.
Spectral analysis computes the impulse response by deconvolving the venous concentration curves for the perfusion tracer by the curve for the intravascular reference tracer (131I-albumin). A nonnegative weighted least squares algorithm was used to model the diffusible tracer fractional venous appearance rate, hD(t), as having one component that behaves like the reference tracer, hR(t), along with delayed components, each of which can be represented as the convolution of the reference tracer curve with a decaying exponential:
 2
where the unit impulse response function is:
2
where the unit impulse response function is:
 3
and δ(t) is the Dirac delta function yielding the component that behaves like the reference tracer. This undelayed component contains the fraction c0 of injected activity that never escaped into the extravascular space. Extrapolating the spectral model to infinite time, the jth delayed component contains a fraction cj of the injected activity that has a mean transit delay time of tj caused by bidirectional diffusion between vasculature and cell.
3
and δ(t) is the Dirac delta function yielding the component that behaves like the reference tracer. This undelayed component contains the fraction c0 of injected activity that never escaped into the extravascular space. Extrapolating the spectral model to infinite time, the jth delayed component contains a fraction cj of the injected activity that has a mean transit delay time of tj caused by bidirectional diffusion between vasculature and cell.
A total of 100 nonnegative components were used, with exponential time constants ranging from 1 s to 190 min equally spaced on a logarithmic scale. Because of the relatively short time frame of the experiments (26 min) compared with the mean transit time of the slowest possible spectral component (190 min), the extrapolated spectral component fractions were not constrained to add up to 1. Given m positive delayed components indexed according to increasing mean transit delay time, the first m − 1 components are termed intermediate components and the mth component is termed the slow component. Using this kinetic model, the extraction fraction (D0) for the diffusible tracer is:
 4
and the combined fraction and combined mean transit delay time for the intermediate components are:
4
and the combined fraction and combined mean transit delay time for the intermediate components are:
 5.
5.
The deconvolved net tracer retention, Enet(t), at time t is:
 6Net tissue tracer uptake, U(t), provides a measure of tissue tracer content and is computed as the product of tracer delivery by way of myocardial blood flow and net tracer retention:
 7The deconvolved fractional escape rate, FER(t), a measure of tracer washout, is calculated as the ratio of the delayed components of the impulse response and the deconvolved net tracer retention, for t > 0:
 8
8
Statistics
Data are expressed as mean ± SD. Statistical analyses were performed using the MATLAB Statistics Toolbox (MathWorks, Natick, MA). Regression lines were obtained using the unweighted least squares method. A t test was used to test hypotheses about the slopes and y-intercepts of individual regression lines. The slopes of regression lines were compared using Welch’s procedure (19). Paired comparisons of kinetic parameters of 125I-iodorotenone and 99mTc-sestamibi were made using both a paired t test and a nonparametric Wilcoxon signed rank test. In all cases, the two tests yielded similar results with respect to the statistical significance of the differences, and the larger of the two values of P is reported. P < 0.05 was considered statistically significant.
RESULTS
RBC and Albumin Binding
125I-iodorotenone was observed to bind strongly to bovine RBCs and albumin. In the absence of albumin, an average of 97.1% (±1.1%) of the 125I-iodorotenone was associated with the RBC pellet. This binding reached a steady state almost immediately: the 30-s incubation showed 98% uptake and remained constant for 30 min. In the presence of albumin, the RBC–to–125I-iodorotenone binding decreased to an average of 53.1% (±0.65%). Again, steady state was reached within 30 s. Precipitation of albumin with trichloroacetic acid indicated that at least 81% (±6.7%) of the activity that was not associated with blood was instead associated with the albumin.
When RBCs loaded with 125I-iodorotenone were exposed to albumin and buffer, they immediately released some of the radiotracer into the solution; that is, at 1 min approximately 35% of the radiotracer was released. This release increased slowly for 30 min, at which time the partitioning between the RBCs and the albumin and buffer approached that seen in the initial binding experiments (55% in the RBCs).
99mTc-sestamibi behaved differently. The level of RBC binding was independent of the presence of albumin. The 30-s incubations showed that 25.4% (±2.9%) of the 99mTc-sestamibi was bound to the RBCs, and this level increased linearly to 40.6% (±1.3%) at 30 min.
Myocardial Tracer Distribution
Figure 1 shows an example of the distribution of transit times (expressed as fractional venous appearance rates) of the intravascular tracer, 131I-albumin, and the two perfusion tracers, 125I-iodorotenone and 99mTc-sestamibi. Although the tracer is introduced as a compact arterial bolus, tracer transport through the myocardium resulted in considerable temporal dispersion of all three tracers in the venous effluent. For the intravascular tracer, the fractional venous appearance rate reflected the distribution of transit times through the myocardial vasculature as well as the arterial inflow and venous outflow tubing. For the two perfusion tracers, some tracer molecules failed to escape the capillary and exhibited the same transit time distribution as the intravascular tracer. However, other tracer molecules diffused out of the capillary into the tissue, where they remained trapped or reentered the vascular space later. Qualitatively, the effect of perfusion tracer escape into the extravascular space was reflected in the lower fractional venous appearance rates of 125I-iodorotenone and 99mTc-sestamibi relative to 131I-albumin during the initial peak of the venous outflow curves. Subsequent reentry of previously extracted tracer was seen during the later portions of the curves when the fractional venous appearance rates for the two perfusion tracers exceeded the rate for the intravascular tracer.
Spectral Analysis
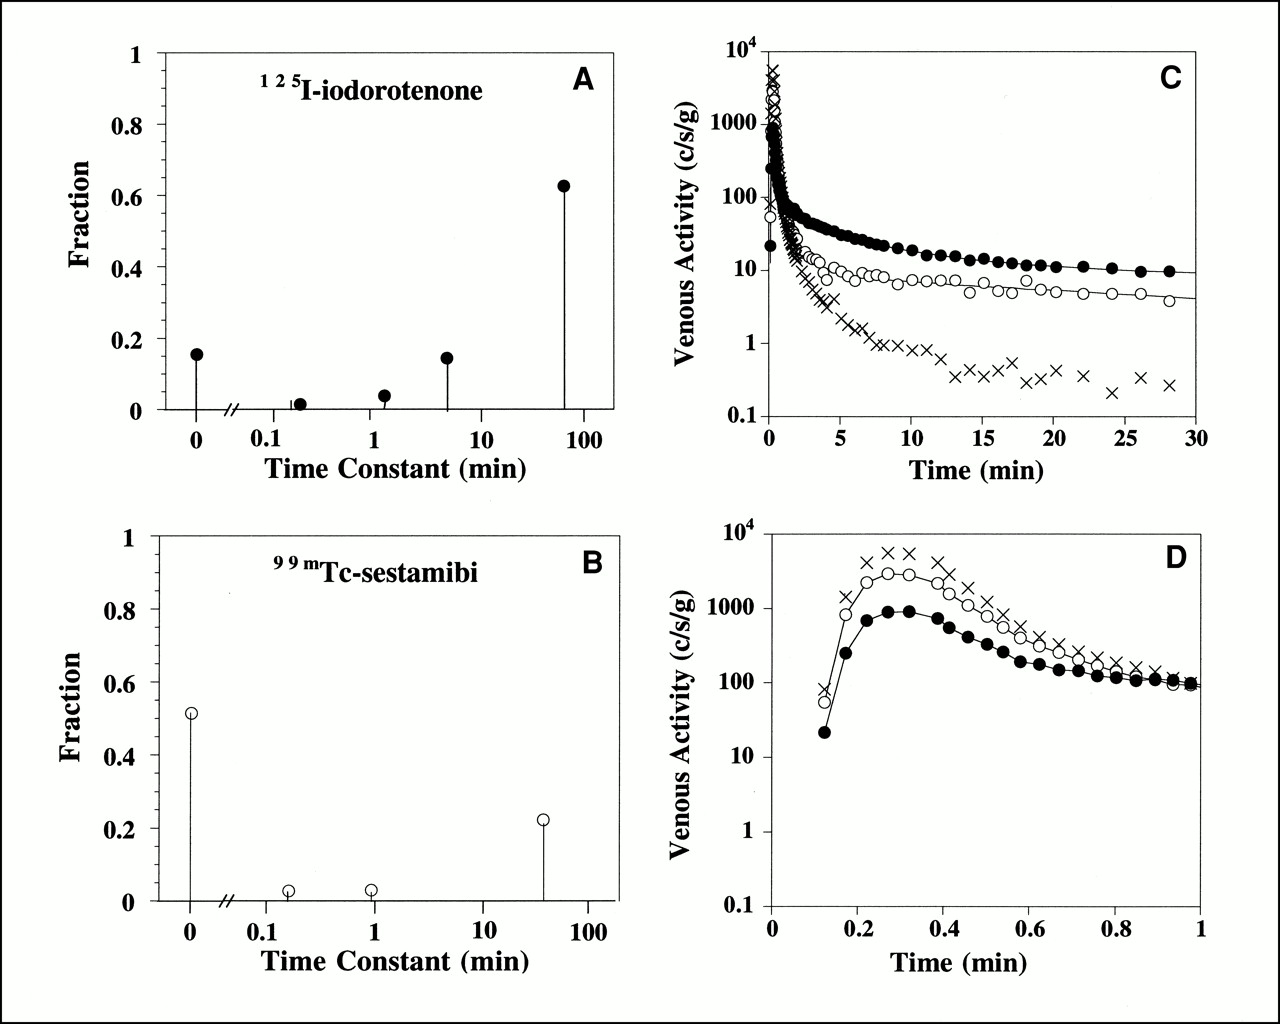
The spectral kinetic components that describe the impulse response function for the 125I-iodorotenone and 99mTc-sestamibi venous concentration curves from the experiment shown in Figure 1 are illustrated in Figures 2A and B. The modeled curves (Figs. 2C and D) were obtained by convolving the measured 131I-albumin intravascular reference tracer curve with the impulse responses given by the spectral models. For this example, the 125I-iodorotenone impulse response (Eq. 3) had an undelayed component that contained a fraction c0 = 0.15 of the injected activity and four delayed components (Fig. 2A). The slowest component contained a fraction c4 = 0.63 of the injected activity and had a mean transit delay time of t4 = 67 min. The three intermediate components (Eq. 5) contained a combined fraction c1,2,3 = 0.20 of the injected activity and had a combined mean transit delay time of t1,2,3 = 3.9 min. By comparison, the 99mTc-sestamibi impulse response had an undelayed component that contained a fraction c0 = 0.51 of the injected activity and three delayed components (Fig. 2B). The slowest component contained a fraction c3 = 0.22 of the injected activity and had a mean transit delay time of t3 = 39 min. The two intermediate components contained a combined fraction c1,2 = 0.06 of the injected activity and had a combined mean transit delay time of t1,2 = 35 s.

Spectral model components for 125I-iodorotenone (A) and 99mTc-sestamibi (B) and fitted concentration curves for entire experiment (C) and first minute (D). Lines through 125I-iodorotenone and 99mTc-sestamibi data points are fitted curves. Data are from experiment shown in Figure 1. • = 125I-iodorotenone; ○ = 99mTc-sestamibi; × = 131I-albumin.
The spectral model parameters exhibited relatively large variability when the 25 individual hearts were compared (Table 1). The number of delayed components, m, in the impulse responses ranged from 2 to 6 for both 125I-iodorotenone and 99mTc-sestamibi. For each experiment, the number of 125I-iodorotenone components was greater than or equal to the number of 99mTc-sestamibi components. On average, the 125I-iodorotenone models contained 4.3 delayed components and the 99mTc-sestamibi models contained 3.2 delayed components. In three fourths of the experiments, the 125I-iodorotenone slow-component fraction, cm, was estimated to be at least 0.51, with a mean transit delay time, tm, of at least 45 min. The comparable cm and tm estimates for 99mTc-sestamibi were at least 0.17 and at least 26 min, respectively. In 10 experiments, the 125I-iodorotenone slow component was assigned a mean transit delay time of 190 min, the upper limit of the spectrum. This also occurred for 99mTc-sestamibi in five experiments. The combined fraction for the 125I-iodorotenone intermediate components, c1,…,m − 1, was not affected by flow (P > 0.1), whereas the combined mean transit delay time, t1,…,m − 1, decreased significantly with flow (P < 0.02). The combined fraction and mean transit time for the 99mTc-sestamibi intermediate components were not affected by flow (P > 0.2).
Spectral Analysis Components and Time Constants
The consistency of the modeled curve estimates with the measured data was assessed for each experiment. The convolution of the 131I-albumin reference curves with the impulse responses given by the spectral models was compared with the observed fractional venous appearance curves for the diffusible tracer. For the 25 experiments, the average root mean square differences, normalized by the root mean square values of the measured curve samples and expressed as percentages, were 3.4% ± 2.0% for 125I-rotenone and 3.7% ± 1.5% for 99mTc-sestamibi. These results indicate that the models fit the data well throughout the 26-min time frame of the experiments despite the variability in the spectral model kinetic parameters. Similarly, estimates of extraction fraction (Eq. 4), net retention (Eq. 6), and washout (Eq. 8) obtained by evaluating the impulse response function (Eq. 3) and its time integral also appeared robust.
125I-Iodorotenone and 99mTc-Sestamibi Extraction
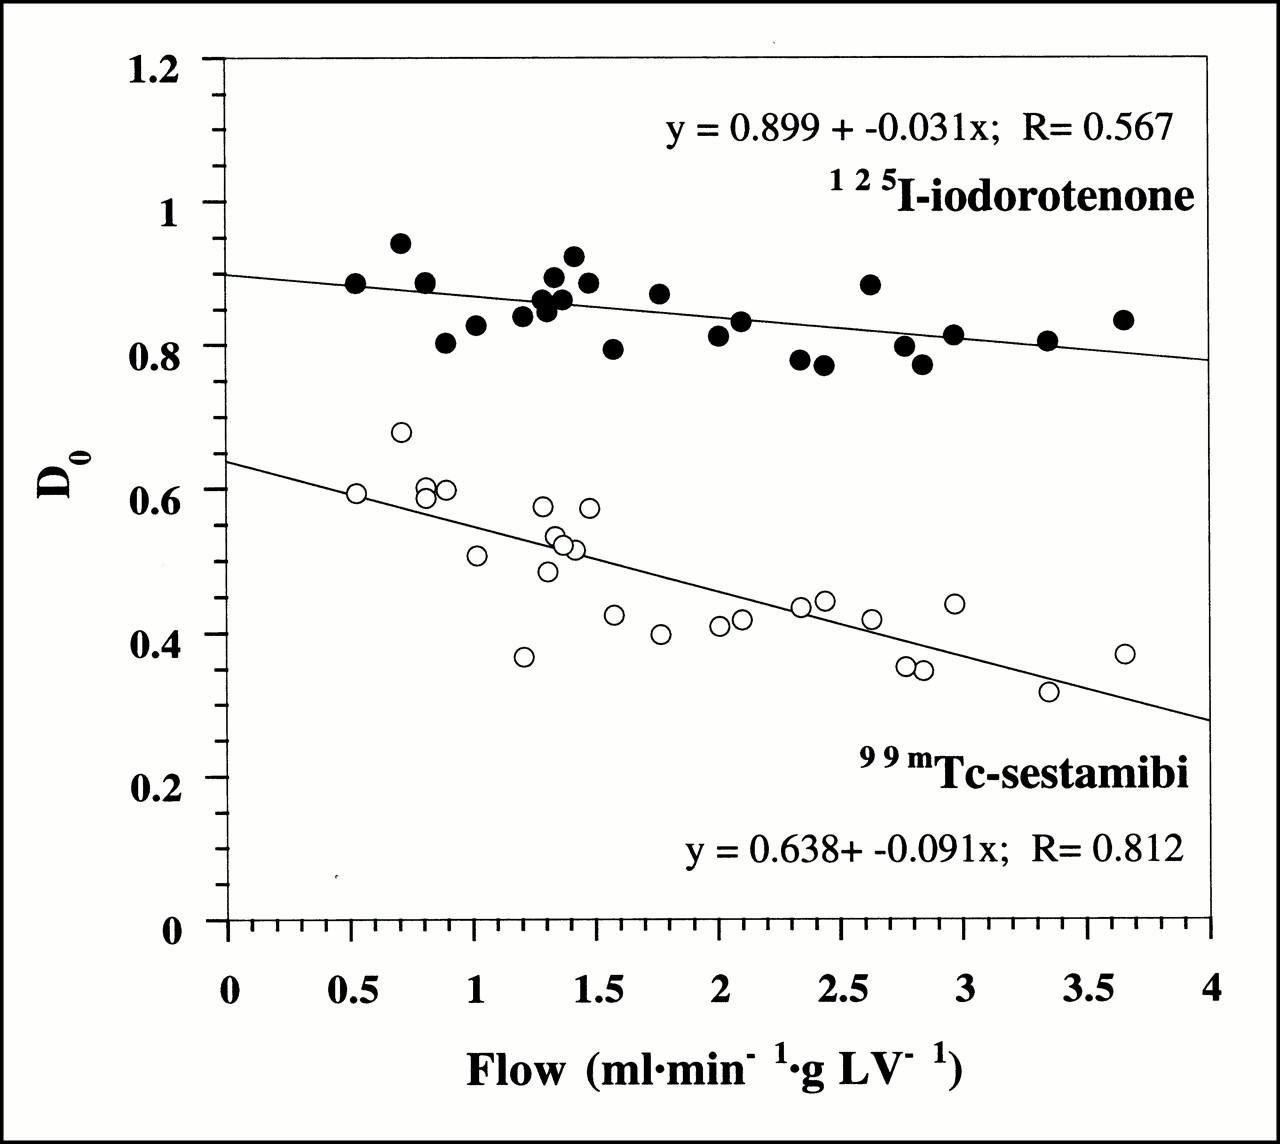
Figure 3 shows the initial extraction fraction values (Eq. 4) as a function of myocardial blood flow for all 25 experiments. Despite the tight binding of 125I-iodorotenone to RBCs and albumin, the average initial extraction fraction for 125I-iodorotenone was almost twice that of 99mTc-sestamibi (0.84 ± 0.05 vs. 0.48 ± 0.10, respectively, P < 0.001). The initial extraction fraction declined for both tracers as flow rate increased. However, the rate of decline with increasing flow was greater for 99mTc-sestamibi than for 125I-iodorotenone (P < 0.001).

Initial extraction fraction, D0, of 125I-iodorotenone and 99mTc-sestamibi as function of blood flow. Data were pooled from 25 experiments, with each data point representing a single experiment. Equations for linear fits to data points are also shown. • = 125I-iodorotenone; ○ = 99mTc-sestamibi.
125I-Iodorotenone and 99mTc-Sestamibi Washout
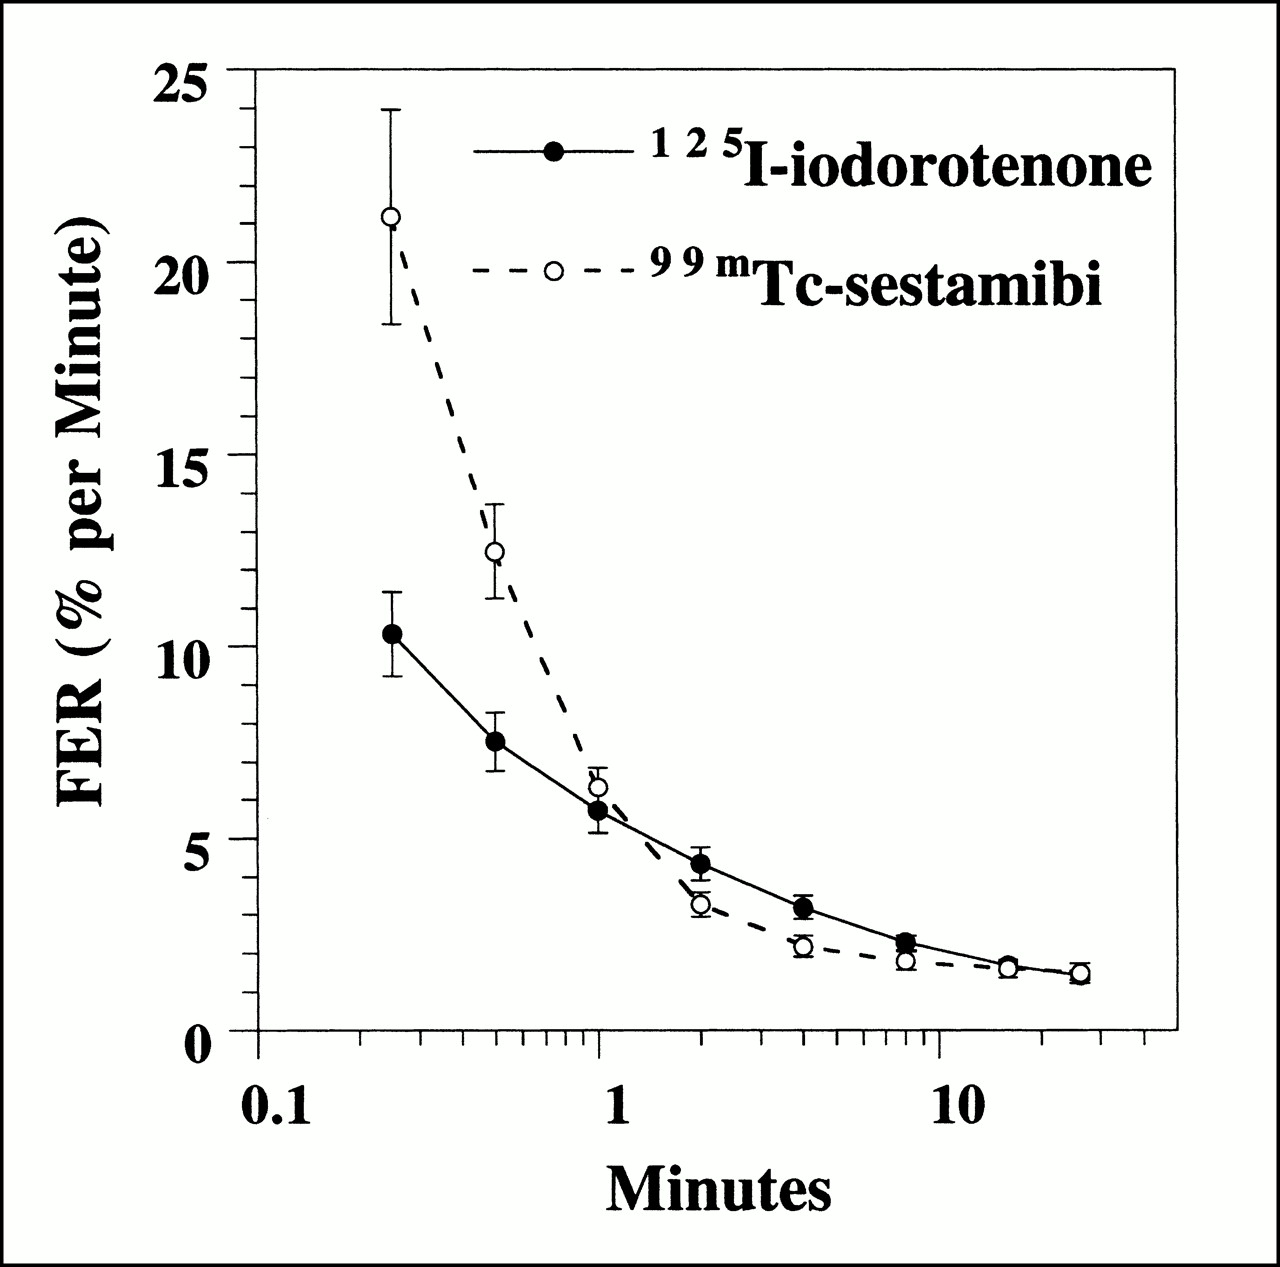
Washout, measured as FER(t) (Eq. 8), for 125I-iodorotenone and 99mTc-sestamibi was evaluated at multiple times (15 and 30 s and 1, 2, 4, 8, 16, and 26 min) after tracer introduction (Fig. 4). The FER for 99mTc-sestamibi was significantly faster than 125I-iodorotenone at 15 and 30 s (P < 0.01) and insignificantly faster at 1 min (P < 0.3). From 2 to 8 min, the FER was significantly faster for iodorotenone than for 99mTc-sestamibi (P < 0.04). At 16 and 26 min, no significant differences in FER were seen for the two tracers.

FER of 125I-iodorotenone and 99mTc-sestamibi as function of time. Data were pooled from 25 experiments, with each data point representing a single time point. • = 125I-iodorotenone; ○ = 99mTc-sestamibi.
The effect of flow on the washout of these two tracers was also evaluated at each of the times listed above. For 125I-iodorotenone, increasing flow rate significantly accelerated the rate of tracer washout at all eight times evaluated (P < 0.02). In contrast, a significant flow effect on 99mTc-sestamibi washout was observed only during the three earliest times (15 and 30 s and 1 min) (P < 0.05).
125I-Iodorotenone and 99mTc-Sestamibi Retention
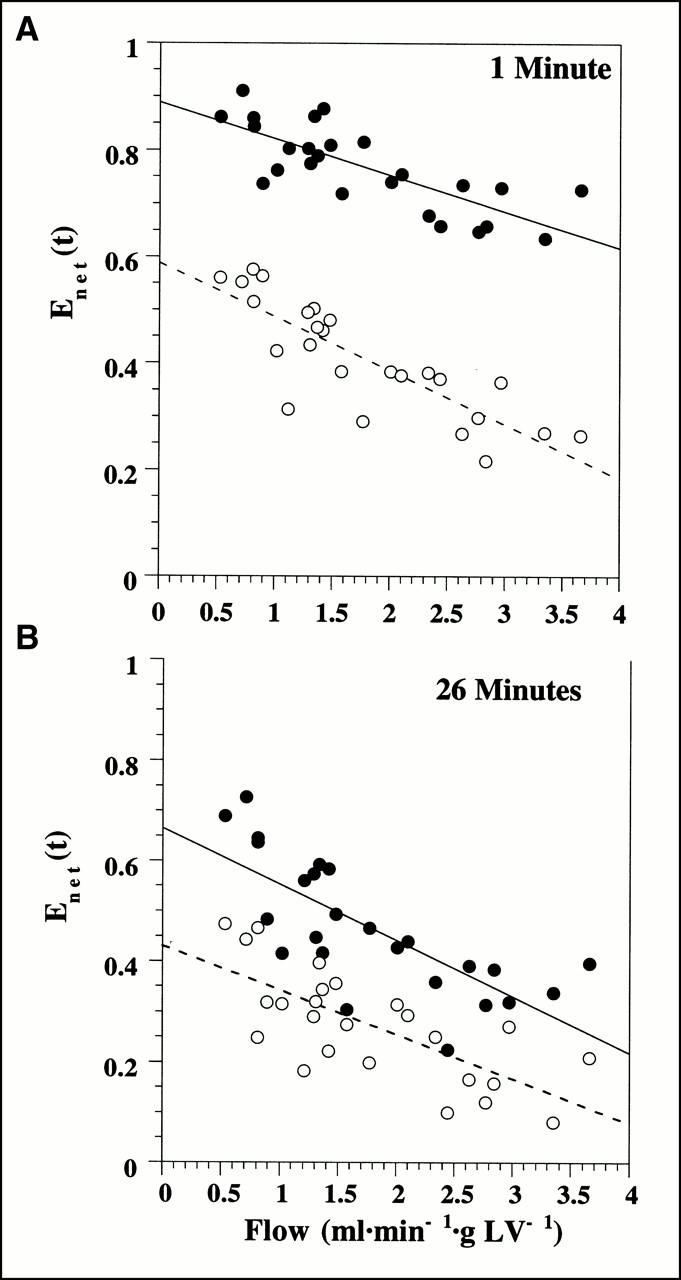
Net retention of 125I-iodorotenone was significantly greater than 99mTc-sestamibi retention at 1 min (0.77 ± 0.08 vs. 0.41 ± 0.11, respectively; P < 0.001) and 26 min (0.46 ± 0.13 vs. 0.27 ± 0.11, respectively; P < 0.001) after tracer injection. Figure 5 shows the retention (Eq. 6) of 125I-iodorotenone and 99mTc-sestamibi at 1 min and 26 min as a function of flow. Also, increasing flow rate had a greater effect on 99mTc-sestamibi retention than on 125I-iodorotenone retention at 1 min (P < 0.04). However, at 26 min, increased flow had a similar effect on the retention of both tracers (P < 0.4).

Deconvolved net tracer retention, Enet(t), of 125I-iodorotenone and 99mTc-sestamibi 1 min (A) and 26 min (B) after tracer injection as function of blood flow. Linear regression equations for 1-min data are y = 0.889 + −0.068x, r = 0.773, for 125I-iodorotenone and y = 0.59 + −0.10x, r = 0.83, for 99mTc-sestamibi. Linear regression equations for data in (B) are y = 0.66 + −0.11x, r = 0.75, for 125I-iodorotenone and y = 0.43 + −0.09x, r = 0.72, for 99mTc-sestamibi. Data were pooled from 25 experiments, with each data point representing a separate experiment. • = 125I-iodorotenone; ○ = 99mTc-sestamibi.
125I-Iodorotenone and 99mTc-Sestamibi Uptake
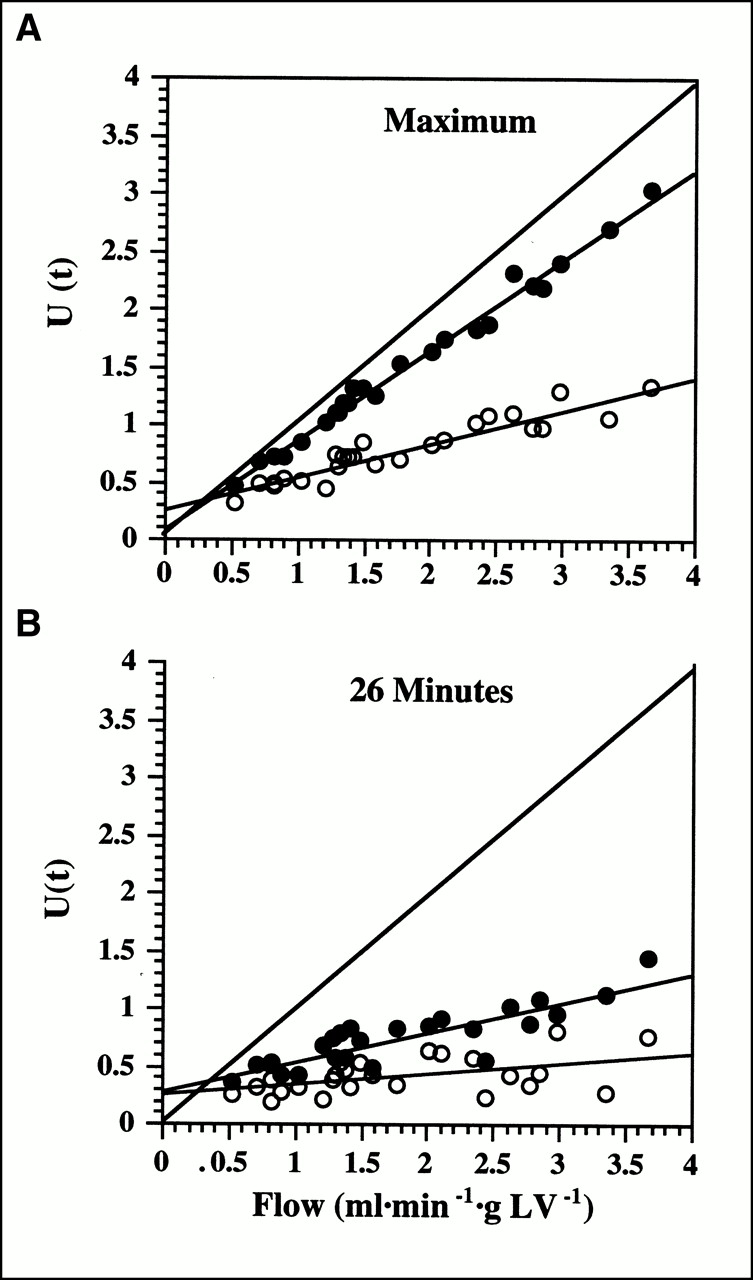
Figure 6 shows the maximum and 26-min net uptake values as a function of flow (Eq. 7). The maximum net uptake corresponds to the product of flow and initial extraction fraction, whereas the 26-min value corresponds to the product of flow and deconvolved net tracer retention at 26 min. For both the initial and the late values, 125I-iodorotenone uptake significantly exceeded 99mTc-sestamibi uptake (P < 0.001), and the rate of increase in uptake with increasing flow was significantly greater for 125I-iodorotenone than for 99mTc-sestamibi (P < 0.001). These data indicate that 125I-iodorotenone is superior to 99mTc-sestamibi as a flow tracer for at least the first 26 min after injection in the isolated rabbit heart.

Net uptake, U(t), of 125I-iodorotenone and 99mTc-sestamibi as function of blood flow: maximum uptake (A) and uptake at 26 min (B). Linear regression equations for data in (A) are y = 0.08 + 0.78x, r = 0.99, for 125I-iodorotenone and y = 0.26 + 0.29x, r = 0.94, for 99mTc-sestamibi. Linear regression equations for data in (B) are y = 0.29 + 0.26x, r = 0.86, for 125I-iodorotenone and y = 0.25 + 0.09x, r = 0.51, for 99mTc-sestamibi. Line of identity is also shown for reference. Data were pooled from 25 experiments. • = 125I-iodorotenone; ○ = 99mTc-sestamibi.
DISCUSSION
In this investigation, the multiple indicator dilution technique and spectral analysis were used to evaluate 125I-iodorotenone and 99mTc-sestamibi kinetics in the isolated rabbit heart at flow rates ranging from 0.5 to 3.7 mL/min/g of left ventricular wet weight. Although both tracers are thought to accumulate in mitochondria, their blood–tissue exchange kinetics were quite different. Virtually all the labeled rotenone compound was bound to RBCs and albumin, whereas only 25% of 99mTc-sestamibi was bound to RBCs. Despite the differences in blood component binding, the extraction of 125I-iodorotenone was much higher and less flow dependent than that of 99mTc-sestamibi, indicating that most of the 125I-iodorotenone binding to RBCs and albumin was rapidly reversible.
In addition to RBC and albumin binding, capillary permeability, sarcolemmal permeability, and cellular sequestration are three important factors determining the exchange of these two flow tracers between blood and myocardium. The capillary permeability of a tracer can be estimated from its extraction fraction as determined with deconvolution and the multiple-indicator dilution technique (6,13,16). The much higher extraction fraction for the rotenone compound indicates that it penetrated the capillary wall more efficiently than did 99mTc-sestamibi. Because 125I-iodorotenone is both neutral and lipophilic, a plausible speculation would be that the rotenone compound diffused through endothelial cell membranes whereas the charged 99mTc-sestamibi was limited to diffusing through the small pores in capillary walls.
Once the tracer is outside the capillary, the major barrier opposing penetration into the myocyte is the sarcolemma. In the current experiments, kinetic characterization of sarcolemmal permeability is more difficult because it cannot be isolated in time from other kinetic events involved in the bidirectional movement of tracer between the vasculature and the cell. However, because deconvolution removed the dynamics of intravascular tracer transport and dispersion from extravascular tracer exchange, early FER computed using spectral analysis provides a measure of fractional backdiffusion from the extracellular space into the capillary. The fact that early FER(t) was higher for sestamibi than for iodorotenone indicates that a larger fraction of initially extracted sestamibi diffused back from the extracellular space into the vasculature. This finding is consistent with slower sestamibi diffusion across the sarcolemma. An explanation for this observation is that, similar to the capillary wall, the neutral iodorotenone penetrated the sarcolemma more readily than did the cationic sestamibi.
Once inside the cell, both 125I-iodorotenone and 99mTc-sestamibi are thought to accumulate in mitochondria (9,10,15). Rotenone and its analogs inhibit the reduction of ubiquinone by complex I of the mitochondrial electron transport chain and bind to the same site as other inhibitors of complex I, such as piericidin and 1-methyl-4-phenylpyridinium ion (9,11,12). In addition, a substantial amount of rotenone is bound nonspecifically in the mitochondrial membrane (9). The mitochondrial binding characteristics of 125I-iodorotenone have not been investigated; however, because it is more lipophilic than rotenone, much of the iodorotenone retained in the heart may possibly be nonspecifically bound in the mitochondrial membrane. In contrast, 99mTc-sestamibi accumulates in the mitochondrial matrix, and its passage through the mitochondrial membrane depends on maintenance of electric gradients by activated mitochondria (15,20). Therefore, similar to penetration through capillary and cell membranes, the mechanisms by which these two tracers are retained in mitochondria are also quite different. Presumably, the different mechanisms governing blood–tissue exchange are responsible for the considerable differences in kinetic behavior of these two mitochondrial-avid perfusion tracers.
Comparison of 125I-Iodorotenone with Other Flow Tracers
Three general classes of deposited myocardial perfusion tracers exist: potassium analogs, cationic lipophilic tracers, and neutral lipophilic tracers. Comparing 125I-iodorotenone with the potassium analogs, its mean extraction (0.84) is in the range reported for 201Tl and 82Rb (0.67–0.88) (4,6,21,22). In contrast, mean extraction is considerably greater for 125I-iodorotenone than for the two cationic lipophilic tracers, sestamibi and Q12 (0.26–0.55), that have been evaluated with the multiple-indicator dilution technique (3,4,7). In this study, net retention was greater for 125I-iodorotenone than for 99mTc-sestamibi during the 26 min evaluated. Because 99mTc-sestamibi has been reported to be better retained than 201Tl and 82Rb (3,4,6), it follows that net retention is also superior for 125I-iodorotenone than for the two potassium analogs. Therefore, in the isolated rabbit heart, 125I-iodorotenone combines the desirable extraction characteristics of the potassium analogs with superior net retention.
Extraction and retention of 125I-iodorotenone was excellent despite avid binding to RBCs and albumin. RBC and albumin binding are features common to all neutral lipophilic tracers that have been evaluated in the heart. In addition, binding to blood components appears to play an important role in the ability of these agents to trace myocardial perfusion. 62Cu-pyruvaldehyde-bis(N4-methylthiosemicarbazone) and 99mTc-teboroxime have inadequate extraction and retention kinetics in humans despite initially promising results in experimental animals (5,23–26). For both tracers, RBC or albumin binding is thought to be responsible for the disappointing results in patients (24,27). [bis(N-ethoxy, N-ethyl dithiocarbamato)nitrido 99mTc] (TcN-NOET) is a neutral, lipophilic perfusion tracer that is undergoing clinical evaluation (28). This agent is the first 99mTc flow tracer that redistributes like thallium. Although the effect of RBC and albumin binding on the accuracy of this perfusion tracer is not yet clear, the possibility has been proposed that reversible blood component binding may provide an intravascular pool of tracer that could equilibrate with underperfused myocardium in delayed images and explain the redistribution of TcN-NOET (29). Iododesmethylimipramine was initially proposed as a molecular microsphere on the basis of its nearly complete extraction and retention in buffer-perfused hearts (30). However, when the tracer was evaluated in the presence of blood, significant tracer washout occurred because of binding to RBCs and albumin, thus reducing accuracy as a perfusion tracer. Extrapolation of the results of these neutral, lipophilic perfusion tracers to 125I-iodorotenone suggests that, although bovine RBCs and albumin had at most a modest effect on extraction and retention in the isolated rabbit heart, blood component binding could play a more important role in other species, including humans.
Spectral Analysis
In a previous report evaluating 86Rb and 201Tl kinetics, we used a nonparametric deconvolution procedure to estimate the impulse response function that was nonnegative and monotonically decreasing (6). The nonparametric deconvolution used in that report did not yield an analytic expression for the impulse response function. In addition, the data were resampled into equal time bins to expedite convolution. In this study, in contrast, spectral analysis provided an analytic expression for the impulse response function, and the time intervals were allowed to vary according to the sampling protocol. Because of these differences in data analysis, direct comparison of the current spectral analysis to the previous deconvolution procedure is of limited value.
The spectral-model component fractions and mean transit delay times were poorly reproducible when comparing hearts. Three potential explanations exist. First, the 26-min time frame of the experiments may not have provided adequate data to precisely resolve the slow-component fraction and mean transit delay time, particularly at low flows when the 131I-albumin intravascular reference tracer had increased time dispersion. Second, use of a decaying exponential basis function may be inadequate to accurately describe the kinetics of myocardial tracer distribution. Third, flow affected the extraction, washout, and retention of both tracers. Because these parameters were computed from the impulse response function derived from spectral analysis, the fivefold variation in flow rate may have adversely affected the reproducibility of the spectral model kinetic components.
Despite the variability, convolution of the 131I-albumin curves with the computed impulse response functions fit the experimentally measured diffusible tracer curves well. The impulse response function derived from spectral analysis has two important advantages. First, it is independent of the form of the input function and would be equally valid in the in vivo rabbit heart after intravenous tracer injection and in the in vitro rabbit heart. Second, the impulse response function reflects only extravascular tracer kinetics, providing a clear separation of intravascular tracer distribution from penetration into tissue.
CONCLUSION
The multiple-indicator dilution technique and spectral analysis were used to compare the extraction, retention, washout, and uptake of 125I-iodorotenone with those of 99mTc-sestamibi in the isolated RBC- and albumin-perfused rabbit heart. 125I-iodorotenone was shown to have superior extraction, retention, and uptake characteristics, making it the better flow tracer in the in vitro rabbit heart. Because iodorotenone can be labeled with radionuclides suitable for use with SPECT or PET, our results provide substantial motivation for further evaluating this compound in vivo.
Acknowledgments
The authors thank Michelle Huesman, Steve Hanrahan, and Amy Schustz for excellent technical assistance. This study was supported by National Heart, Lung, and Blood Institute grants PO1 HL25840 and RO1 HL60877 and by the director of the Office of Science, Office of Biological and Environmental Research (OBER), Medical Science Division of the U.S. Department of Energy under OBER contract DE-AC03-76SF00098.
Footnotes
Received Feb. 14, 2000; revision accepted Jun. 30, 2000.
For correspondence or reprints contact: Robert C. Marshall, MD, Center for Functional Imaging, E.O. Lawrence Berkeley National Laboratory, University of California, 1 Cyclotron Rd., MS55-121, Berkeley, CA 94720.
REFERENCES
In this issue


Jump to section
Related Articles
Cited By...
- Flow-Dependent Uptake of 123I-CMICE-013, a Novel SPECT Perfusion Agent, Compared with Standard Tracers
- Myocardial Uptake of 7'-(Z)-[123I]Iodorotenone During Vasodilator Stress in Dogs With Critical Coronary Stenoses
- Kinetic Analysis of 18F-Fluorodihydrorotenone as a Deposited Myocardial Flow Tracer: Comparison to 201Tl
- The Quest for the Perfect Myocardial Perfusion Indicator...Still a Long Way to Go