


Abstract
We have synthesized and evaluated 8-[18F]fluoropenciclovir (FPCV) and compared it with 8-[18F]fluoroganciclovir (FGCV) for monitoring the expression of herpes simplex virus type 1 thymidine kinase (HSV1-tk) reporter gene in cell culture and in vivo. Methods: C6 rat glioma cells stably transfected with HSV1-tk (C6-stb-tk+) and control C6 cells were evaluated for their ability to accumulate FGCV versus FPCV. For in vivo studies, 15 mice were injected by tail vein with increasing levels of an adenoviral vector carrying HSV1-tk. Forty-eight hours later the mice were injected with FPCV and killed 3 h later. The percentage injected dose per gram (%ID/g) liver was then determined. Two additional mice were studied by microPET and autoradiography using FPCV to image adenoviral-mediated hepatic HSV1-tk reporter gene expression. A tumor-bearing mouse (C6 control and C6-stb-tk+) was imaged with FDG, FGCV, and FPCV. Two mice carrying tumors expressing two different reporter genes, HSV1-tk and dopamine type 2 receptor (D2R), were also imaged by microPET using FPCV (day 1) and 3-(2′-[18F]fluoroethyl)spiperone (FESP) (day 2). Results: FPCV shows a significantly greater accumulation in C6-stb-tk+ cells than does FGCV (P < 0.05). Over identical ranges of adenoviral administration, mouse liver shows a higher %ID/g liver for FPCV (0%–9%) compared with our previously reported results with FGCV (0%–3%). In C6 control and C6-stb-tk+ tumor-bearing mice, FPCV has a greater accumulation than does FGCV for equal levels of HSV1-tk gene expression. In mice carrying tumors expressing either HSV1-tk or D2R reporter genes, there is a corresponding retention of FPCV and FESP, respectively. Conclusion: These results indicate that FPCV is a better reporter probe than is FGCV for imaging lower levels of HSV1-tk gene expression in vivo. The results also reveal the ability to monitor the expression of two distinct reporter genes in the same animal using reporter probes specific for each gene.
Methods available to image reporter gene expression in living animals are rapidly increasing. Several techniques, including those using PET (1,2), SPECT (3), MRI (4), and charge-coupled device cameras, for imaging bioluminescent reporters (5) are all under active investigation. Of all these approaches, PET is particularly suited for quantitatively imaging animals and humans with a relatively high sensitivity.
For use with PET, reporter genes have been validated that either encode proteins that are able to metabolize positron-labeled reporter probes to products that get trapped in cells or tissues or bind a positron-labeled ligand to its receptor (1–3,6,7). We have recently shown that one can effectively measure the expression of a protein of interest by assaying the expression of a second protein using an internal ribosomal entry site to achieve correlated gene expression (8). The use of reporter genes to investigate various cell populations in animals, and for patients undergoing gene therapy, will require reporter gene–reporter probe combinations with high sensitivity for imaging low levels of reporter gene expression.
Two successful reporter gene–reporter probe systems for use with PET have been reported in the literature. The herpes simplex virus type 1 thymidine kinase (HSV1-tk) reporter gene along with various reporter probes has been studied by us (2,6) and others (1,3,9–11). A second system based on the dopamine type 2 receptor (D2R) reporter gene and 3-(2′-[18F]fluoroethyl)spiperone (FESP) reporter probe has also been reported by us (7). In an attempt to improve the properties of both reporter gene–reporter probe systems for HSV1-tk reporter gene, we have investigated mutant reporter genes with enhanced substrate affinity (12) and also reported preliminary results on the use of penciclovir (PCV) as a potential reporter probe (13). Further details of the development and use of reporter genes are reviewed elsewhere (14,15).
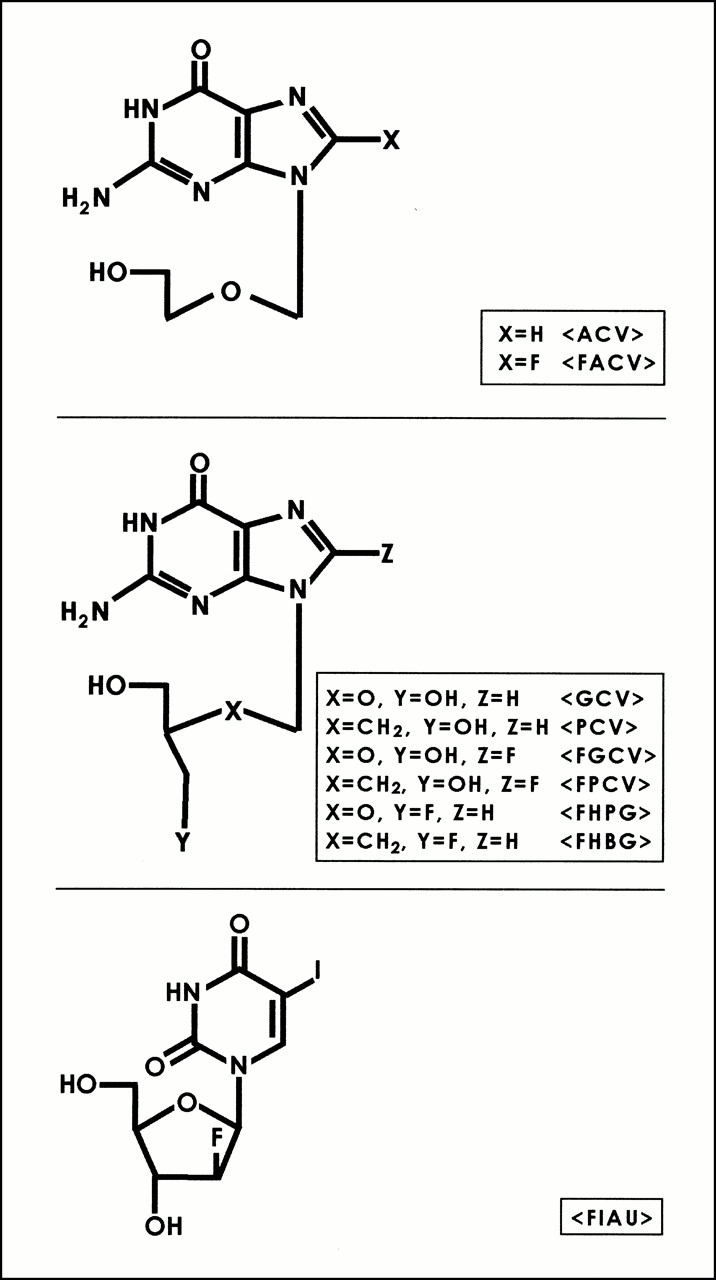
Acyclovir (ACV) and ganciclovir (GCV) have long been used as antiviral agents for the treatment of herpes virus infections. The selectivity of these drugs is attributed to the fact that mammalian thymidine kinases have very low affinity for these substrates relative to HSV1-TK (14). (Note that HSV1-tk refers to the gene and HSV1-TK refers to the corresponding enzyme.) The monophosphate of ACV or GCV can be further phosphorylated by other cellular enzymes, and the triphosphates of these drugs directly interfere with DNA replication (16). GCV has also been labeled in the side-chain position resulting in the synthesis of 9-[(3-[18F]fluoro-1-hydroxy-2-propoxy)methyl]guanine (FHPG) (9,17,18). More recently, Monclus et al. (19) have reported the validation of (R)- and (S)-FHPG in vitro. Alauddin et al. (11) have reported the synthesis and preliminary evaluation of 9-(4-[18F]fluoro-3-hydroxymethylbutyl)guanine (FHBG), the side-chain–fluorinated analog of PCV. In addition to acycloguanosine derivatives, derivatives of uracil (Fig. 1) (e.g., 5-iodo-2′-fluoro-2′-deoxy-1-β-d-arabinofuranosyluracil [FIAU]) have also been explored (3,20,21). These derivatives have been labeled with 124I for use with PET (21) and used as reporter probes for imaging HSV1-tk reporter gene expression.

Structures of HSV1-TK reporter gene substrates. FIAU = 5-iodo-2′-fluoro-2′-deoxy-1-β-d-arabinofuranosyluracil.
The presence of herpes virus–encoded thymidine kinase, only in infected cells, prompted the search for other antiherpes viral agents that exert their effects only in virus-infected cells. PCV is structurally similar to GCV (Fig. 1), but the lack of an ether oxygen in the side chain of PCV has a significant effect on its biologic properties. PCV is a highly selective antiherpes virus agent (22–26). After transport into cells, PCV gets phosphorylated by HSV1-TK to the monophosphate, which subsequently undergoes further phosphorylation by cellular kinases to its corresponding di- and triphosphates. The triphosphate gets incorporated into DNA and inhibits viral DNA synthesis. Evaluation of PCV in toxicologic tests and clinical trials has shown that it has a good safety profile (26). Although PCV is phosphorylated efficiently in herpes virus–infected cells, the mammalian thymidine kinases phosphorylate PCV only minimally (23). The improved pharmaceutical characteristics of PCV led us to investigate its potential use as a PET reporter probe for the HSV1-tk reporter gene.
Fluorinated acycloguanosine derivatives constitute a major class of substrates that have been investigated as reporter probes for imaging HSV1-tk gene expression (Fig. 1). These include 8-[18F]fluoroacyclovir (FACV) and 8-[18F]fluoroganciclovir (FGCV) (27–29) and preliminary investigations of 8-[18F]fluoropenciclovir (FPCV) (13).
In this work, we studied 8-[3H]PCV and FPCV as substrates for HSV1-TK and directly compared their usefulness with 8-[3H]GCV and FGCV (2). We report the noninvasive imaging of HSV1-tk reporter gene expression using an adenoviral-mediated hepatic gene delivery system and a murine xenograft tumor model. We also demonstrate the ability to successfully image the HSV1-tk and D2R reporter genes in the same animal using FPCV and FESP, respectively.
MATERIALS AND METHODS
Radiolabeled Compounds
8-[3H]GCV (485 GBq/mmol) and 8-[3H]PCV (633 GBq/mmol) were obtained from Moravek Biochemicals Inc. (La Brea, CA). Radiochemical purity, determined by high-performance liquid chromatography (HPLC), was >97%. 8-[18F]FGCV and 8-[18F]FPCV were synthesized as described (29) at a specific activity of 74–185 GBq/mmol. Radiochemical purity exceeded 99%, as determined by HPLC. The synthesis of 3-(2′-[18F]FESP at a specific activity of 74–370 GBq/μmol has been reported (30).
HPLC Analysis
8-[3H]PCV and FPCV and their metabolites from cell or tissue extracts were analyzed using HPLC with a Partisil 10 SAX column (Whatman, Inc., Clifton, NJ). The column was eluted with a linear KH2PO4 gradient (0.01–1.0 mol/L, pH 3.7; flow rate, 1 mL/min) and monitored with an ultraviolet detector (254 nm). Radioactive fractions were collected in samples taken over 1–2 min.
Radioactivity Measurements
All 3H analyses were performed with a Beckman LS-6500 liquid scintillation counter (Beckman, Fullerton, CA) with Biosafe II scintillation fluid (Research Products International, Costa Mesa, CA). Corrections for background activity and efficiency (69.7%) based on calibrated standards (Beckman) were also performed to obtain disintegrations per minute (dpm). 3H counts were also corrected for quenching effects. All 18F analyses were performed either in a dose calibrator (CRC-5R; Capintec, Ramsey, NJ) or in a well counter (Cobra II Auto-Gamma; Packard, Downers Grove, IL) with correction for efficiency differences between these two systems.
Construction and Purification of Adenoviruses
Construction, purification, and characterization of an adenovirus in which HSV1-tk is expressed from a cytomegalovirus (CMV) promoter (Ad-CMV-HSV1-tk) and a control virus that is an E1-deletion mutant have been described (6).
Cell Lines and Culture Conditions
C6 rat glioma cells (used as a control cell line) and the C6 HSV1-tk stable transfectant (C6-stb-tk+) were provided by Dr. Margaret E. Black (Washington State University). The cells were grown in Dulbecco’s modified Eagle’s medium supplemented with 5% fetal bovine serum, 0.2 mmol/L l-glutamine, 100 U/mL penicillin G, and 100 μg/mL streptomycin.
HSV1-TK Phosphorylation of 8-[3H]PCV and FPCV
8-[3H]PCV (0.002 mg/mL) was incubated at 37°C with 50 ng HSV1-TK (provided courtesy of Dr. Margaret E. Black) in the presence of TK buffer (1 mmol/L dithiothreitol, 5 mmol/L adenosine triphosphate, 5 mmol/L MgCl2, 25 mmol/L NaF, 40 mmol/L KCl, 0.5 mg/mL bovine serum albumin, and 20 mmol/L potassium phosphate buffer, pH 7.6) for 20 and 40 min. The same method was used for phosphorylation of FPCV (fixed concentration of HSV1-TK enzyme) except that the concentration of FPCV was 0.5 mg/mL and the incubation times were 60 and 120 min. A 25-μL sample of the incubation mixture was analyzed by HPLC.
Alkaline Phosphatase Treatment of Monophosphate
To 15 μL of the supernatant obtained from incubation of 8-[3H]PCV or FPCV with pure HSV1-TK enzyme was added 2.5 μL buffer (10 mmol/L ZnCl2, 10 mmol/L MgCl2, and 100 mmol/L Tris·HCl, pH 8.3) and 1 U Escherichia coli alkaline phosphatase (Sigma, St. Louis, MO). The solution was incubated at 37°C for 60 min and analyzed by HPLC.
HSV1-TK Enzyme Assay and Northern Blot Analysis
Cell or liver extracts were incubated for 20 min with 8-[3H]GCV to determine the formation of phosphorylated products. 8-[3H]GCV was separated from phosphorylated 8-[3H]GCV using a DE-81 filter (Whatman) (31) as described (6). Northern analyses were performed previously to determine the HSV1-tk messenger RNA (mRNA) levels from cell extracts and normalized to glyceraldehyde-3-phosphate dehydrogenase (GAPDH) mRNA levels (6).
In Vitro Analysis of 8-[3H]PCV and FPCV Metabolites
Cell extracts obtained after incubation of either C6 or C6-stb-tk+ cells with 8-[3H]PCV (37 kBq/mL) or FPCV (740 kBq/mL) for 15, 30, 60, 120, and 180 min were treated with 50 μL 1.5 mol/L HClO4 at 0°C for 30 min. The solutions were neutralized with cold 1N KOH and analyzed by HPLC as described (2).
Accumulation of 8-[3H]PCV and FPCV in C6-stb-tk+ Cells
Uptake of 8-[3H]PCV (37 kBq/mL; 1.4 × 10⁻⁵ mg/mL) and FPCV (111 kBq/mL; 2.4 × 10⁻⁴ mg/mL) were compared directly in C6 and C6-stb-tk+ cells. The higher concentration of FPCV is required because of its lower specific activity relative to that of 8-[3H]PCV. The uptake procedure used was the same as that reported for 8-[3H]GCV and FGCV (2). Accumulation of 8-[3H]PCV and FPCV was also correlated with levels of adenovirus, HSV1-tk mRNA, and HSV1-TK enzyme in Ad-CMV-HSV1-tk–infected cells. C6 control cells were seeded in seven t-75 flasks. Twenty-four hours later, 0.1, 0.175, 0.25, 0.375, 0.5, and 0.75 × 10⁹ plaque-forming units (pfu) of Ad-CMV-HSV1-tk virus (to produce C6 tk+ cells) or 0.75 × 10⁹ pfu of control virus (to produce C6 tk− cells) were added to the flasks. For the Ad-CMV-HSV1-tk virus flasks, control virus was also added to maintain the total viral titer fixed at 0.75 × 10⁹ pfu. The cells were incubated with 8-[3H]PCV (37 kBq/mL; 1.4 × 10⁻⁵ mg/mL) and FPCV (111 kBq/mL; 2.4 × 10⁻⁴ mg/mL) for 120 min, and accumulation was measured.
Metabolite Analysis In Vivo
Animal care and euthanasia were performed using criteria approved by the UCLA animal research committee. Swiss Webster mice were injected by tail vein with 2.0 × 10⁹ pfu of Ad-CMV-HSV1-tk or 2.0 × 10⁹ pfu of control virus. Forty-eight hours later, animals received a tail-vein injection of FPCV (5.5–6.7 MBq). Animals were killed after 180 min. Samples of mouse liver (left lobe) were removed to analyze for metabolites as reported (2).
MicroPET Imaging
Two Swiss Webster mice were studied by microPET and digital whole-body autoradiography (DWBA) using FPCV. One mouse was injected by tail vein with 1.0 × 10⁹ pfu of control virus, and the other was injected with 1.0 × 10⁹ pfu of Ad-CMV-HSV1-tk virus. Forty-eight (±1) hours later, FPCV (5.5–6.7 MBq) was injected by tail vein. The mice were imaged by microPET 1 h after FPCV injection. Immediately after microPET imaging, the animals were killed and sections were analyzed by DWBA to compare directly microPET and DWBA images for FPCV biodistribution. Mice were injected with FDG, FGCV, or FPCV (5.5–6.7 MBq) 1 h and FESP (5.5–7.4 MBq) 3 h before scanning. Mice were anesthetized with a mixture of ketamine (200 mg/kg) and xylazine (10 mg/kg) just before each scan and were imaged using the microPET scanner with the long axis of the mouse parallel to the long axis of the scanner. Acquisition time was 64 min (8 min per bed position, eight bed positions), and images were reconstructed using three-dimensional filtered backprojection or an iterative maximum a posteriori (MAP) algorithm (32) with a volumetric resolution of ∼(1.8 mm)3.
MicroPET Image Analysis
Regions of interest (ROIs) were drawn over the left liver lobe image on decay-corrected whole-body coronal images. The counts/pixel/min obtained from the ROI were converted to counts/mL/min using a calibration constant obtained from scanning a cylindric phantom in the microPET scanner. The ROI counts/mL/min were converted to counts/g/min, assuming a tissue density of 1 g/mL, and divided by the injected dose to obtain an image ROI-derived FPCV percentage injected dose per gram (%ID/g) liver. For the tumors, ROIs were drawn around the whole tumor, and the %ID/g tumor was determined as for the liver.
DWBA
Freezing, preparation of mouse whole-body coronal sections (45-μm thickness), and DWBA were performed as described (6) using a BAS 5000 PhosphorImager (Fuji Medical System, Stamford, CT) and digital plates with a resolution of ∼100 μm.
Analysis of Hepatic FPCV Retention In Vivo
Fifteen mice were injected with increasing titers of Ad-CMV-HSV1-tk virus (0.0, 0.5, 1.5, and 2.0 × 10⁹ pfu) and additional control virus to maintain the total viral titer at 2.0 × 10⁹ pfu. Forty-eight hours later, FPCV (5.5–6.7 MBq) was injected by the tail vein. The probe was allowed to distribute for 180 ± 4 min before killing the animals. Radioactivity determinations in the liver (left lobe) were normalized by the weight of the liver and the amount of radioactivity injected to obtain FPCV %ID/g liver.
Imaging HSV1-tk Reporter Gene Expression in C6 Tumors
One mouse carrying C6 control and C6-stb-tk+ tumors was injected with FDG and scanned by microPET. Twenty-four hours later, the same mouse was injected with FGCV and a second microPET scan was obtained. On the third day, the mouse was injected with FPCV and scanned again. To determine the effects of changing the order of tracer administration of FGCV or FPCV, two additional mice were scanned after FPCV injection and 24 h later were injected with FGCV and scanned again.
Imaging Two Reporter Genes in Same Animal
Two nude adult mice were implanted with C6-stb-tk+ cells on the right shoulder and D2R cells (LRGB2Zem-1 cells transfected with pMvsrc) (33) on the left shoulder. The tumors were allowed to grow for 2 wk; the mice were then anesthetized and injected with FPCV and scanned. A day later, the same mice were scanned with FESP.
RESULTS
FPCV Is Substrate for HSV1-TK Enzyme In Vitro
Both 8-[3H]PCV and FPCV are phosphorylated by HSV1-TK. When 8-[3H]PCV or FPCV is incubated with HSV1-TK, and a sample of the reaction mixture is injected onto the HPLC column, peaks with similar retention times are observed at 3.6 and 9 min. The peak at 3.6 min corresponds to the parent substrate, and the peak at 9 min is presumably that of the monophosphate. When the reaction mixture is treated with alkaline phosphatase and reanalyzed, the peak at 9 min is eliminated and the intensity of the 3.6-min peak increases, thereby confirming that the 9-min peak corresponds to the monophosphate derivative. Under identical conditions, the percentage conversion of FPCV to its monophosphate derivative is 2-fold greater than that of FGCV (2) at 1 h (23% vs. 10%, respectively) and 2 h (40% vs. 18%, respectively). Analogous observations are made with 8-[3H]PCV and 8-[3H]GCV (36% vs. 20% at 20 min and 47% vs. 30% at 40 min, respectively).
Analysis of FPCV Metabolites in C6 Cells Expressing HSV1-tk
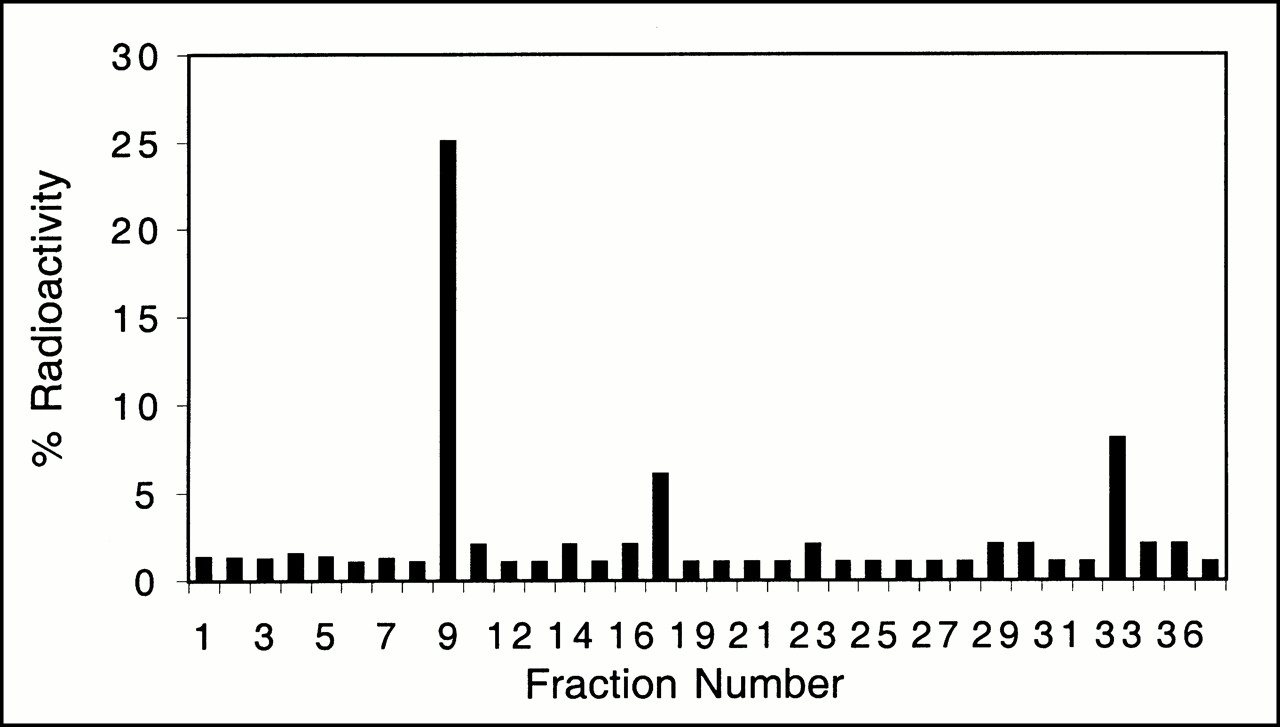
When C6-stb-tk+ cells are incubated with 8-[3H]PCV and FPCV and the cell extracts are deproteinized and injected onto an HPLC column, three major peaks at ∼9, ∼17, and ∼33 min are observed, consistent with the mono-, di-, and triphosphates, respectively. The radioactive products derived from 8-[3H]GCV or FGCV, after incubation with C6-stb-tk+ cells, have similar HPLC retention times, which suggests that PCV and FPCV are converted to similar products in these cells. At increasing incubation times, the intensity of the peaks seen at ∼17 and ∼33 min increases, whereas that of the 9-min peak decreases, consistent with cellular phosphorylation of the monophosphate of PCV and FPCV. In contrast, when C6 control cells are incubated with 8-[3H]PCV or FPCV and the cell extracts are analyzed by HPLC, no phosphate derivatives are detected. A single peak at ∼3.6 min corresponding to the parent nucleoside is observed. Some radioactivity in the C6-stb-tk+ cell extract is associated with the cellular DNA or RNA fraction for both 8-[3H]PCV (15% and 42% at 30 and 120 min, respectively) and FPCV (7% and 38% at 30 and 120 min, respectively). Less than 5% of the total radioactivity is incorporated into DNA or RNA in C6 control cells with either substrate, for incubation times up to 120 min.
C6 Cells Expressing HSV1-tk Accumulate 8-[3H]PCV and FPCV
There is a significant difference (P < 0.05) in the accumulation of 8-[3H]PCV and FPCV between C6 and C6-stb-tk+ cells for all time points ≥30 min (Fig. 2A and B). At 15 min, 8-[3H]PCV shows a significant difference (P < 0.05) in accumulation between the two cell lines. Greater accumulation for 8-[3H]PCV compared with FPCV occurs in the C6-stb-tk+ cells (P < 0.05) for all time points, even though a lower 8-[3H]PCV concentration was used. We have previously reported the accumulation of 8-[3H]GCV and FGCV in the same cell lines (2). The accumulation of 8-[3H]PCV in the C6-stb-tk+ cells is 2-fold greater than that of 8-[3H]GCV. Over a time period of 15–240 min, the accumulation of FPCV in C6-stb-tk+ cells is 1.6- to 2.5-fold greater compared with that of FGCV at equal concentrations.

Cell uptake studies. (A) 8-[3H]GCV (GCV) and 8-[3H]PCV (PCV) net accumulation in C6 control and C6-stb-tk+ cell lines as function of time. (B) FGCV and FPCV net accumulation in C6 control and C6-stb-tk+ cell lines as function of time. Data are expressed as mean ± SE from triplicate samples. 8-[3H]PCV and FPCV show greater accumulation in C6-stb-tk+ cells compared with that of 8-[3H]GCV and FGCV.
C6 cell lines transfected with varying levels of Ad-CMV-HSV1-tk virus show good correlation (r2, ∼0.7) between cellular accumulation of 18F radioactivity (range, 0.00003–0.0002 dpm cells/dpm medium/μg protein) and number of virus pfu added, HSV1-tk mRNA, and HSV1-TK enzyme (data not shown). Similar results (r2, ∼0.9) are obtained with 8-[3H]PCV, except that a larger dynamic range for accumulation of 3H radioactivity (range, 0.000079–0.0036 dpm cells/dpm medium/μg protein) and steeper slopes are noted (data not shown).
Summarizing the in vitro observations, 8-[3H]PCV and FPCV are converted to similar products, but lower accumulation and smaller dynamic range of accumulated radioactivity are observed with FPCV as a substrate than with 8-[3H]PCV for cells with equivalent levels of HSV1-TK. However, 8-[3H]PCV and FPCV accumulation is higher in the C6-stb-tk+ cells than that of 8-[3H]GCV and FGCV (2). These results show that FPCV is a better substrate for HSV1-TK than is FGCV.
FPCV Metabolite Retention In Vivo
When mice are injected by tail vein with adenoviral vectors, expression is restricted primarily to the liver (6). HPLC analysis of liver extracts from animals injected with control virus show a peak with a retention time of ∼3.6 min. Greater than 94% of the total radioactivity in the liver is in the form of FPCV. However, in mice injected with Ad-CMV-HSV1-tk virus, all four peaks corresponding to FPCV and its mono-, di-, and triphosphates are detected. The predominant peak at ∼9 min is consistent with the monophosphate of FGCV (Fig. 3). The retention times of fluorinated compounds obtained from liver samples are similar to those obtained in cell culture for both FPCV and 8-[3H]PCV and to those reported in the literature for GCV (34). Twenty percent of the radioactivity retained in the liver is associated with the DNA or RNA fraction. This suggests that FPCV can be sequestered in vivo as a result of hepatic HSV1-tk gene expression.

FPCV metabolites present in livers of mice expressing HSV1-tk. Mouse was injected with 2.0 × 10⁹ pfu of Ad-CMV-HSV1-tk virus, followed by injection of FPCV 48 h later. HPLC analysis of liver sample shows peaks corresponding to ∼9, ∼17, and ∼33 min, which likely represent FPCV mono-, di-, and triphosphates, respectively. Twenty percent of radioactivity retained in liver was present in DNA or RNA fraction (not shown).
FPCV Stability In Vivo
Ideal PET reporter substrates should not be degraded significantly to labeled metabolic forms with properties different from the original probe or to labeled forms that are retained in tissues in the absence of expression of the PET reporter gene. HPLC analysis of urine obtained from mice at 180 min after injection of FPCV indicate that >97% of the activity is present in the form of the parent substrate. FPCV is also found to clear rapidly from plasma, with <10% of injected activity remaining in plasma in 60 min. PCV has been reported to be cleared very rapidly from mouse plasma (35). Also, the stability of FPCV in plasma is determined by incubation of FPCV with plasma for 30, 60, and 120 min and analysis of the samples by HPLC. At all three time points, 95% of the injected radioactivity is found to be in the form of FPCV.
Imaging HSV1-tk Reporter Gene Expression by DWBA and MicroPET
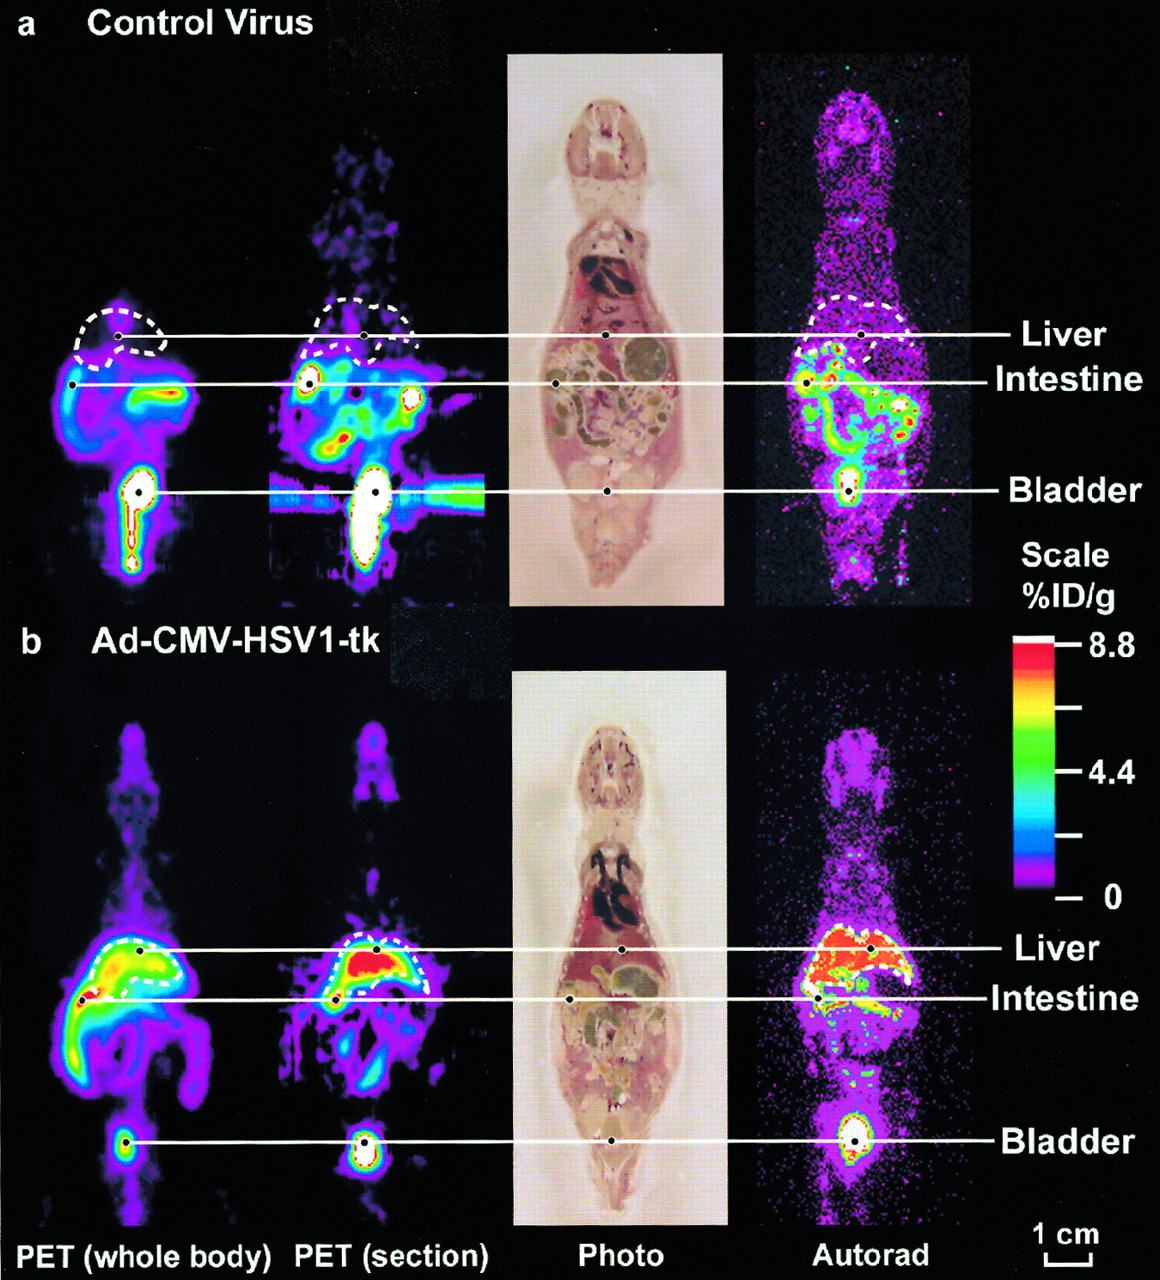
To monitor the hepatic HSV1-tk expression in Ad-CMV-HSV1-tk–infected mice, animals were injected with FPCV and imaged by microPET. After the scan, the mice were killed and liver samples were analyzed for FPCV retention (Fig. 4). The signal observed in the control liver is minimal (0.02 %ID/g liver). In contrast, a highly specific signal is visualized in the liver of the mouse injected with Ad-CMV-HSV1-tk adenovirus (8.8 %ID/g liver). Also, the ratios of maximum activity in the control and tk livers to those of the background are 1.75 and 27.8, respectively. Activity is observed in the urinary tract and the intestines of both mice because of elimination of FPCV by these routes. In living animals, HSV1-tk gene expression can be monitored by the HSV1-tk/FPCV PET reporter gene–PET reporter probe system.

Adenoviral-mediated HSV1-tk reporter gene expression imaged in living mice. Swiss Webster mice were injected by tail vein with 1.0 × 10⁹ pfu of control virus (A) or 1.0 × 10⁹ pfu of Ad-CMV-HSV1-tk virus (B). For each mouse, whole-body mean coronal projection image of 18F activity distribution is displayed on left. Liver outline, in white, was determined from FPCV signal and cryostat slices. Second images from left are coronal sections, ∼2 mm thick taken from midthickness of entire coronal sections from microPET. After PET scans were obtained, mice were killed, frozen, and sectioned. Next images are photographs of tissue sections (45-μm thickness) corresponding to approximately midthickness of microPET coronal section. Images on right are DWBA (Autorad) of these tissue sections. Color scale represents FPCV %ID/g tissue. Images are displayed on same quantitative color scale to allow signal intensity comparisons among panels. All microPET images shown used three-dimensional filtered backprojection for reconstruction. FPCV localization is clearly visualized in HSV1-tk liver (%ID/g, 8.8) and only minimal retention is observed in control tumor (%ID/g, 0.02).
Hepatic FPCV Retention as Measure of HSV1-tk Reporter Gene Expression
To quantitate the relationship between hepatic HSV1-tk expression and FPCV retention, mice injected with increasing titers of the HSV1-tk adenovirus (0–2 × 10⁹ pfu) were studied for FPCV retention. Additional control virus is added to maintain the total viral burden at 2 × 10⁹ pfu (to minimize variations, if any, in the data resulting from an unequal viral burden such as inflammatory changes caused by the immune system responding to virus). An excellent correlation is observed between FPCV %ID/g liver and the amount of virus injected (Fig. 5).

Hepatic FPCV retention as function of hepatic HSV1-tk levels. Fifteen adult Swiss Webster mice were injected by tail vein with 0–2.0 × 10⁹ pfu of Ad-CMV-HSV1-tk virus and additional control virus to maintain total viral burden at 2.0 × 10⁹ pfu. Forty-eight (±1) hours later animals received tail vein injection of FPCV. Animals were killed 180 min later. Livers were removed and analyzed for 18F accumulation. Viral titer vs. FPCV %ID/g liver (left lobe) is shown. Excellent correlation is observed between FPCV %ID/g liver and amount of virus injected.
FPCV Versus FGCV Retention in HSV1-tk–Expressing Tumors
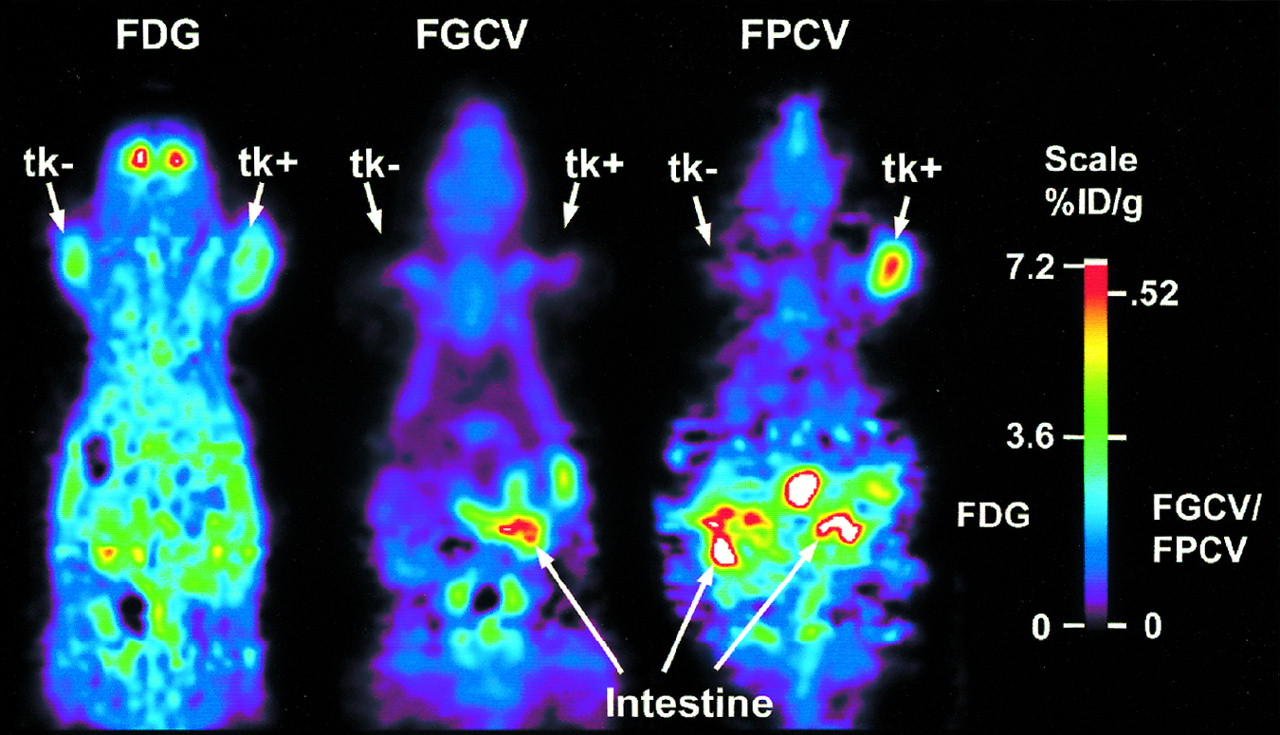
We compare the retention of FPCV with that of FGCV in C6 control and C6-stb-tk+ tumors in the same mouse model. FDG uptake is observed in both tumors (Fig. 6). In contrast, FGCV and FPCV retention is found to be significantly greater in the C6-stb-tk+ tumor than that in the control C6 tumor. Moreover, FPCV is retained to a significantly greater extent (P < 0.05) than is FGCV in the C6-stb-tk+ tumor (%ID/g tumor, 0.5 and 0.1, respectively). The ratios of maximum activity in the C6 control and C6-stb-tk+ tumors to that of the background for FGCV are 1.1 and 1.0, respectively, and the corresponding ratios in the C6 control and C6-stb-tk+ tumors using FPCV are 1.0 and 4.6, respectively. Similar studies in other mice show a range of uptake in the C6-stb-tk+ tumor to be 0.4–1.6 %ID/g tumor, with ≤ 0.1 %ID/g tumor in the control C6 tumor, and the results are not affected by obtaining FPCV images before FGCV images.

FPCV vs. FGCV retention in HSV1-tk–expressing tumors. Mouse carrying C6 control and C6-stb-tk+ tumors was injected by tail vein with FDG and scanned. Twenty-four hours later, FGCV was injected by tail vein and second microPET scan was obtained. On third day, mouse was injected with FPCV and scanned again. Images are displayed using same global maximum to allow direct comparison. Quantitative scale is shown at right. Images shown were reconstructed using MAP reconstruction algorithm. FPCV retention in C6-stb-tk+ tumors was significantly greater than that of FGCV (%ID/g tumor, 0.5 and 0.1, respectively).
Imaging Dual Reporter Genes in Same Animal
We have previously reported the usefulness of FESP reporter probe to monitor the expression of the D2R reporter gene (7). With FPCV showing very good retention in C6-stb-tk+ tumors, we imaged both the HSV1-tk and D2R reporter genes in the same animal using FPCV and FESP, respectively (Fig. 7). FPCV localization is observed primarily in the C6-stb-tk+ tumor and FESP retention is observed mainly in the D2R tumor.

Imaging D2R and HSV1-tk PET reporter genes in same animal. Mouse carrying C6-stb-tk+ tumor (right) and D2R tumor (left) was imaged by microPET for HSV1-tk reporter gene expression (using FPCV) and D2R reporter gene expression (using FESP). Both images are displayed using same global maximum to allow direct comparison. Quantitative scale is shown at right. Images shown were reconstructed with MAP reconstruction algorithm. Highly specific localization of FPCV and FESP was observed in tumors expressing HSV1-tk and D2R genes, respectively.
DISCUSSION
Our initial development of the HSV1-tk PET reporter gene system used FGCV as a PET reporter probe (2). In our earlier studies, we found that the HSV1-tk/FGCV in vivo imaging system is less sensitive than the other PET reporter gene–PET reporter probe system (D2R and FESP) (7). We have recently described an improvement in sensitivity of HSV1-tk imaging by using a mutant reporter gene (HSV1-sr39tk) that was selected from a library of HSV1-tk mutants (12). In this study, we describe the use of FPCV as a reporter probe for HSV1-tk in vitro and in vivo. We also compare directly the retention of FGCV and FPCV in C6-stb-tk+ tumors in the same animal and show that FPCV is retained to a greater extent than is FGCV.
We observe a considerable improvement in cell accumulation of radioactivity using FPCV compared with our previous results with FGCV that should lead to a greater sensitivity for the assay. FPCV accumulation is observed to be greater than that of FGCV in C6-stb-tk+ cells under equivalent levels of HSV1-tk gene expression (Figs. 2A and B). FPCV retention in the HSV1-tk liver (%ID/g, 8.8) is observed to be significantly greater than that in the control liver (%ID/g, 0.02). Moreover, FPCV accumulation is considerably greater than that of our previous results with FGCV (%ID/g, 0–3) (2) using the identical adenoviral model. We have also compared the retention of FPCV with FGCV in a tumor model in vivo. MicroPET imaging of a mouse carrying C6 control and C6-stb-tk+ tumors reveals a clearly visible, highly specific retention of FPCV in C6-stb-tk tumors. Correlating the imaging results with the immunohistochemical findings would strengthen the study by showing a spatial distribution of HSV1-tk expression as opposed to viewing just the area around the liver. The in vivo results indicate that FPCV has improved imaging characteristics over FGCV for imaging HSV1-tk reporter gene expression.
This work does not determine if the increased accumulation of FPCV over FGCV is associated with better uptake, phosphorylation by HSV1-TK, or both. Studies are currently under way to characterize the maximum velocity of an enzyme-catalyzed reaction (Vmax) and the Michaelis constant (Km) for various substrates for HSV1-TK. 8-[3H]-PCV appears to have greater retention in cells compared with FPCV, and this is likely associated with the highly electronegative fluorine in position 8, which may increase the Km. A similar pattern was seen with 8-[3H]GCV and FGCV (2). We have related the total cell radioactivity to levels of HSV1-tk gene expression. The total cell radioactivity includes some nonphosphorylated and phosphorylated tracer. Ideally, one would like to relate HSV1-tk reporter gene expression to only the phosphorylated forms of the tracer and look at the kinetics of all metabolites. However, as we showed in cell culture, control C6 cells have relatively small amounts of cell-associated radioactivity supporting small amounts of nonphosphorylated tracer at the times studied.
We have previously correlated relative HSV1-TK levels and GAPDH-normalized HSV1-tk mRNA levels with the FGCV %ID/g liver in our adenoviral model (2). In this study we have shown that FPCV accumulation in liver increases with increasing titers of the injected adenovirus but have not correlated this accumulation with direct levels of HSV1-tk reporter gene expression in liver. We are currently performing dynamic microPET studies that, together with tracer kinetic modeling (36), should help to separate the uptake and phosphorylation processes. This should allow for a better understanding of the underlying kinetics leading to an improved imaging sensitivity for FPCV.
We have also shown the ability to image dual reporter genes in the same animal with two different reporter probes using microPET. The expression of HSV1-tk and D2R reporter genes was imaged in the same living mouse, with microPET, using FPCV and FESP, respectively. There are many experimental situations in which availability of two in vivo reporter genes will be of considerable usefulness. We are currently developing models in which two cell populations can be followed in the same animal (e.g., immune and tumor cells), and these approaches will rely on the two reporter gene systems developed.
Several positron-labeled substrates have now been developed and are being studied for in vivo imaging of the HSV1-tk PET reporter gene. These include FGCV, FPCV, [124I]FIAU (2,3,6), FHPG (10,19), and FHBG (11). Each of these HSV1-tk PET reporter probes has advantages and disadvantages; variables include ease of synthesis, specificity for the HSV1-TK reporter enzyme, affinity for mammalian thymidine kinases, in vivo stability, positron yield of 124I versus 18F, and blood and tissue clearance times. We are currently investigating the use of FHBG as an alternative substrate for the wild-type HSV1-TK and mutant HSV1-sr39TK. Work is also currently under way in our laboratory to compare FIAU with FHBG and FPCV in cell culture and in vivo, using tumor and transgenic mouse models.
CONCLUSION
Human applications with the HSV1-tk reporter gene, using FPCV as the reporter probe, should allow a greater imaging sensitivity. The use of FPCV in monitoring the location(s), magnitude, and time variation of HSV1-tk suicide gene therapy (37,38) as well as its use with bicistronic vectors in which expression of any arbitrary gene can be coupled to the expression of the HSV1-tk or HSV1-sr39tk PET reporter gene (8,39,40) should now be possible. Continued development to improve gene delivery and specificity of tissue expression will be needed to make human gene therapy successful. The imaging assays developed may be limited by levels of reporter gene expression in a particular application. It remains to be seen if the levels of expression in human gene therapy trials will be high enough to be imaged using the assays developed. The continued need for improving the ability to detect lower levels of HSV1-tk reporter gene expression will be fueled by results from preliminary human gene therapy imaging studies.
Acknowledgments
The authors thank Drs. Margaret E. Black (Washington State University, Pullman, WA) for helpful discussions; the cyclotron crew, Ron Sumida, Der Jenn Liu, Judy Edwards, Alan Oshiro, and Waldemar Ladno for their technical assistance; Simon Cherry for assistance with the microPET and Alison Green for assistance with image analysis; and Diane Martin, Gene Lacson, and Debra Williams for their help in preparing this manuscript. This research was partially supported by funding from National Institutes of Health grant RO1 CA82214-01, Department of Energy contract DE-FC03-87ER60615, University of California Biotechnology Grant, Dana Foundation, and the UCLA-Jonsson Comprehensive Cancer Center.
Footnotes
Received Dec. 30, 1999; revision accepted May 30, 2000.
For correspondence or reprints contact: Sanjiv S. Gambhir, MD, PhD, UCLA School of Medicine, 700 Westwood Plaza, B3-399, BRI, Los Angeles, CA 90095-1770.
REFERENCES
In this issue


Jump to section
Related Articles
Cited By...
- Molecular Imaging with Reporter Genes: Has Its Promise Been Delivered?
- Noninvasive Monitoring of Target Gene Expression by Imaging Reporter Gene Expression in Living Animals Using Improved Bicistronic Vectors
- Synthesis and Evaluation of 2'-Deoxy-2'-18F-Fluoro-5-Fluoro-1-{beta}-D-Arabinofuranosyluracil as a Potential PET Imaging Agent for Suicide Gene Expression
- The promise of gene therapy in gastrointestinal and liver diseases
- Molecular imaging in living subjects: seeing fundamental biological processes in a new light
- Comparison of Radiolabeled Nucleoside Probes (FIAU, FHBG, and FHPG) for PET Imaging of HSV1-tk Gene Expression
- Two-step transcriptional amplification as a method for imaging reporter gene expression using weak promoters
- Progress in Gene Therapy: Seeing Is Believing
- Human Pharmacokinetic and Dosimetry Studies of [18F]FHBG: A Reporter Probe for Imaging Herpes Simplex Virus Type-1 Thymidine Kinase Reporter Gene Expression
- Reporter Genes and Imagene